Feeds:
Posts
Comments

Archive for July, 2010

In Part One we took a look at what data was available for “back radiation”, better known as Downward Longwave Radiation, or DLR. And we saw that around many locations the typical DLR was in the order of 300 W/m2, and it didn’t decrease very much at night.

In Part Two we looked at several measured spectra of DLR which clearly demonstrated that this radiation is emitted by the atmosphere.

In this article we will consider what happens when this radiation reaches the ground. The reason we want to consider it is because so many people are confused about “back radiation” and have become convinced that either it doesn’t exist – covered in the previous two parts – or it can’t actually have any effect on the temperature of the earth’s surface.

The major reason that people give for thinking that DLR can’t affect the temperature is (a mistaken understanding of) the second law of thermodynamics, and they might say something like:

A colder atmosphere can’t heat a warmer surface

There are semantics which can confuse those less familiar with thermal radiation.

If we consider the specific terminology of heat we can all agree and say that heat flows from the warmer to the colder. In the case of radiation, this means that more is emitted by the hotter surface (and absorbed by the colder surface) than the reverse.

However, what many people have come to believe is that the colder surface can have no effect at all on the hotter surface. This is clearly wrong. And just to try and avoid upsetting the purists but without making the terminology too obscure I will say that the radiation from the colder surface can have an effect on the warmer surface and can change the temperature of the warmer surface.

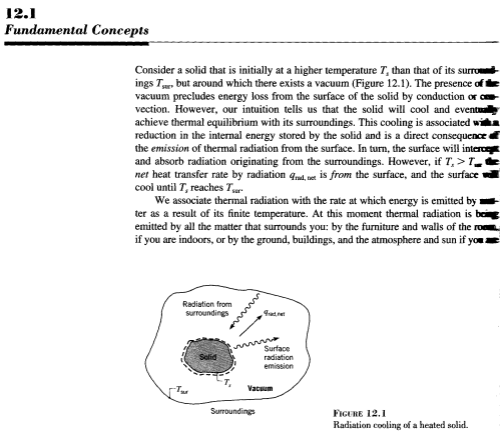
Here is an example from a standard thermodynamics textbook:

From "Fundamentals of Heat and Mass Transfer, 6th edition", Incropera and DeWitt (2007)

From "Fundamentals of Heat and Mass Transfer, 6th edition", Incropera and DeWitt (2007)

Probably this diagram should be enough, but as the false ideas have become so entrenched let’s press on..

Note that this topic has been covered before in: Intelligent Materials and the Imaginary Second Law of Thermodynamics and The First Law of Thermodynamics Meets the Imaginary Second Law

The First Law of Thermodynamics

This law says that energy is conserved – it can’t be created or destroyed. What this means is that if a surface absorbs radiation it must have an effect on the temperature – compared with the situation where radiation was not absorbed.

There’s no alternative – energy can’t be absorbed and just disappear. However, as a technical note, energy can be absorbed into chemical bonds or phase changes of materials. So you can put heat into ice without changing the temperature, while the ice turns into water. Of course, energy is still not lost..

Therefore, if your current belief is that radiation from a colder atmosphere cannot “change the temperature” of the hotter surface then you have to believe that all of the radiation from the atmosphere is reflected.

Or, alternatively, you can believe that the first law of thermodynamics is flawed. Prove this and your flight to Sweden beckons..

Bouncers at the Door – or Quantum Mechanics and the Second Law of Thermodynamics

One commenter on an earlier post asked this question:

But if at the surface the temperature is higher than in the atmospheric source then might the molecules which might have absorbed such a photon be in fact unavailable because they have already moved to a higher energy configuration due to thermal collisions in the material which contains them?

Many people have some vague idea that this kind of approach is how the second law of thermodynamics works down at the molecular level.

It (the flawed theory) goes like this:

  1. the atmosphere emits “a photon”
  2. the photon reaches the surface of the earth
  3. because the temperature of the surface of the earth is higher the photon cannot be absorbed – therefore it gets “bounced”.

Except it’s not physics in any shape or form – it just sounds like it might be.

Let’s review a few basics. It’s important to grasp these basics because they will ensure that you can easily find the flaw in the many explanations of the imaginary second law of thermodynamics.

“They all look the same to me” – The Energy of a Photon

This part is very simple. The energy of a photon, E:

E = hν = hc/λ

where ν = frequency, λ = wavelength, c = speed of light, h = 6.6 ×10⁻³⁴ J.s (Planck’s constant).

You can find this in any basic textbook and even in Wikipedia. So, for example, the energy of a 10μm photon = 2 x 10⁻²⁰ J.

Notice that there is no dependence on the temperature of the source. Think of individual photons as anonymous – a 10μm photon from a 2,000K source has exactly the same energy as a 10μm photon from a 200K source.

No one can tell them apart.

Wavelength Dependence on the Temperature of the Source

Of course, radiation from different temperature sources do have significant differences – in aggregate. What most, or all, believers in the imaginary second law of thermodynamics haven’t appreciated is how similar different temperature Planck curves can be:

Blackbody radiation curves for -10'C (263K) and +10'C (283K)

Blackbody radiation curves for -10'C (263K) and +10'C (283K)

Notice the similarity between the 10°C and the -10°C radiation curves.

Alert readers who have pieced together these basics will already be able to see why the imaginary second law is not the real second law.

If a 0°C surface can absorb radiation from 10°C radiation, it must be able to absorb radiation from -10°C radiation. And yet this would violate the imaginary second law of thermodynamics.

What determines the ability of a surface to absorb or reflect radiation?

Absorptivity and Reflectivity of Surfaces

The reflectivity of a surface is a measurement of the fraction of incident radiation reflected. It’s very simple.

This material property has a wavelength dependence and (sometimes) a directional dependence. Here is a typical graph of a few materials:

Reflectivity vs wavelength for various surfaces, Incropera (2007)

Reflectivity vs wavelength for various surfaces, Incropera (2007)

As you can see, the variation of absorptivity/reflectivity with wavelength is very pronounced. Notice as well in this diagram from a standard textbook that there is no “source temperature” function. Of course, there can’t be, as we have already seen that the energy of a photon is only dependent on its wavelength.

Just to be clear – radiation incident on a surface (irradiation) can only be absorbed or reflected. (In the case of gases, or very thin surfaces, radiation can also be “transmitted” through to the other side of the material or gas).

Conclusion from Basic Physics

So from basic physics and basic material properties it should be clear that radiation from a colder surface cannot be all reflected while at the same time radiation from a warmer surface is absorbed.

And if any radiation is absorbed it must change the surface temperature and therefore violate the (imaginary) second law of thermodynamics.

You have to ditch something. I would recommend ditching the imaginary second law of thermodynamics. But you can choose – instead you could ditch the first law of thermodynamics, or the basic equation for the energy of a photon (make up your own), or invent some new surface properties.

While considering these choices, here’s another way to think about it..

If All the “Back Radiation” Was Reflected..

So let’s suppose you still think that all of the radiation from the atmosphere, all 300W/m2 of it, gets reflected.

That presents a problem even bigger than the tedious physics principles articulated above. Why is that?

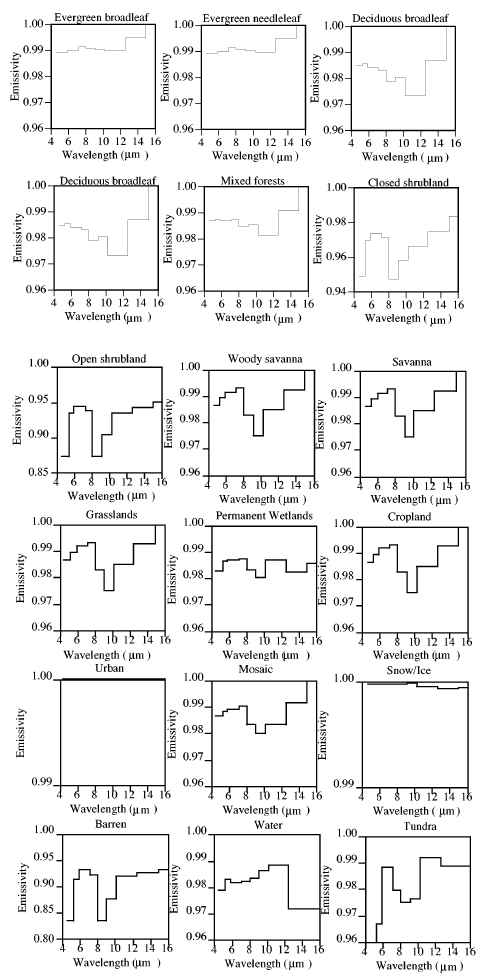
Well, let’s take the earth’s average surface temperature of around 15°C (288K) and the typical emissivity of various surface types:

Emissivity vs wavelength of various substances, Wilber (1999)

Emissivity vs wavelength of various substances, Wilber (1999)

As you can see, the emissivity is pretty close to 1. So for a temperature of 15°C the Planck curve will be pretty close to a blackbody, and the total surface emitted radiation (“flux”) is given by the Stefan-Boltzmann equation of σT4 – so in the typical surface case:

j = 390 W/m2

Now we have to add the reflected surface radiation of 300W/m2. So the upward radiation from the surface will be around 690 W/m2.

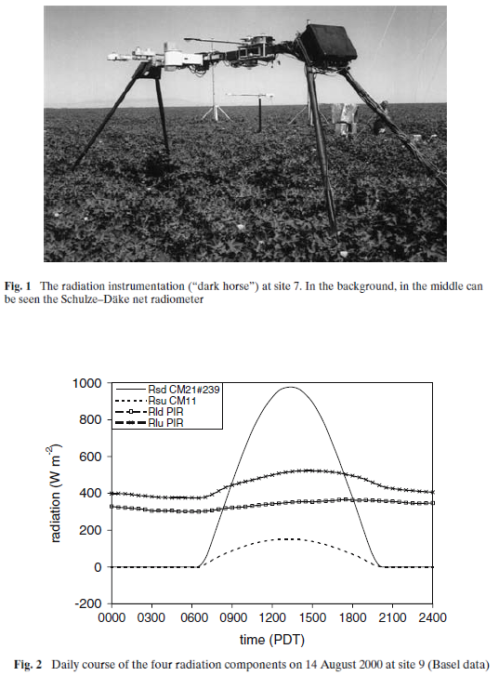
Here is one result from a very thorough experiment, The Energy Balance Experiment, EBEX 2000 (reference below):

Upward and downward radiation measurements, EBEX 2000, Kohsiek (2007)

Upward and downward radiation measurements, EBEX 2000, Kohsiek (2007)

The location was a cotton field of 800m × 1600m at coordinates 36°06’ N, 119°56’ W, approximately 20 km south-south-west of the town of Lemoore CA, USA. In this experiment, radiation measurements were taken at nine sites across the field along with wind and humidity measurements in an attempt to “close the energy budget” at the surface. Downward measurements were taken at a few of the sites (because the values wouldn’t change over a small distance) while upward measurements of both shortwave and longwave were taken at every site. Some sites measured the same value with two instruments from different manufacturers.

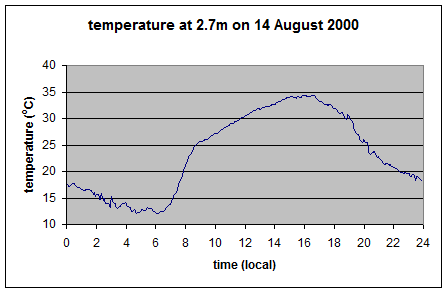
As you can see the upward longwave measurement is around 400-500 W/m2. The paper itself doesn’t record the temperature on that day, but typical August temperatures in that region peak above 35°C, leading to surface radiation values above 500 W/m2 – which is consistent with the measurements. [Update – the peak temperature measured at this location was 35°C on this day – thanks to Wim Kohsiek for providing this data along with the temperature graph for the day]

Temperature for 14 August 2000, from Wim Kohsiek, private communication

Temperature for 14 August 2000, from Wim Kohsiek, private communication

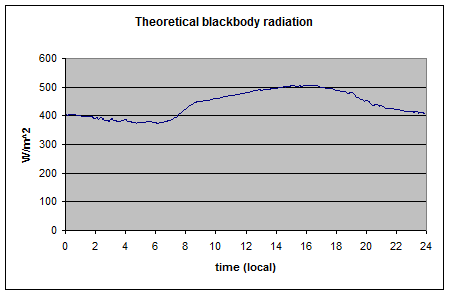
And so here it is the theoretical upward longwave radiation from the temperature graph (=σT4):

Calculated (theoretical) upward radiation, 14 August 2000

Calculated (theoretical) upward radiation, 14 August 2000

As you can see, this upward radiation calculation matches what was measured.

If the surface reflects all of the downward longwave radiation then the upward longwave measurement for these temperatures should be in the region of 700-800 W/m2.

There is a great opportunity for some enterprising people who still think that DLR is all reflected and not absorbed – buy a decent pyrgeometer and take some upward surface measurements to demonstrate that the whole science community is wrong and upward surface measurements really are 80% higher than everyone thinks. If you can afford an FT-IR to do a spectral analysis you will be able to prove your theory beyond a shadow of doubt – as the spectrum will have those characteristic CO2, O3 and water vapor peaks that were shown in DLR spectra in Part Two.

Conclusion

DLR is emitted by the atmosphere, reaches the surface and is absorbed by the surface. This absorption of energy changes the surface temperature.

The physics behind this are very basic and have been known for around 100 years.

Proving that the surface doesn’t absorb DLR should be a walk in the park for anyone with a small amount of cash. But only if it’s true.

The world we live in does absorb DLR and adding 300W/m2 to the surface energy budget is the reason why the surface temperatures are like they are.

Further reading – Do Trenberth and Kiehl understand the First Law of Thermodynamics?

Darwinian Selection – “Back Radiation”

References

The Energy Balance Experiment EBEX-2000. Part III: Behaviour and quality of the radiation measurements, Kohsiek et al, Boundary Layer Meteorology (2007)
Read Full Post »

Do Trenberth and Kiehl understand the First Law of Thermodynamics?

Yes

But many people claim that they don’t after reviewing their well-known diagram from their 1997 paper, Earth’s Annual Global Mean Energy Budget:

From Trenberth and Kiehl (1997)

From Trenberth and Kiehl (1997)

The “problem” is – how can the absorbed solar energy be 235W/m2 when the radiation from the surface is 390W/m2? Where is this energy coming from?

Clearly they have created energy and don’t understand basic physics!

There have been many comments to that effect on this blog and, of course, on many other blogs.

Instead of pointing out that many of these values can be easily measured and checked, we will turn to a simple experiment which might help the many who believe the answer to the title is “No“.

The Thought Experiment

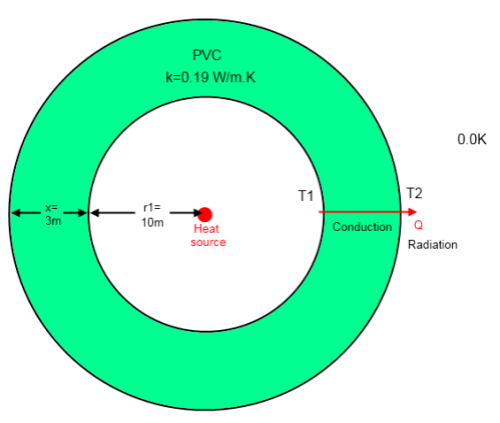
Picture, for the practical among you, building some kind of simple heat chamber in your garage. A wooden or a plastic box, with a light bulb in the center. You want to test whether some new gizmo really works at the high temperatures claimed. Or you want to find the melting point of gold.

The principle is simple – the thicker the material and the higher the energy from the bulb – the hotter it will get inside the heat chamber.

As a method of simplifying the calculations, my chamber will be spherical (because it makes the maths easier than when it is a box) and we will place it in the vastness of space and assume that the ambient temperature is 0.0K. Again, this is just to make the maths simpler to understand.

The inner radius of the sphere is 10m, and the thickness of the wall is 3m. (In a followup comment or post I will show how the values change with x).

The material used for this experiment is PVC which has a thermal conductivity of 0.19 W/m.K – I’ll explain a little more about this parameter in a moment. Probably down at such low temperatures the thermal conductivity won’t be this value but it doesn’t matter too much. We will also assume that the emissivity = 0.8.

You can see on the diagram that the outer surface temperature is T2, the temperature inside the sphere is T1 and the “ambient” is 0K. We don’t yet know what T1 or T2 is, we want to find that out.

In the center, we have our super-light-bulb, which radiates 30,000W. It is mysteriously powered, perhaps it is a nuclear device, or just electric with such a thin power cord we can’t detect it – we don’t really care.

Now – the first law of thermodynamics – energy cannot be created or destroyed. So for our thought experiment, the system receives 30,000W. The “system” is the entire PVC sphere, and everything it encompasses, right to the outer surface. No other source of energy can be detected.

Start Your Engines

Now that we have turned on the energy source the inside of the sphere will heat up. It has to keep heating up until the energy flow out of the sphere is balanced by the energy being added inside the sphere.

How does heat flow out from the center of the sphere?

  • First, by conduction to the outer surface of the sphere
  • Second, by radiation from the outer surface of the sphere to the vastness of space

Both of these processes are governed by very simple equations which are shown in the maths section at the end. Here, I will just attempt to explain conceptually how the processes work.

We start with consideration of the complete system and after equilibrium is reached the energy gained will be equal to the energy lost.

Energy gained, q = 30,000W = Energy lost

(Note that we are considering energy per second). For a rigid stationary body in the vastness of space, the only mechanism for losing energy is radiating it. All bodies radiate according to their temperature and a property called emissivity. Using the Stefan-Boltzmann law, we can calculate that:

Outer surface temperature, T2 = 133K

With this temperature, at an emissivity of 0.8, the whole sphere is radiating away 30,000W.

Time Out

So at this point, surely everyone is in agreement. We have calculated the steady-state temperature of the outer surface of the sphere as 133K. We can see that the mysterious energy source of 30,000W is balanced by the outgoing 30,000W radiated away from the outer surface.

The first law of thermodynamics is still intact and no one has to fight about anything..

Systems check?

But What’s the Story Inside?

We also want to calculate T1, the temperature of the inner surface. This is also very easy to calculate. The only mechanism for transferring heat from the inner surface (where the energy source is located) to the outer surface is by conduction.

The maths is below but effectively heat is transferred through a wall when there is a temperature differential between two surfaces. The higher the differential, the more heat. And the property of the material that affects this process is called the thermal conductivity. When this value is high – like for a metal – heat is transferred very effectively. When this value is low – like for a plastic – heat is transferred much less efficiently.

Once the system is generating 30,000W internally the inner wall temperature will keep rising until 30,000W can flow through the wall and be radiated away from the outer surface.

If we use the simple maths to calculate the temperature differential we find that it is 290K.

That is, to get 30,000W to flow through a hollow sphere with inner radius 10m and outer radius 13m and conductivity of 0.19 W/m.K you need a temperature differential of 290K.

Which means that the inner surface is 423K.

Everyone still ok?

What is the Radiation Emitted from the Inner Surface?

With an emissivity of 0.8 and a surface temperature of 423K, the inner surface will be radiating at 1,452 W/m2.

So the total radiation from the inner surface will be 1,824,900W.

What??? You have created energy!!!

Before bringing out the slogans, find out which step is wrong. If you can’t find an incorrect step then perhaps you should consider the possibility that this system is not violating the first law of thermodynamics.

Well, perhaps everyone is comfortable with the idea that with sufficient insulation you can raise the inner temperature of a box or sphere to a very high value – without having to build a power station.

In any case, the system is not creating energy. Inner surfaces are receiving high amounts of radiation while also emitting high amounts of radiation – they are in balance.

And of course, this has nothing whatever to do with the earth’s climate system so everyone can rest easy..

Update – Do Trenberth and Kiehl understand the First Law of Thermodynamics? – Part Two

Do Trenberth and Kiehl understand the First Law of Thermodynamics? Part Three – The Creation of Energy?

And new article on the real basics – Heat Transfer Basics – Part Zero

Maths

The System

In equilibrium, the outer surface of the sphere has to radiate away all of the heat generated internally. This is the first law of thermodynamics.

The internal energy source,  q  = energy radiated from the outer surface

q = εσT24.4πr22 – the Stefan-Boltzmann equation for emitted energy per m2 x the surface area

where r2 = radius of the outer surface = 10 + 3 = 13

If q = 30,000W, r2 = 13m and ε = 0.8

T2 = q / (εσ.4πr22)1/4 and so T2 = 133K

If you recalculate back using the Stefan-Boltzmann law you will find that 133K with an emissivity of 0.8 radiates at 14.2 W/m2 (corrected-thanks to John N-G) and if you multiply that by the surface area of 4×3.14×132 = 2,124 m2 you find the emitted energy = 30,000W.

Conduction through the Sphere

The equation of heat conduction is very simple:

q = -kA . ΔT/Δx

This is for a planar wall. For a hollow sphere the equation is quite similar:

qr = -kA . dT/dr = – k (4πr2) . dT/dr and the important point is that qr is a constant, independent of r

After a small amount of maths we find that:

qr = 4πk . (T1 – T2) / (1/r1 – 1/r2)

So for the values of k = 0.19, r1 = 10, r2 = 13:

T1 – T2 = 290, therefore, T1 = 423K

Internal Radiation

Therefore, the radiated energy from the inner surface will be 1,452 W/m2 or a total of 1,824,900W (= εσT14.4πr12).

Read Full Post »

I didn’t think that a Part Two would be needed after the initial installment – The Sun and Max Planck Agree

Anyway, I always appreciate commenters explaining why the article hasn’t done its job, and so following various comments, hopefully, this article can address the deficiencies of the first.

I recommend reading the First Article before diving into this one. The main thrust of the article was to explain that solar radiation and terrestrial radiation have quite different “signatures”, or properties, which enable us to easily tell them apart.

For reader unfamiliar with how radiation varies with wavelength, here are two “blackbody” curves:


Blackbody radiation curves for -10'C (263K) and +10'C (283K)

Blackbody radiation curves for -10'C (263K) and +10'C (283K)


What you can notice is that the curve for 10°C radiation is – at all wavelengths – greater than the curve at -10°C radiation. The peak radiation for both of these curves occurs around 10μm. This is Wien’s law where the peak occurs at:

λpeak = 2898/T

where λpeak is the wavelength of peak radiation. So for 283K (10°C) the peak wavelength = 10.6μm. But radiation – as you can see – occurs at all wavelengths.

The total radiation from a body varies in proportion to T4, and here is the comparison of solar (at 5780K) and terrestrial radiation (at 260-300K):

Where is the terrestrial radiation? It can’t be seen on a linear plot, it is so small.

Let’s see it on a log plot:

For those not used to seeing log plots, check out the left hand side axis – the peak of the 300K radiation is around 1000x lower than the solar radiation at that wavelength (each major division corresponds to a factor of 10). And the spectral intensity of the higher temperature radiation exceeds the value of the lower temperature radiation at every wavelength.

This is the radiation measurement you would get from a spaceship parked just off the surface of the sun (for the solar radiation at 5780K) and just off the earth (for the terrestrial radiation of 260 – 300K).

The earth is some distance away from the sun and so the radiation at the top of the earth’s atmosphere will be reduced quite a lot.

If we consider the radiation from the sun expressed as per m2 then the solar radiation incident on the earth’s atmosphere will be reduced by a factor of (rsun / distancesun-earth)2 – this is known as the inverse square law – and there is a nice explanation at Wikipedia.

The amount the solar radiation is reduced for top of atmosphere = (696×106/150×109)2 = 1 / 2152 = 1 / 46,225.

(If we calculated it the other way, we would work out the total solar radiation from the whole surface area and conclude that this value must be divided by 2×10⁹).

So if we look at the incident solar radiation at top of atmosphere (TOA) compared with terrestrial radiation:

We can see that the cross-over is quite small.

And this is not the whole story. Some solar radiation is reflected from the earth (on average around 30%). And depending on the angle of the sun from the zenith, the amount of solar radiation per m2 will be reduced accordingly.

So the above graph is the best case.

If we take the average of 30% of solar reflected, and at an angle from the zenith of 45°, we will have these curves:

You can see the crossover is very low.

Just for completeness, here it is on a linear plot, with the crossover section clear:

Hopefully, it’s clear, hopefully, there is no possibility of confusion – solar radiation can be easily distinguished from terrestrial radiation within the earth’s climate system.

If we measure radiation > 4μm we can conclude it is terrestrial and if we measure radiation < 4μm we can conclude it is solar.

Of course, at night, it is even clearer.

Read Full Post »

In Part One we took a look at what data was available for “back radiation”, better known as Downward Longwave Radiation, or DLR.

The fact that the data is expensive to obtain doesn’t mean that there is any doubt that downward longwave radiation exists and is significant. It’s no more in question than the salinity of the ocean.

There appear to be three difficulties in many people’s understanding of DLR:

  1. It doesn’t exist
  2. It’s not caused by the inappropriately-named “greenhouse” gases
  3. It can’t have any effect on the temperature of the earth’s surface

There appear to be many tens of variants of arguments around these three categories and it’s impossible to cover them all.

What’s better is try and explain why each category of argument is in error.

Part One covered the fact that DLR exists and is significant. What we will look at in this article is what causes it. Remember that we can measure this DLR at night, and the definition of DLR is that it is radiation > 4μm.

99% of solar radiation is <4μm – see The Sun and Max Planck Agree. Solar and longwave radiation are of a similar magnitude (at the top of atmosphere) therefore when we measure radiation with a wavelength > 4μm we know that it is radiated from the surface or from the atmosphere.

Data from the BSRN network, courtesy of the World Radiation Monitoring Center

Data from the BSRN network, courtesy of the World Radiation Monitoring Center

Notice that the night-time radiation (midnight local time = 6am UTC) is not a lot lower than the peak daytime radiation. The atmosphere cools down slower than the surface of the land (but faster than the ocean).

This by itself should demonstrate that what we are measuring is from the atmosphere, not solar radiation – otherwise the night-time radiation would drop to zero.

More DLR measurements from Alice Springs, Australia. Latitude: -23.798000, Longitude: 133.888000. BSRN station no. 1; Surface type: grass; Topography type: flat, rural.

Summer measurements over 4 days:

Forgan, Bruce (2007): Basic measurements of radiation at station Alice Springs (2000-06)

Forgan, Bruce (2007): Basic measurements of radiation at station Alice Springs (2000-06)

Winter measurements over 4 days:

Forgan, Bruce (2007): Basic measurements of radiation at station Alice Springs (2000-06)

Forgan, Bruce (2007): Basic measurements of radiation at station Alice Springs (2000-06)

This radiation is not solar and can only be radiation emitted from the atmosphere.

Properties of Gases – Absorption and Emission

As we can see from the various measurements in Part One, and the measurements here, the amount of radiation from the atmosphere is substantial – generally in the order of 300W/m2 both night and day. What causes it?

If measurements of longwave radiation at the surface are hard to come by, spectral measurements are even more sparse, again due to the expense of a piece of equipment like an FT-IT (Fourier Transform Infrared Spectroscope).

You can see some more background about absorption and emission in CO2 – An Insignificant Trace Gas? – Part Two.

A quick summary of some basics here – each gas in the atmosphere has properties of absorption and emission of electromagnetic radiation – and each gas is different. These are properties which have been thoroughly studied in the lab, and in the atmosphere. When a photon interacts with a gas molecule it will be absorbed only if the amount of energy in the photon is a specific amount – the right quantum of energy to change the state of that molecule – to make it vibrate or rotate, or a combination of these.

The amount of energy in a photon is dependent on its wavelength.

This post won’t be about quantum mechanics so we’ll leave the explanation of why all this absorption happens in such different ways for N2 vs water vapor (for example) and concentrate on a few simple measurements.

The only other important point to make is that if a gas can absorb at that wavelength, it can also emit at that wavelength – and conversely if a gas can’t absorb at a particular wavelength, it can’t emit at that wavelength.

Here are some absorption properties of different gases in the atmosphere:

From the HITRANS database from spectralcalc.com

From the HITRANS database from spectralcalc.com

And for those not used to this kind of graph, the vertical axis is on a logarithmic scale. This means that each horizontal line is a factor of 10.

So if we take the example of oxygen (O2) at 6-7μm the absorption is a factor of 1,000,000,000 times (1 billion times) lower than water vapor at those wavelengths.

Water vapor – as you can see above – absorbs across a very wide range of wavelengths. But if we take a look at CO2 and water vapor in a small region centered around 15μm we can see how different the absorption is:

From the HITRANS database from spectralcalc.com

From the HITRANS database from spectralcalc.com

We know the absorption properties of each gas at each wavelength and therefore we also know the emission properties of each gas at each wavelength.

So when we measure the spectrum of a radiating body we can calculate the energy in each part of the spectrum and calculate how much energy is coming from each gas. There is nothing at all controversial in this – not in physics anyway.

Measured Spectra of Downward Longwave Radiation

Now we know how to assess the energy radiated from each gas we just need some spectral plots of DLR.

Remember in Part One I commented about one of the papers:

Their paper isn’t about establishing whether or not atmospheric radiation exists. No one in the field doubts it, any more than anyone doubts the existence of ocean salinity. This paper is about establishing a better model for calculating DLR – as expensive instruments are not going to cover the globe any time soon.

If we want to know the total DLR and spectral DLR at every point over the globe there is no practical alternative to using models. So what these papers are almost always about is a model to calculate total DLR – or the spectrum of DLR – based on the atmospheric properties at the time. The calculated values are compared with the measurements to find out how good the models are – and that is the substance of most of the papers.

By the way, when we talk about models – this isn’t “predicting the future climate in the next decade using a GCM” model, this is simply doing a calculation – albeit a very computationally expensive calculation – from measured parameters to calculate other related parameters that are more difficult to measure. The same way someone might calculate the amount of stress in a bridge during summer and winter from a computer model. Well, I digress..

What DLR spectral measurements do we have? All from papers assessing models vs measurements..

One place that researchers have tested models is Antarctica. This is because by finding the driest place on earth, it eliminates the difficulties involved in the absorption spectrum of water vapor and the problems of knowing exactly how much water vapor is in the atmosphere at the time the spectral measurements were taken. This helps test the models = solving the radiative transfer equations. In this first example, from Walden (1998), we can see that the measurements and calculations are very close:

Antarctica - Walden (1998)

Antarctica - Walden (1998)

Note that in this field we usually see plots against wavenumber in cm-1 rather than a plot against wavelength in μm. I’ve added wavelength to each plot to make it easier to read.

I’ll comment on the units at the end, because unit conversion is very dull – however, some commenters on this blog have been confused by how to convert radiance (W/m2.sr.cm-1) into flux (W/m2). For now, note that the total DLR value measured at the time the spectrum was taken was 76 W/m2.

We can see that the source of this DLR was CO2, ozone, methane, water vapor and nitrous oxide. Oxygen and nitrogen emit radiation a billion times lower intensity at their peak.

The proportion of DLR from CO2 is much higher than we would see in the tropics, simply because of the lack of water vapor in Antarctica.

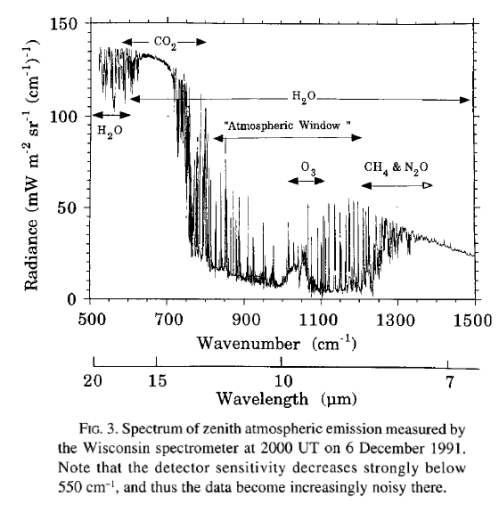
Here is a spectrum measured in Wisconsin from Ellingson & Wiscombe (1996):

Wisconsin, Ellingson & Wiscombe (1996)

Wisconsin, Ellingson & Wiscombe (1996)

We see a similar signal to Antarctica with a higher water vapor signal. Notice, as just one point of interest, that the CO2 value is of a higher magnitude than in Antarctica – this is because the atmospheric temperature is higher in Wisconsin than in Antarctica. This paper didn’t record the total flux.

From Evans & Puckrin (2006) in Canada:

Canada, Evans (2006)

Canada in winter, Evans & Puckrin (2006)

By now, a familiar spectrum, note the units are different.

Canada in summer, Evans & Puckrin (2006)

Canada in summer, Evans & Puckrin (2006)

And a comparison with summer with more water vapor.

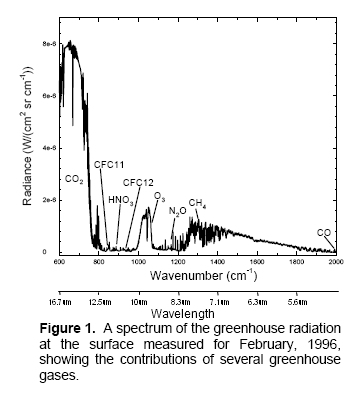
From Lubin et al (1995) – radiation spectrum from the Pacific:

Pacific, Lubin (1995)

Pacific, Lubin (1995)

Alternative Theories

Some alternative theories have been proposed from outside of the science community:

  • DLR is “reflected surface radiation” by the atmosphere via Rayleigh scattering
  • DLR is just poor measurement technology catching the upward surface radiation

A very quick summary on the two “ideas” above.

Rayleigh scattering is proportional to λ-4, where λ is the wavelength. That’s not easy to visualize – but in any case Rayleigh scattering is not significant for longwave radiation. However, to give some perspective, here are the relative effects of Rayleigh scattering vs wavelength:

So if this mechanism was causing DLR we would measure a much higher value for lower wavelengths (higher wavenumbers). Just for easy comparison with the FTIR measurements above, the above graph is converted to wavenumber to orientate it in the same direction:

Compare that with the measured spectra above.

What about upward surface radiation being captured without the measurement people realizing (measurement error)?

If that was the case the measured spectrum would follow the Planck function quite closely, e.g.:

Blackbody radiation curves for -10'C (263K) and +10'C (283K)

Blackbody radiation curves for -10'C (263K) and +10'C (283K)

(Once again you need to mentally reverse the horizontal axis to have the same orientation as the FTIR measurements).

As we have seen, the spectra of DLR show the absorption/emission spectra of water vapor, CO2, CH4, O3 and NO2. They don’t match Rayleigh scattering and they don’t match surface emission.

Conclusion

The inescapable conclusion is that DLR is from the atmosphere. And for anyone with a passing acquaintance with radiation theory, this is to be expected.

If the atmosphere did not radiate at the spectral lines of water vapor, CO2, CH4 and O3 then radiation theory would need to be drastically revised. The amount of radiation depends on the temperature of the atmosphere as well as the concentration of radiative gases, so if the radiation was zero – a whole new theory would be needed.

Why does the atmosphere radiate? Because it is heated up via convection from the surface, solar radiation and surface radiation. The atmosphere radiates according to its temperature, in accordance with Planck’s law and at wavelengths where gas molecules are able to radiate.

There isn’t any serious theory that the atmosphere doesn’t emit radiation. If the atmosphere is above absolute zero and contains gases that can absorb and emit longwave radiation (like water vapor and CO2) then it must radiate.

And although the proof is easy to see, no doubt there will be many “alternative” explanations proposed..

Update – Part Three now published

Darwinian Selection – “Back Radiation”

References

Measurements of the downward longwave radiation spectrum over the Antarctic plateau and comparisons with a line-by-line radiative transfer model for clear skies, Walden et al, Journal of Geophysical Research (1998)

The spectral radiance experiment (SPECTRE): Project Description and Sample Results, Ellingson & Wiscombe, Bulletin of the AMU (1996)

Measurements of the radiative surface forcing of climate, Evans & Puckrin, 18th Conference on Climate Variability and Change, (2006)

Spectral Longwave Emission in the Tropics, Lubin et al, Journal of Climate (2005)

Read Full Post »

This could have been included in the Earth’s Energy Budget series, but it deserved a post of its own.

First of all, what is “back-radiation” ? It’s the radiation emitted by the atmosphere which is incident on the earth’s surface. It is also more correctly known as downward longwave radiation – or DLR

What’s amazing about back-radiation is how many different ways people arrive at the conclusion it doesn’t exist or doesn’t have any effect on the temperature at the earth’s surface.

If you want to look at the top of the atmosphere (often abbreviated as “TOA”) the measurements are there in abundance. This is because (since the late 1970’s) satellites have been making continual daily measurements of incoming solar, reflected solar, and outgoing longwave.

However, if you want to look at the surface, the values are much “thinner on the ground” because satellites can’t measure these values (see note 1). There are lots of thermometers around the world taking hourly and daily measurements of temperature but instruments to measure radiation accurately are much more expensive. So this parameter has the least number of measurements.

This doesn’t mean that the fact of “back-radiation” is in any doubt, there are just less measurement locations.

For example, if you asked for data on the salinity of the ocean 20km north of Tangiers on 4th July 2004 you might not be able to get the data. But no one doubts that salt was present in the ocean on that day, and probably in the region of 25-35 parts per thousand. That’s because every time you measure the salinity of the ocean you get similar values. But it is always possible that 20km off the coast of Tangiers, every Wednesday after 4pm, that all the salt goes missing for half an hour.. it’s just very unlikely.

What DLR Measurements Exist?

Hundreds, or maybe even thousands, of researchers over the decades have taken measurements of DLR (along with other values) for various projects and written up the results in papers. You can see an example from a text book in Sensible Heat, Latent Heat and Radiation.

What about more consistent onging measurements?

The Global Energy Balance Archive contains quality-checked monthly means of surface energy fluxes. The data has been extracted from many sources including periodicals, data reports and unpublished manuscripts. The second table below shows the total amount of data stored for different types of measurements:

From "Radiation and Climate" by Vardavas & Taylor (2007)

From "Radiation and Climate" by Vardavas & Taylor (2007)

You can see that DLR measurements in the GEBA archive are vastly outnumbered by incoming solar radiation measurements. The BSRN (baseline surface radiation network) was established by the World Climate Research Programme (WCRP) as part of GEWEX (Global Energy and Water Cycle Experiment) in the early 1990’s:

The data are of primary importance in supporting the validation and confirmation of satellite and computer model estimates of these quantities. At a small number of stations (currently about 40) in contrasting climatic zones, covering a latitude range from 80°N to 90°S (see station maps ), solar and atmospheric radiation is measured with instruments of the highest available accuracy and with high time resolution (1 to 3 minutes).

Twenty of these stations (according to Vardavas & Taylor) include measurements of downwards longwave radiation (DLR) at the surface. BSRN stations have to follow specific observational and calibration procedures, resulting in standardized data of very high accuracy:

  • Direct SW  – accuracy 1% (2 W/m2)
  • Diffuse radiation – 4% (5 W/m2)
  • Downward longwave radiation, DLR – 5% (10 W/m2)
  • Upward longwave radiation – 5% (10 W/m2)

Radiosonde data exists for 16 of the stations (radiosondes measure the temperature and humidity profile up through the atmosphere).

Click for a larger image

A slightly earlier list of stations from 2007:

From "Radiation and Atmosphere" by Vardavas & Taylor (2007)

From "Radiation and Atmosphere" by Vardavas & Taylor (2007)

Solar Radiation and Atmospheric Radiation

Regular readers of this blog will be clear about the difference between solar and “terrestrial” radiation. Solar radiation has its peak value around 0.5μm, while radiation from the surface of the earth or from the atmosphere has its peak value around 10μm and there is very little crossover. For more details on this basic topic, see The Sun and Max Planck Agree

.

Radiation vs Wavelength -Sun and Earth

Radiation vs Wavelength - Sun and Earth

What this means is that solar radiation and terrestrial/atmospheric radiation can be easily distinguished. Conventionally, climate science uses “shortwave” to refer to solar radiation – for radiation with a wavelength of less than 4μm – and “longwave” to refer to terrestrial or atmospheric radiation – for wavelengths of greater than 4μm.

This is very handy. We can measure radiation in the wavelengths > 4μm even during the day and know that the source of this radiation is the surface (if we are measuring upward radiation from the surface) or the atmosphere (if we are measuring downward radiation at the surface). Of course, if we measure radiation at night then there’s no possibility of confusion anyway.

Papers

Here are a few extracts from papers with some sample data.

Downward longwave radiation estimates for clear and all-sky conditions in the Sertãozinho region of São Paulo, Brazil by Kruk et al (2010):

Atmospheric longwave radiation is the surface radiation budget component most rarely available in climatological stations due to the cost of the longwave measuring instruments, the pyrgeometers, compared with the cost of pyranometers, which measure the shortwave radiation. Consequently, the estimate of longwave radiation for no-pyrgeometer places is often done through the most easily measured atmospheric variables, such as air temperature and air moisture. Several parameterization schemes have been developed to estimate downward longwave radiation for clear-sky and cloudy conditions, but none has been adopted for generalized use.

Their paper isn’t about establishing whether or not atmospheric radiation exists. No one in the field doubts it, any more than anyone doubts the existence of ocean salinity. This paper is about establishing a better model for calculating DLR – as expensive instruments are not going to cover the globe any time soon. However, their results are useful to see.

The data was measured every 10 min from 20 July 2003 to 18 January 2004 at a micrometeorological tower installed in a sugarcane plantation. (The experiment ended when someone stole the equipment). This article isn’t about their longwave radiation model – it’s just about showing some DLR measurements:

In another paper, Wild and co-workers (2001) calculated some long term measurements from GEBA: Data from GEBA for selected=

This paper also wasn’t about verifying the existence of “back-radiation” – it was assessing the ability of GCMs to correctly calculate it. So you can note the long term average values of DLR for some European stations and one Japanese station. The authors also showed the average value across the stations under consideration:

And station by station month by month (the solid lines are the measurements):

Wild (2001)

Wild (2001)

Click on the image for a larger view

In another paper, Morcrette (2002) produced a comparison of observed and modeled values of DLR for April-May 1999 in 24 stations (the columns headed Obs are the measured values):

Morcrette (2002)

Morcrette (2002)

Click for a larger view

Once again, the paper wasn’t about the existence of DLR, but about the comparison between observed and modeled data. Here’s the station list with the key:

Click for a larger view

BSRN data

Here is a 2-week extract of DLR for Billings, Oklahoma from the BSRN archives. This is BSRN station no. 28, Latitude: 36.605000, Longitude: -97.516000, Elevation: 317.0 m, Surface type: grass; Topography type: flat, rural.

Data from the BSRN network, courtesy of the World Radiation Monitoring Center

Data from the BSRN network, courtesy of the World Radiation Monitoring Center

And 3 days shown in more detail:

Data from the BSRN network, courtesy of the World Radiation Monitoring Center

Data from the BSRN network, courtesy of the World Radiation Monitoring Center

Note that the time is UTC so “midday” in local time will be around 19:00 (someone good at converting time zones in October can tell me exactly).

Notice that DLR does not drop significantly overnight. This is because of the heat capacity of the atmosphere – it cools down, but not as quickly as the ground.

DLR is a function of the temperature of the atmosphere and of the concentration of gases which absorb and emit radiation – like water vapor, CO2, NO2 and so on.

We will look at this some more in a followup article, along with the many questions – and questionable ideas – that people have about “back-radiation”.

Update: The Amazing Case of “Back-Radiation” – Part Two

The Amazing Case of “Back Radiation” – Part Three

Darwinian Selection – “Back Radiation”

Notes

Note 1 – Satellites can measure some things about the surface. Upward radiation from the surface is mostly absorbed by the atmosphere, but the “atmospheric window” (8-12μm) is “quite transparent” and so satellite measurements can be used to calculate surface temperature – using standard radiation transfer equations for the atmosphere. However, satellites cannot measure the downward radiation at the surface.

References

Radiation and Climate, I.M. Vardavas & F.W. Taylor, International Series of Monographs on Physics – 138 by Oxford Science Publications (2007)

Downward longwave radiation estimates for clear and all-sky conditions in the Sertãozinho region of São Paulo, Brazil, Kruk et al, Theoretical Applied Climatology (2010)

Evaluation of Downward Longwave Radiation in General Circulation Models, Wild et al, Journal of Climate (2001)

The Surface Downward Longwave Radiation in the ECMWF Forecast System, Morcrette, Journal of Climate (2002)

Read Full Post »

This article follows:

  • Part One – which explained a few basics in energy received and absorbed, and gave a few useful “numbers” to remember
  • Part Two – which explained energy balance a little more
  • Part Three – which explained how the earth radiated away energy and how more “greenhouse” gases might change that

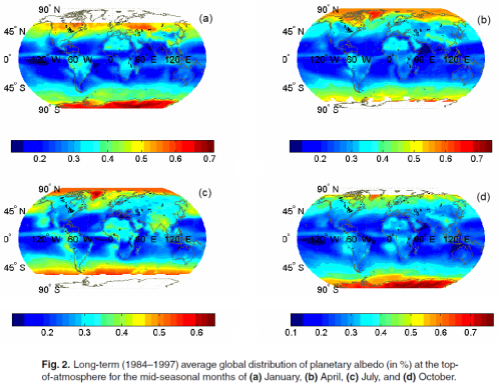
What is albedo? Albedo, in the context of the earth, is the ratio of reflected solar radiation to incident solar radiation. Generally the approximate value of 30% is given. This means that 0.3 or 30% of solar radiation is reflected and therefore 0.7 or 70% is absorbed.

Until the first satellites started measuring reflected solar radiation in the late 1970’s, albedo could only be estimated. Now we have real measurements, but reflected solar radiation is one of the more challenging measurements that satellites make. The main reason for this is reflected solar radiation takes place over all angles, making it much harder for satellites to measure compared with, say, the outgoing longwave radiation.

Reflected solar radiation is one of the major elements in the earth’s radiation budget.

Over the 20th century, global temperatures increased by around 0.7°C. Increases in CO2, methane and other “greenhouse” gases have a demonstrable “radiative forcing”, but changes in planetary albedo cannot be ruled out as also having a significant effect on global temperatures. For example, if the albedo had reduced from 31% to 30% this would produce an increase in radiative forcing (prior to any feedbacks) of 3.4W/m2 – of similar magnitude to the calculated (pre-feedback) effects from “greenhouse” gases.

Average global variation in albedo (top) and reflected solar radiation (bottom)

from Hatzianastassiou (2004)

from Hatzianastassiou (2004)

(click on the image for a larger picture)

(click on the image for a larger picture)

The first measurements of albedo were from Nimbus-7 in 1979, and the best quality measurements were from ERBE from November 1984 to February 1990. There is a dataset of measurements from 1979 to 1993 but not from the same instruments, and then significant gaps in the 1990s until more accurate instruments (e.g. CERES) began measurements. Satellite data of reflected solar radiation from latitudes above 70° is often not available. And comparisons between different ERB datasets show differences of comparable magnitude to the radiative forcing from changes in “greenhouse” gases.

Therefore, to obtain averages or time series over more than a decade requires some kind of calculation. Most of the data in this article is from Hatzianastassiou et al (2004) – currently available here.

The mean monthly shortwave (SW) radiation budget at the top of atmosphere (TOA) was computed on 2.5 longitude-latitude resolution for the 14-year period from 1984 to 1997, using a radiative transfer model with long-term climatological data from the International Satellite Cloud Climatology Project (ISCCP-D2)..

The model was checked against the best data:

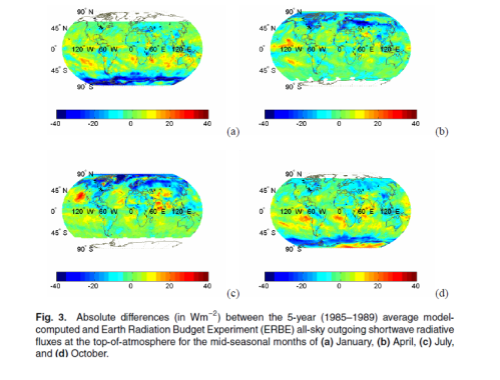
The model radiative fluxes at TOA were validated against Earth Radiation Budget Experiment (ERBE) S4 scanner satellite data (1985–1989).

The results were within 1% of ERBE data, which is within the error estimates of the instrument. (See “Model Comparison” at the end of the article).

It is important to understand that using a model doesn’t mean that a GCM produced (predicted) this data. Instead all available data was used to calculate the reflected solar radiation from known properties of clouds, aerosols and so on. However, it also means that the results aren’t perfect, just an improvement on a mixture of incomplete datasets.

Here is the latitudinal variation of incident solar radiation – note that the long-term annual global average is around 342 W/m2 – followed by “outgoing” or reflected solar radiation, then albedo:

Shortwave received and reflected plus albedo, Hatzianastassiou (2004)

Shortwave received and reflected plus albedo, Hatzianastassiou (2004)

The causes of reflected solar radiation are clouds, certain types of aerosols in the atmosphere and different surface types.

The high albedo near the poles is of course due to snow and ice. Lower albedo nearer the equator is in part due to the low reflectivity of the ocean, especially when the sun is high in the sky.

Typical values of albedo for different surfaces (from Linacre & Geerts, 1997)

  • Snow                                     80%
  • Dry sand in the desert        40%
  • Water,  sun at 10°              38%  (sun close to horizon)
  • Grassland                            22%
  • Rainforest                           13%
  • Wet soil                               10%
  • Water, sun at 25°               9%
  • Water, sun at 45°               6%
  • Water, sun at 90°                3.5%  (sun directly overhead)

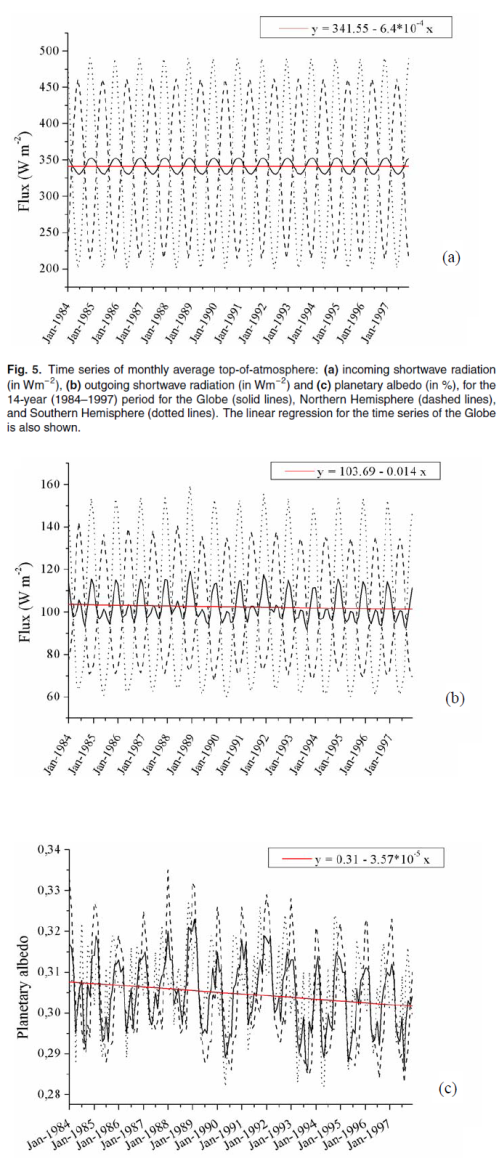
Here is the data on reflected solar radiation and albedo as a time-series for the whole planet:

Time series changes in solar radiation and albedo, Hatzianastassiou (2004)

Time series changes in solar radiation and albedo, Hatzianastassiou (2004)

(click on the image for a larger picture)

Over the time period in question:

The 14-year (1984–1997) model results, indicate that Earth reflects back to space 101.2Wm-2 out of the received 341.5Wm-2, involving a long-term planetary albedo equal to 29.6%.

The incident solar radiation has a wider range for the southern hemisphere – this is because the earth is closer to the sun (perihelion) in Dec/Jan, which is the southern hemisphere summer.

And notice the fascinating point that the calculations show the albedo reducing over this period:

The decrease of OSR [outgoing solar radiation] by 2.3Wm-2 over the 14-year period 1984–1997, is very important and needs to be further examined in detail. The decreasing trend in global OSR can be also seen in Fig. 5c, where the mean global planetary albedo, Rp, is found to have decreased by 0.6% from January 1984 through December 1997.

The main cause identified was a decrease in cloudiness in tropical and sub-tropical areas.

Model Comparison

For those interested, some ERBE data vs model:

(click on the image for a larger picture)

Reference

Long-term global distribution of earth’s shortwave radiation budget at the top of atmosphere, N. Hatzianastassiou et al, Atmos. Chem. Phys. Discuss (2004)

Read Full Post »