In the model simulations up until now the pCO2 band has been a constant – a fixed absorption band between the wavenumbers 600-800 cm-1. In this article we will see what happens when the band shape changes, but the “area under the curve” stays the same.
If you are new to the series, take a look at Part Two (and probably a good idea to take a look the subsequent parts to see how the model and the results develop). pH2O and pCO2 are not the real molecules, but have a passing resemblance to them. This allowing us to see changes in top of atmosphere (TOA) flux and DLR (back radiation) as they take on different characteristics, and as the concentration of pCO2 is changed.
In Part Four we saw the effects of the pH2O band overlapping the pCO2 band. The models results in this article keep the same concept, but have widened the pH2O absorption slightly (extended to a lower wavenumber = higher wavelength).
The absorption characteristics for the four model runs:
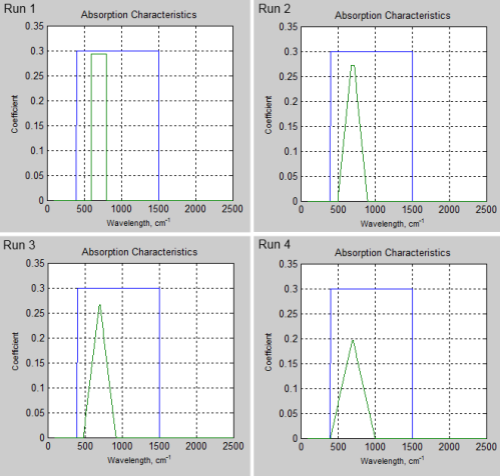
Figure 1 – Blue is pH2O absorption, Green is pCO2 absorption
What happens is that the total band absorptance (the area under the curve) is the same for each run. The pCO2 absorption profile in Run 1 is the same as in all the previous articles in the series. Then in subsequent runs the edges of the band are widened, the “top” is made thinner, and the peak value is adjusted to keep the “total band absorptance” the same.
The code in the notes is specifically for Run 4. The code has to slightly change for each run, as I am changing the shape of the band in each run.
Each model run simulates 20 different pCO2 concentrations. The TOA spectrum for a few results is shown, along with temperature profile, absorption characteristics and the summary of TOA flux vs pCO2 concentration.
The stratospheric temperature is fixed at 215K – to understand why I’ve chosen to fix it, see the discussion in Part Five.
Run 1:

Figure 2 – Click on the image for a larger view
Run 2:

Figure 3 – Click on the image for a larger view
Run 3:

Figure 4 – Click on the image for a larger view
Run 4:

Figure 5 – Click on the image for a larger view
Now let’s compare the summary results from each of the four models:
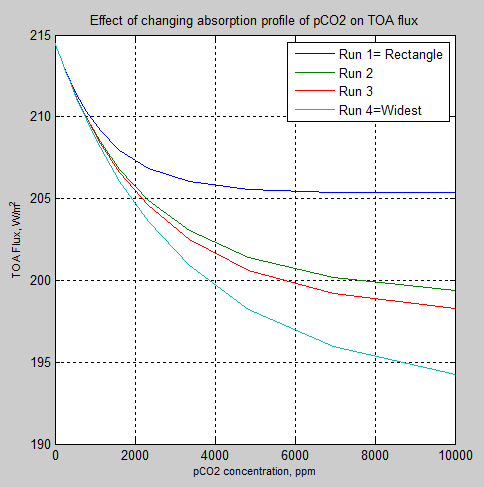
Figure 6 – Changes in TOA flux
And also a reminder that as the TOA flux reduces, the radiative forcing increases – because a reduction in TOA flux means less energy radiated from the planet, and therefore (all other things being equal) a heating effect.
So if we plot the results as radiative forcing instead:

Figure 7 – Radiative Forcing
Effect of Band Shape
The reason for adding this complexity to the model is because real CO2 has an absorption band which is not “rectangular”. The band has a peak absorption around 667 cm-1 (15 μm) which then falls off on either side.
In the results up until now we have seen that different effects contribute to the eventual “saturation” of increasing pCO2 . The particular conditions determine where that saturation takes place.
What these results show is that with a “rectangular” absorption profile the “saturation” takes place much sooner than with a wider band.
Perhaps that is not very surprising to many people.
If it is surprising, then for a conceptual model think about a very strong, very narrow band reaching saturation quite quickly. Whereas if you spread the same absorption over a wider band then each wavelength/wavenumber can contribute more as each wavelength takes longer to reach saturation.
I find it hard to write a good conceptual explanation. Perhaps better to suggest that readers who find the results surprising to reread Part Two to Part Five and review the results from each of the models.
Logarithmic Slopes
I also played around with a logarithmic fall-off instead of a straight line slope. The results were very similar but not identical. I applied the same normalization to the area under the curve as in the previous models.
For example, Run 8, which is similar to Run 4 (similar in that the wavenumbers for the zero points and the “flat top” are identical):
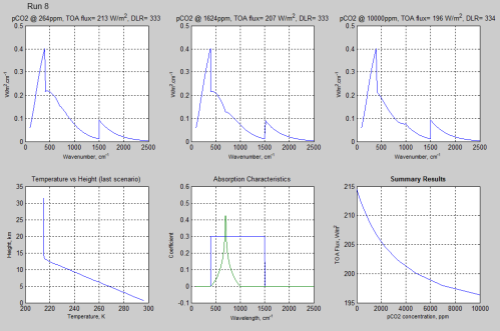
Figure 8 – Click on the image for a larger view
The value of TOA flux at the highest pCO2 concentration of Run 8 was 196.3 W/m², compared with 194.3 W/m² in Run 4.
As less absorption has been “moved out” to the “wings” of the band we would expect that the logarithmic slopes have slightly less effect than the straight line slopes.
Reducing pH2O Effectiveness
I also tried halving the absorption characteristics of pH2O to see the effect. Runs 1-4 were repeated as Runs 9-12 with the only change being the halving of the absorption coefficient of pH2O:

Figure 9
Of course, the total TOA flux is higher in all cases – as pH2O’s effectiveness has been reduced. If you compare the results with Figure 6 you see that curves are quite similar.
Conclusion
Most of the ideas that people have about “saturation” of CO2 are based on a very limited appreciation of how radiative transfer takes place.
The fact that CO2 has very strong absorption in the central part of its band has led to a false conclusion that, therefore, more CO2 can have no further effect.
As we have seen in Part Three, just considering the basic fact of emission totally changes that perspective.
Then we see the effects of emitting from different heights in the atmosphere, and how changing temperature profiles (Part Four) affects that emission.
Another area of confusion is with the idea that because water vapor has absorption across the CO2 band and because water vapor has a much higher concentration than CO2 in the lower troposphere, therefore there is nothing more for CO2 to affect. We saw in Part Four that even making the absorption coefficient of pH2O the same as pCO2 – so that the DLR (back radiation) results were swamped from pH2O – even then the TOA flux was considerably affected by increasing concentrations of pCO2. And in the real world, the real water vapor molecule has considerably less absorption than CO2 around the 15 μm / 667 cm-1 band.
Finally we have seen how a band with a different shape causes quite different results – having a “spreading band” more like the real-world molecules also increases the effect of pCO2 at higher concentrations (less “saturation”).
Well, these are all “model results”
Which means they are the solution to some mathematical equations. If the equations are wrong, then the model is wrong (and if the model writer and his huge team made a mistake in implementation, this model is also wrong).
Yet most of the criticism of “the standard results” in the literature (and as reported by the IPCC) only shows that the critics don’t even know what the equations are.
The usual “explanations” of why the standard results are wrong fall into two categories:
- The writers don’t state and solve the radiative transfer equations (see Part Six), but solve something else entirely. They don’t critique the standard equations, a necessary step to demonstrate the standard theory wrong. Going out on a limb, I would say that they don’t know what the standard theory is.
- The writers create poetic words with no equations, or happily state one particular fact or figure as a breathless QED. For example, the relative concentration of water vapor vs CO2, the fact that 95% of surface radiation is absorbed within y meters by CO2 at wavelength x.
I hope that most people who have read this series have :
- a better understanding of how radiative transfer works
- a vague idea at least of what equations we would expect to see in a successful “critique”
- an appreciation of how complex the real world is and why a 2 minute calculator result is unlikely to provide insight
There may be more to come from this model. I would like to be able to include some real data on CO2 and play around with it. That might be too much work. You never know until you start.
And of course, requests and suggestions of model results you would like to see are welcome, even if no guarantees are made that the requests will be fulfilled.
Other articles:
Part One – a bit of a re-introduction to the subject.
Part Two – introducing a simple model, with molecules pH2O and pCO2 to demonstrate some basic effects in the atmosphere. This part – absorption only.
Part Three – the simple model extended to emission and absorption, showing what a difference an emitting atmosphere makes. Also very easy to see that the “IPCC logarithmic graph” is not at odds with the Beer-Lambert law.
Part Four – the effect of changing lapse rates (atmospheric temperature profile) and of overlapping the pH2O and pCO2 bands. Why surface radiation is not a mirror image of top of atmosphere radiation.
Part Five – a bit of a wrap up so far as well as an explanation of how the stratospheric temperature profile can affect “saturation”
Part Six – The Equations – the equations of radiative transfer including the plane parallel assumption and it’s nothing to do with blackbodies
Part Seven – changing the shape of the pCO2 band to see how it affects “saturation” – the wings of the band pick up the slack, in a manner of speaking
Part Eight – interesting actual absorption values of CO2 in the atmosphere from Grant Petty’s book
Part Nine – calculations of CO2 transmittance vs wavelength in the atmosphere using the 300,000 absorption lines from the HITRAN database
Part Ten – spectral measurements of radiation from the surface looking up, and from 20km up looking down, in a variety of locations, along with explanations of the characteristics
Part Eleven – Heating Rates – the heating and cooling effect of different “greenhouse” gases at different heights in the atmosphere
Part Twelve – The Curve of Growth – how absorptance increases as path length (or mass of molecules in the path) increases, and how much effect is from the “far wings” of the individual CO2 lines compared with the weaker CO2 lines
And Also –
Theory and Experiment – Atmospheric Radiation – real values of total flux and spectra compared with the theory.
Notes
Note 1: Sharp-eyed observers will eventually point out that I didn’t make use of the diffusivity approximation from Part Six in my model.
Note 2: The Matlab code, v0.5.0
RTE v0.5.0
The code is easiest seen by downloading the word doc, but here it is for reference:
======= v0.5.0 ======================
% RTE = Radiative transfer equations in atmosphere
% Objective – allow progressively more complex applications
% to help people see what happens in practice in the atmosphere
% v0.2 allow iterations of one (or more) parameter to find the TOA flux vs
% changed parameter
% v0.3 add emissivity = absorptivity ; as a function of wavelength. Also
% means that downward and upward radiation must be solved, plus iterations
% to allow temperature to change to find stable solution. Use convective
% adjustment to the lapse rate
% v0.3.1 changes the method of defining the atmosphere layers for radiation
% calculations, to have roughly constant mass for each layer
% v0.3.2 tries changing lapse rates and tropopause heights
% v0.3.3 revises element boundaries as various problems found in testing of
% v0.3.2
% v0.4.0 – introducing overlap of absorption bands
% v0.4.1 – warmer stratosphere to show “saturation” of simple bands
% v0.5.0 – introducing some band “shapes” – instead of just “rectangular”
% absorption bands. pH2O band widened to a min of 400cm^-1
clear % empty all the variables, so previous runs can have no effect
disp(‘ ‘);
disp([‘—- New Run —- ‘ datestr(now) ‘ —-‘]);
disp(‘ ‘);
% SI units used unless otherwise stated
% ============= Define standard atmosphere against height ================
% first a “high resolution” atmosphere
% zr = height, pr = pressure, Tr = temperature, rhor = density
Ts=300; % define surface temperature
ps=1.013e5; % define surface pressure
Ttropo=215; % define tropopause temperature
% nmv=2.079e25; % nmv x rho = total number of molecules per m^3, not yet
% used
maxzr=50e3; % height of atmosphere
numzr=5001; % number of points used to define real atmosphere
zr=linspace(0,maxzr,numzr); % height vector from sea level to maxzr
[pr Tr rhor ztropo] = define_atmos_0_3(zr,Ts,ps,Ttropo); % function to determine (or lookup) p, T & rho
% Create “coarser resolution” atmosphere – this reduces computation
% requirements for absorption & emission of radiation
% z, p,Tinit,rho; subset of values used for RTE calcs
numz=30; % number of boundaries to consider (number of layers = numz-1)
minp=1e3; % top of atmosphere to consider in pressure (Pa)
% want to divide the atmosphere into approximately equal pressure changes
dp=(pr(1)-minp)/(numz); % finds the pressure change for each height change
zi=zeros(1,numz); % zi = lookup vector to “select” heights, pressures etc
for i=1:numz % locate each value
zi(i)=find(pr<=(pr(1)-i*dp), 1); % gets the location in the vector where
% pressure is that value
end
% now create the vectors of coarser resolution atmosphere
% z(1) = surface; z(numz) = TOA
% T, p, rho all need to be in the midpoint between the boundaries
% T(1) is the temperature between z(1) and z(2), etc.
z=zr(zi); % height
pb=pr(zi); % pressure at boundaries
Tb=Tr(zi); % starting temperature at boundaries
rhob=rhor(zi); % density at boundaries
% now calculate density, pressure and temperature within each layer
for i=1:numz-1
dz(i)=z(i+1)-z(i); % precalculate thickness of each layer
Tinit(i)=(Tb(i+1)+Tb(i))/2; % temperature in midpoint of boundary
p(i)=(pb(i+1)+pb(i))/2; % pressure in midpoint of boundary
rho(i)=(rhob(i+1)+rhob(i))/2; % density in midpoint of boundary
end
% ============ Set various values =========================
lapse=6.5e-3; % environmental lapse rate in K/m ** note potential conflict with temp profile already determined
% currently = max lapse rate for convective adjustment, but not used to
% define initial temperature profile
ems=0.98; % emissivity of surface
cp=1000; % specific heat capacity of atmosphere, J/K.kg
convadj=true; % === SET TO true === for convective adjustment to lapse rate = lapse
isothermal_strato=true; % ======= SET to true === for fixed and isothermal stratospheric temperature
emission=true; % ==== SET TO true ==== for the atmosphere to emit radiation
tstep=3600*12; % fixed timestep of 1hr
nt=100; % number of timesteps
% work in wavenumber, cm^-1
dv=5;
v=100:dv:2500; % wavenumber (=50um – 4um)
numv=length(v);
rads=ems.*planckmv(v,Ts); % surface emissive spectral power vs wavenumber, v
disp([‘Tstep= ‘ num2str(tstep/3600) ‘ hrs , No of steps= ‘ num2str(nt) ‘, numz= ‘ …
num2str(numz) ‘, minp= ‘ num2str(minp) ‘ Pa, Lapse= ‘ num2str(lapse*1e3) ‘ K/km’]);
% ============== Introducing the molecules ==============================
% need % mixing in the atmosphere vs height, % capture cross section per
% number per frequency, pressure & temperature broadening function
nummol=2; % number of radiatively-active gases
mz=ones(nummol,numz-1); % initialize mixing ratios of the gases
% specific concentrations
% pH2O = pretend H2O
emax=17e-3; % max mixing ratio (surface) of 17g/kg
mz(1,:)=(ztropo-z(1:numz-1)).*emax./ztropo; % straight line reduction from surface to tropopause
mz(1,(mz(1,:)<0))=5e-6; % replace negative values with 5ppm, ie, for heights above tropopause
% pCO2 = pretend CO2
% mz(2,:)=3162e-6; % a fixed mixing ratio for pCO2
% absorption coefficients
k1=0.3; % arbitrary pick – in m2/kg while we use rho
k2=0.3; % likewise
a=zeros(nummol,length(v)); % initialize absorption coefficients
a(1,(v>=400 & v<=1500))=k1; % wavelength dependent absorption
% define some parameters for the pCO2 band to make it easier to adjust
% and then “normalize” this to the original total band absorptance =
% integral(k.dv) which was 0.3 x 200cm-1 = 60
% note that v1-4 need to be multiples of dv
kint=60; % original total
v2=695;v3=705; % peak “flat top” of band
v1=400;v4=1000; % edges where band absorption coefficient falls to zero
% now optical thickness will fall off as a straight line, later we can try
% transmittance = exp(-tau) falling off as a straight line
% find the location within vector v of these points
vi1=find(v>=v1,1);vi2=find(v>=v2,1);vi3=find(v>=v3,1);vi4=find(v>=v4,1);
a(2,(v>=v2 & v<=v3))=k2; % flat top of band
for i=vi1:vi2 % rising edge of band
a(2,i)=(v(i)-v1)/(v2-v1)*k2;
end
for i=vi3:vi4 % falling edge of band
a(2,i)=(v4-v(i))/(v4-v3)*k2;
end
knint=sum(a(2,:))*dv; % this adjusts the whole band absorption to make the
% integral the same as the original
a(2,:)=a(2,:)*kint/knint;
disp([‘v1-4= ‘ num2str(v1) ‘, ‘ num2str(v2) ‘, ‘ num2str(v3) ‘, ‘ num2str(v4) ‘, total abs for pCO2 = ‘ num2str(sum(a(2,:))*dv)]);
% plot(v,a) % to show absorption characteristics if required
% return % if want to early for review of absorption plot
% ========== Scenario loop to change key parameter =======================
% for which we want to see the effect
%
nres=20; % number of results to calculate ******
flux=zeros(1,nres); % TOA flux for each change in parameter
fluxd=zeros(1,nres); % DLR for each change in parameter, not really used yet
par=zeros(1,nres); % parameter we will alter
% this section has to be changed depending on the parameter being changed
% now = pCO2 conc.
par=logspace(-5,-2,nres); % values vary from 10^-5 (10ppm) to 10^-2.5 (3200ppm)
% par=1; % kept for when only one value needed
% ================== Define plots required =======================
% last plot = summary but only if nres>1, ie if more than one scenario
% plot before (or last) = temperature profile, if plottemp=true
% plot before then = surface downward radiation
plottemp=true; % === SET TO true === if plot temperature profile at the end
plotdown=false; % ====SET TO true ==== if downward surface radiation required
plotabs=true; % SET TO true ======= if absorption characteristics required
if nres==1 % if only one scenario
plotix=1; % only one scenario graph to plot
nplot=plottemp+plotdown+plotabs+1; % number of plots depends on what options chosen
else % if more than one scenario, user needs to put values below for graphs to plot
plotix=[round(nres/2) round(nres*3/4) nres]; % graphs to plot – “user” selectable
% plotix=[]; % don’t want to plot any scenarios
nplot=length(plotix)+plottemp+plotdown+plotabs+1; % plot the “plotix” graphs plus the summary
% plus the temperature profile plus downward radiation, if required
end
% work out the location of subplots
if nplot==1
subr=1;subc=1; % 1 row, 1 column
elseif nplot==2
subr=1;subc=2; % 1 row, 2 columns
elseif nplot==3 || nplot==4
subr=2;subc=2; % 2 rows, 2 columns
elseif nplot==5 || nplot==6
subr=2;subc=3; % 2 rows, 3 columns
else
subr=3;subc=3; % 3 rows, 3 columns
end
for n=1:nres % each complete run with a new parameter to try
% — the line below has to change depending on parameter chosen
% to find what the stability problem is we need to store all of the
% values of T, to check the maths when it goes unstable
mz(2,:)=par(n); % this is for CO2 changes
% lapse=par(n); % this is for lapse rate changes each run
disp([‘Run = ‘ num2str(n)]);
T=zeros(nt,numz-1); % define array to store T for each level and time step
T(1,:)=Tinit; % load temperature profile for start of scenario
% remove??? T(:,1)=repmat(Ts,nt,1); % set surface temperature as constant for each time step
% First pre-calculate the transmissivity and absorptivity of each layer
% for each wavenumber. This doesn’t change now that depth of each
% layer, number of each absorber and absorption characteristics are
% fixed.
% n = scenario, i = layer, j = wavenumber, k = absorber
trans=zeros(numz-1,numv); abso=zeros(numz-1,numv); % pre-allocate space
for i=1:numz-1 % each layer
for j=1:numv % each wavenumber interval
trans=1; % initialize the amount of transmission within the wavenumber interval
for k=1:nummol % each absorbing molecule
% for each absorber: exp(-density x mixing ratio x
% absorption coefficient x thickness of layer)
trans=trans*exp(-rho(i)*mz(k,i)*a(k,j)*dz(i)); % calculate transmission, = 1- absorption
end
tran(i,j)=trans; % transmissivity = 0 – 1
abso(i,j)=(1-trans)*emission; % absorptivity = emissivity = 1-transmissivity
% if emission=false, absorptivity=emissivity=0
end
end
% === Main loops to calculate TOA spectrum & flux =====
% now (v3) considering emission as well, have to find temperature stability
% first, we cycle around to confirm equilibrium temperature is reached
% second, we work through each layer
% third, through each wavenumber
% fourth, through each absorbing molecule
% currently calculating surface radiation absorption up to TOA AND
% downward radiation from TOA (at TOA = 0)
for h=2:nt % main iterations to achieve equilibrium
radu=zeros(numz,numv); % initialize upward intensity at each boundary and wavenumber
radd=zeros(numz,numv); % initialize downward intensity at each boundary and wavenumber
radu(1,:)=rads; % upward surface radiation vs wavenumber
radd(end,:)=zeros(1,numv); % downward radiation at TOA vs wavenumber
% units of radu, radd are W/m^2.cm^-1, i.e., flux per wavenumber
% h = timestep, i = layer, j = wavenumber
% Upward (have to do upward, then downward)
Eabs=zeros(numz-1); % zero the absorbed energy before we start
for i=1:numz-1 % each layer
for j=1:numv % each wavenumber interval
% first calculate how much of each monochromatic ray is
% transmitted to the next layer
radu(i+1,j)=radu(i,j)*tran(i,j);
% second, add emission at this wavelength:
% planck function at T(i) x emissivity (=absorptivity)
% this function is spectral emissive power (pi x intensity)
radu(i+1,j)=radu(i+1,j)+abso(i,j)*3.7418e-8.*v(j)^3/(exp(v(j)*1.4388/T(h-1,i))-1);
% Change in energy = dI(v) * dv (per second)
% accumulate through each wavenumber
% if the upwards radiation entering the layer is more than
% the upwards radiation leaving the layer, then a heating
Eabs(i)=Eabs(i)+(radu(i,j)-radu(i+1,j))*dv;
end % each wavenumber interval
end % each layer
% Downwards (have to do upward, then downward)
for i=numz-1:-1:1 % each layer from the top down
for j=1:numv % each wavenumber interval
% first, calculate how much of each monochromatic ray is
% transmitted to the next layer, note that the TOA value
% is set to zero at the start
radd(i,j)=radd(i+1,j)*tran(i,j); % attentuation..
% second, calculate how much is emitted at this wavelength,
radd(i,j)=radd(i,j)+abso(i,j)*3.7418e-8.*v(j)^3/(exp(v(j)*1.4388/T(h-1,i))-1); % addition..
% accumulate energy change per second
Eabs(i)=Eabs(i)+(radd(i+1,j)-radd(i,j))*dv;
end % each wavenumber interval
dT=Eabs(i)*tstep/(cp*rho(i)*dz(i)); % change in temperature = dQ/heat capacity
if isothermal_strato && z(i)>=ztropo % if we want to keep stratosphere at fixed temperature
T(h,i)=T(h-1,i);
else
T(h,i)=T(h-1,i)+dT; % calculate new temperature
if T(h,i)>500 % Finite Element analysis problem
disp([‘Terminated at n= ‘ num2str(n) ‘, h= ‘ num2str(h) ‘, z(i)= ‘ num2str(z(i)) ‘, i = ‘ num2str(i)]);
disp([‘time = ‘ num2str(h*tstep/3600) ‘ hrs; = ‘ num2str(h*tstep/3600/24) ‘ days’]);
disp(datestr(now));
return
end
end
% need a step to see how close to an equilibrium we are getting
% not yet implemented
end % each layer
% now need convective adjustment
if convadj==true % if convective adjustment chosen..
for i=2:numz-1 % go through each layer
if (T(h,i-1)-T(h,i))/dz(i)>lapse % too cold, convection will readjust
T(h,i)=T(h,i-1)-(dz(i)*lapse); % adjust temperature
end
end
end
end % iterations to find equilibrium temperature
flux(n)=sum(radu(end,:))*dv; % calculate the TOA flux
fluxd(n)=sum(radd(1,:))*dv; % calculate the DLR total
% === Plotting specific results =======
% Decide if and where to plot
ploc=find(plotix==n); % is this one of the results we want to plot?
if not(isempty(ploc)) % then plot. “Ploc” is the location within all the plots
subplot(subr,subc,ploc),plot(v,radu(end,:)) % plot wavenumber against TOA emissive power
xlabel(‘Wavenumber, cm^-^1′,’FontSize’,8)
ylabel(‘W/m^2.cm^-^1′,’FontSize’,8)
title([‘pCO2 @ ‘ num2str(round(par(n)*1e6)) ‘ppm, TOA flux= ‘ num2str(round(flux(n)))…
‘ W/m^2, DLR= ‘ num2str(round(fluxd(n)))])
% —
%subplot(subr,subc,ploc),plot(T(end,:),z(2:numz)/1000)
%title([‘Lapse Rate ‘ num2str(par(n)*1000) ‘ K/km, Total TOA flux= ‘ num2str(round(flux(n))) ‘ W/m^2’])
%xlabel(‘Temperature, K’,’FontSize’,8)
%ylabel(‘Height, km’,’FontSize’,8)
grid on
end
end % end of each run with changed parameter to see TOA effect
if plotdown==true % plot downward surface radiation, if requested
plotloc=nplot-plottemp-plotabs-(nres>1); % get subplot location
subplot(subr,subc,plotloc),plot(v,radd(2,:)) % plot wavenumber against downward emissive power
title([‘Surface Downward, W/m^2.cm^-^1, Total DLR flux= ‘ num2str(round(fluxd(n))) ‘ W/m^2’])
xlabel(‘Wavenumber, cm^-^1′,’FontSize’,8)
ylabel(‘W/m^2.cm^-^1′,’FontSize’,8)
grid on
end
if plottemp==true % plot temperature profile vs height, if requested
plotloc=nplot-plotabs-(nres>1); % get subplot location
subplot(subr,subc,plotloc),plot(T(end,:),z(2:numz)/1000)
title(‘Temperature vs Height (last scenario)’)
xlabel(‘Temperature, K’,’FontSize’,8)
ylabel(‘Height, km’,’FontSize’,8)
grid on
end
if plotabs==true % plot show absorption characteristics if required
plotloc=nplot-(nres>1); % get subplot location
subplot(subr,subc,plotloc),plot(v,a) %
title(‘Absorption Characteristics’)
xlabel(‘Wavelength, cm^-^1′,’FontSize’,8)
ylabel(‘Coefficient’,’FontSize’,8)
grid on
end
if nres>1 % produce summary plot – TOA flux vs changed parameter
subplot(subr,subc,nplot),plot(par*1e6,flux)
title(‘Summary Results’,’FontWeight’,’Bold’)
ylabel(‘TOA Flux, W/m^2′,’FontSize’,8)
xlabel(‘pCO2 concentration, ppm’,’FontSize’,8) % ==== change label for different scenarios =========
grid on
end
disp([‘—- Complete End —- ‘ datestr(now) ‘ —-‘]);
Read Full Post »






Find Stuff Out and Book Reviews
Posted in Basic Science, Commentary on February 26, 2011| 200 Comments »
Reading one good text book on climate science can save 100’s of hours of reading rubbish on the internet. And there is a lot (of rubbish). Well-meaning people without the baggage of any knowledge of the subject writing rubbish, then repeated by other well-meaning people.
Text books cost money. But depending on which country you live in and whether you have an income, the “payback” means that not buying it is like working for $1/hr. That assumes reading rubbish isn’t a hobby for you..
And depending on where you live you can often join a university library as an “outsider” for anything ranging from $100/year up – and borrow as many books as you like.
Learning can be like a drug. In which case, other justifications aren’t necessary, you have to feed the habit regardless. So pawn family jewelery, sell your furniture, etc. Well, as an addict you already know the drill..
Just some ideas.
Global Physical Climatology – by Dennis Hartmann
Academic Press (1994)
Amazon for $88 (reduced from $118, the price at the normally amazing bookdepository.co.uk).
Why am I recommending such an old book? This covers the basics very thoroughly. When someone covers a lot of subjects there is inevitably a compromise. To cover each of the subjects “properly” would be 4,000 pages or 40,000 pages – not 400 pages. What I like about Hartmann:
a) very readable
b) very thorough
c) enough detail to feel like you understand the basics without drowning in maths or detail.
Maths is the language of science, and inevitably there is some maths. But without any maths you can still learn a lot.
Now, a few samples..
From Chapter 4:
From chapter 11:
As you can see, there is some maths, but if you are maths averse you can mostly “punch through” and still get 80% instead of the full 100%.
Elementary Climate Physics by Prof. F.W. Taylor
Oxford University Press (2005)
bookdepository.co.uk for $44 with FREE shipping lots of places in the world, unbelievable but true.
Amazon has it for $60 plus shipping.
This is an excellent book with more radiative physics than Hartmann, but also more maths generally. For example, in the derivation of the lapse rate there is some assumed knowledge. That’s par for the course with textbooks. They are written with an audience in mind. The audience in mind here is people who already have a decent knowledge of physics, but not of climate.
However, even with a tenuous grasp of physics you will get a lot out of this book. Here’s the downside though – quite some maths:
Well, he is teaching physics.
A First Course in Atmospheric Radiation – Grant Petty
Sundog Publishing 2006
Amazon from $48
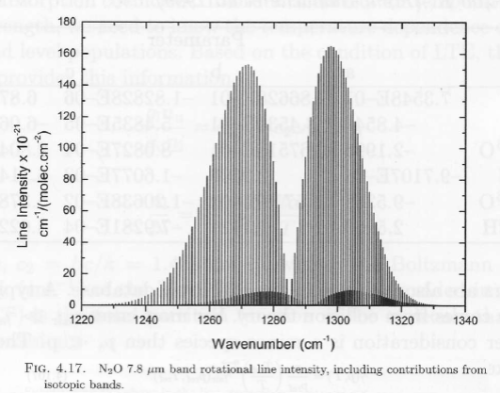
Thanks to DeWitt Payne for recommending this book, which is excellent. This is the best place to start understanding radiation in the atmosphere. Goody & Yung 1989 is comprehensive and detailed – but not the right starting point.
Radiative physics is no walk in the park. There is no way to make it astoundingly simple. But Petty does a great job of making it five times easier than it should be:
Now onto “not climate science”:
An Introduction to Thermal Physics – Daniel Schroeder
Published by different companies in different countries.
Amazon from $45 plus shipping and Bookdepository for $56 free shipping.
A book that is nothing to do with climate science, but quite brilliant in explaining very hard stuff – heat and statistical thermodynamics – so it sounds really easy. Not many people can explain hard subjects so they sound easy. Most textbooks writers make slightly difficult stuff sound incomprehensible until after you understand it – at which point you don’t need the textbook.
It wasn’t until I read this book that I realized that Statistical Thermodynamics was actually interesting and useful.
The Inerrancy of Textbooks?
Are textbooks without error and without flaw?
So what’s the point then?
The people who write textbooks usually have 20+ years of study in that field behind them. And until such time as E&E start a line of textbooks, the publishers of textbooks, with their own reputation to protect, only ask people who have a solid background in that field to write a textbook.
So even if you are intent on demonstrating that climate science has no idea about basic physics – how are you going to do this?
You could follow the path of many other brave bloggers and commenters who write about the “paltry understanding” of climate science without actually knowing anything about climate science.
But if you choose to do it the old-fashioned way then you should at least find out what climate science says.
Read Full Post »