Feeds:
Posts
Comments

Archive for September, 2010

Many people often claim that the atmosphere cannot “heat” the earth’s surface and therefore the idea of the inappropriately-named “greenhouse” effect is scientifically impossible. The famous Second Law of Thermodynamics is invoked in support.

Let’s avoid a semantic argument about the correct or incorrect use of the word “heat”.

I claim that energy from the atmosphere is absorbed by the surface.

This absorbed energy has no magic properties. If the surface loses 100J of energy by other means and gains 100J of energy from the atmosphere then its temperature will stay constant. If the surface hasn’t lost or gained any energy by any other means, this 100J of energy from the atmosphere will increase the surface temperature.

I also claim that because the atmosphere is on average colder than the surface, more energy is transferred from the surface to the atmosphere compared with the reverse situation.

Let’s consider whether this violates the real second law of thermodynamics..

The Conceptual Problem

In Heat Transfer Basics – Part Zero a slightly off-topic discussion about the “greenhouse” effect began. One of our most valiant defenders of the imaginary second law of thermodynamics said:

An irradiated object can never reach a higher temperature than the source causing the radiation

I have demonstrated previously in The First Law of Thermodynamics Meets the Imaginary Second Law that a colder body can increase the temperature of a hotter body (compared with the scenario when the colder body was not there).

In that example, there was more than one source of energy. So, with this recent exchange in Heat Transfer Basics it dawned on me what the conceptual problem was. So this article is written for the many people who find themselves agreeing with the comment above. As a paraphrased restatement by the same commenter:

If the atmosphere is at -30°C then it can’t have any effect on the surface if the surface is above -30°C

Entropy Basics and The Special Case

Entropy is a difficult subject to understand. Heat and temperature are concepts we can understand quite easily. We all know what temperature is (in a non-precise way) and heat, although a little more abstract, is something most people can relate to.

Entropy appears to be an abstract concept with no real meaning – nothing you can get your hands around.

The second law of thermodynamics says:

Entropy of a “closed system” can never reduce

Before defining entropy, here is an important consequence of this second law:

Increasing entropy means that heat flows spontaneously from hotter to colder bodies and never in reverse

This fits everyone’s common experience.

  • Ice melts in a glass of water
  • A hot pan of water on the stove cools down to room temperature when the heat source is removed
  • Put a hold and cold body together and they tend to come to the same temperature, not move apart in temperature

And all of these are easier to visualize than a mathematical formula.

What is entropy?  I will keep the maths to an absolute minimum, but we have to introduce a tiny amount of maths just to define entropy.

For a body absorbing a tiny amount of heat, δQ (note that δ is a symbol which means “tiny change”), the change in entropy, δS, is given by:

δS = δQ / T, where T is absolute temperature (see note 1)

It’s not easy to visualize – but take a look at a simple example. Suppose that a tiny amount of heat, 1000 J, moves from a body at 1000K to a body at 500K:

Example 1

The net change in energy in the system is zero because 1000J leaves the first body and is absorbed by the second body. This is the first law of thermodynamics – energy cannot be created or destroyed.

However, there is a change in entropy.

The change in total entropy of the system = δS1 + δS2 = -1 + 2 = 1 J/K.

This strange value called “entropy” has increased.

Notice that if the energy flow of 1000J was from the 500K body to the 1000K body the change in entropy would be -1 J/K. This would be a reduction in entropy – forbidden by the real second law of thermodynamics. This would be a spontaneous flow of heat from the colder body to the hotter body.

Updated note Sep 30th – this example is intended to clarify the absolute basics.

Think of the example above like this – If, for some reason, in a closed system, this was the only movement of energy taking place, we could calculate the entropy change and it has increased.

The example is not meant to be an example of only one half of a radiative energy exchange. Just a very very simply example to show how entropy is calculated. It could be conductive heat transfer through a liquid that is totally opaque to radiation.

The Special Case

The simplest example demonstrating the second law of thermodynamics is with two bodies which are in a closed system.

Let’s say that we have a gas at 273K (Body 1) and a solid (Body 2) surrounded by the gas. The solid starts off much colder.

What is the maximum temperature that can be reached by the solid?

273K

Easy. In fact, depending on the starting temperature of the solid and the respective heat capacities of the gas and solid, the actual temperature that both end up (the same temperature eventually) might be a little lower or a lot lower.

But the temperature reached by the solid can never get to more than 273K. For the solid to get to a temperature higher than 273K the gas would have to cool down below 273K (otherwise energy would have been created). Heat does not spontaneously flow from a colder to a hotter body so this never happens.

This defining example is illuminating but no surprise to anyone.

It is important to note that this special case is not the second law of thermodynamics, it is an example that conforms to the second law of thermodynamics.

The second law of thermodynamics says that the entropy of a system cannot reduce. If we want to find out whether the second law of thermodynamics forbids some situation then we need to calculate the change in entropy – not use “insight” from this super-simple scenario.

So let’s consider some simple examples and see what happens to the entropy.

Simple Examples

What I want to demonstrate is that the standard picture in heat transfer textbooks doesn’t violate the second law of thermodynamics.

What is the standard picture?


From "Fundamentals of Heat and Mass Transfer, 6th edition", Incropera and DeWitt (2007)

From "Fundamentals of Heat and Mass Transfer, 6th edition", Incropera and DeWitt (2007)


This says that two bodies separated in space both emit radiation. And both absorb radiation from the other body (see note 2).

The challenging concept for some is the idea that radiation from the colder body is absorbed by the hotter body.

We start with Example 1 above, but this time we consider an exchange of radiation and see what happens to the entropy of that system.

Example 2

What I have introduced here is thermal radiation from Body 2 incident on Body 1. We will assume all of it is absorbed, and vice-versa.

According to the Stefan-Boltzmann equation, energy radiated is proportional to the 4th power of temperature. Given that Body 2 is half the temperature of Body 1 it will radiate at a factor of 24 = 2 x 2 x 2 x 2 = 16 times less. Therefore, if 1000J from Body 1 reaches Body 2, then 62J (1000/16) will be transmitted in the reverse direction. However, the exact value doesn’t matter for the purposes of this example.

So with our example above, what is the change in entropy?

Body 1 loses energy, which is negative entropy. Body 2 gains energy, which is positive entropy.

δS1 = -(1000-62)/1000 = -938 / 1000 = -0.94 J/k
δS2 =(1000-62)/500 = 938 / 500 = 1.88 J/K

Total entropy change = -0.94 + 1.88 = 0.94 J/K.

So even though energy from the colder body has been absorbed by the hotter body, the entropy of the system has increased. This is because more energy has moved in the opposite direction.

There is no violation of the second law of thermodynamics with this example.

Now let’s consider an example with values closer to what we encounter near the earth’s surface:

Example 3

This isn’t intended to be the complete surface – atmosphere system, just values that are more familiar.

Surface:        δS1 = -(390-301)/288 = -89 / 288 = -0.31 J/k
Atmosphere: δS2 = (390-301)/270 = 89 / 270 = 0.33 J/K

Total entropy change = -0.31 + 0.33 = 0.02 J/K.

So even though the temperatures of the two bodies are much closer together, when they exchange energy, total entropy still increases.

Energy from the colder atmosphere has been absorbed by the hotter surface and yet entropy of the system has still increased.

Now, the example above (example 3) is an exchange of a fixed amount of energy (in Joules, J). Suppose this is the amount of energy per second (Watts, W) or the amount of energy per second per square meter (W/m²).

If the atmosphere keeps absorbing more energy than it is emitting it will heat up. If the earth keeps emitting more energy than it absorbs, it will cool down.

If example 3 was the complete system, then the atmosphere would heat up and the earth would cool down until they were in thermal equilibrium. This doesn’t happen because the sun continually provides energy.

The Complete Climate System

The earth-atmosphere system is very complex. If we analyze a long term average scenario, like that painted by Kiehl and Trenberth there is an immediate problem in calculating the change in entropy:


From Kiehl & Trenberth (1997)

From Kiehl & Trenberth (1997)


[Note from Sep 28th – This section is wrong, thanks Nick Stokes for highlighting it and so delicately! Preserved in italics for entertainment value only..] If we consider the surface, for example, it absorbs 492 W/m² (δQ = 492 per second per square meter) and it loses 492 W/m² (δQ = -492 per second per square meter).

Net energy change = 0. Net entropy change = 0.

Why isn’t entropy increasing? We haven’t considered the whole system – the sun is generating all the energy to power the climate system. If we do consider the sun, it is emitting a huge amount of energy and, therefore, losing entropy. But the energy generation inside the sun creates more entropy – that is, unless the second law of thermodynamics is flawed.

[Now the rewritten bit]

Previous sections explained that calculations of entropy “removed” (negative entropy) are based on energy emitted divided by the temperature of the source. And calculations of entropy “produced” are based on energy absorbed divided by the temperature of the absorber. In a closed system we can add these up and we find that entropy always increases.

So the calculation in italics above is incorrect. Change in entropy at the surface is not zero.

Change in entropy at the surface is a large negative value, because we have to consider the source temperature of the energy.

So as Nick Stokes points out (in a comment below), we can draw a line around the whole climate system, including the emission of radiation by the sun (see example 4 just below). This calculation produces a large negative entropy, because it isn’t a closed system. This is explained by the fact that the production of solar energy creates an even larger amount of positive entropy.

Example 4

The Classic Energy Exchange by Radiation

I was in the university library recently and opened up a number of heat transfer textbooks. All of them had a similar picture to that from Incropera and DeWitt (above). And not a single one said, This doesn’t happen.

In any case, for someone to claim that an energy exchange violates the second law of thermodynamics they need to show there is a reduction in entropy of a closed system.

But one important point did occur to me when thinking about this subject. Let’s reconsider our commenter’s claim:

An irradiated object can never reach a higher temperature than the source causing the radiation

As I pointed out in the The Special Case section – this is true if this is the only source of energy. Yet the surface of the earth receives energy from both the sun and the atmosphere.

If the colder atmosphere cannot transfer energy to a warmer surface, and the second law of thermodynamics is the reason, the actual event that is forbidden is the emission of radiation by the colder atmosphere. When the colder atmosphere radiates energy it loses entropy.

After all, the entropy loss takes place when the atmosphere has given up its energy. Not when another body has absorbed the energy.

Our commenter has frequently agreed that the colder atmosphere does radiate. But he doesn’t believe that the surface can absorb it. He has never been able to explain what happens to the energy when it “reaches” the surface. Or why the surface doesn’t absorb it. Instead we have followed many enjoyable detours into attempts to undermine any of a number of fundamental physics laws in an attempt to defend “the imaginary second law of thermodynamics”.

Conclusion

Entropy is a conceptually difficult subject, but all of us can see the example in “the special case” and agree that the picture is correct.

However, the atmosphere – surface interaction is more complex than that simple case. The surface of the earth receives energy from the sun and the atmosphere.

As we have seen, in simple examples of radiant heat exchange between two bodies, entropy is still positive even when the hotter body absorbs energy from the colder body. This is because more energy flows from the hotter to the colder than the reverse.

To prove that the second law of thermodynamics has been violated someone needs to demonstrate that a system is reducing entropy. So we would expect to see an entropy calculation.

Turgid undergraduate books about heat transfer in university libraries all write that radiation emitted by a colder body is absorbed by a hotter body.

That is because the first law of thermodynamics is still true – energy cannot be created, destroyed, or magically lost.

Other Relevant Articles

The Amazing Case of “Back Radiation” – Part Three

The First Law of Thermodynamics Meets the Imaginary Second Law

Intelligent Materials and the Imaginary Second Law of Thermodynamics

Amazing Things we Find in Textbooks – The Real Second Law of Thermodynamics

Notes

Note 1 – There are more fundamental ways to define entropy, but it won’t help to see this kind of detail. And for the purists, the equation as shown relies on the temperature not changing as a result of the small transfer of energy.

If the temperature did change then the correct formula is to integrate:

ΔS = ∫Cp/T. dT (with the integral from T1 to T2) and the result,

ΔS = Cp log (T2/T1),   this is log to the base e.

Note 2 – This assumes there is some “view factor” between the two bodies – that is, some portion of the radiation emitted by one body can “hit” the other. Just pointing out the obvious, just in case..
Read Full Post »

In Part One we had a look at Ramanathan’s work (actually Raval and Ramanathan) attempting to measure the changes in outgoing longwave radiation vs surface temperature.

In Part Two (Part Zero perhaps) we looked at some basics on water vapor as well as some measurements. The subject of the non-linear effects of water vapor was raised.

Part One Responses attempted a fuller answer to various questions and objections about Part One

Water vapor feedback isn’t a simple subject.

First, a little more background.

Effectiveness of Water Vapor at Different Heights

Here are some model results of change in surface temperature for changes in specific humidity at different heights:

From Shine & Sinha (1991)

From Shine & Sinha (1991)

For newcomers, 200mbar is the top of the troposphere (lower atmosphere), and 1000mbar is the surface.

You can see that for a given increase in the mixing ratio of water vapor the most significant effect comes at the top of the troposphere.

The three temperatures: cool = 277K (4°C); average = 287K (14°C); and warm = 298K (23°C).

Now a similar calculation using changes in relative humidity:

From Shine & Sinha (1991)

From Shine & Sinha (1991)

The average no continuum shows the effect without the continuum absorption portion of the water vapor absorption. This is the frequency range between 800-1200 cm-1, (wavelength range 12-8μm) – often known as the “atmospheric window”. This portion of the spectral range is important in studies of increasing water vapor, something we will return to in later articles.

Here we can see that in warmer climates the lower troposphere has more effect for changes in relative humidity. And for average and cooler climates, changes in relative humidity are still more important in the lower troposphere, but the upper troposphere does become more significant.

(This paper, by Shine & Sinha, appears to have been inspired by Lindzen’s 1990 paper where he talked about the importance of upper tropospheric water vapor among other subjects).

So clearly the total water vapor in a vertical section through the atmosphere isn’t going to tell us enough (see note 1). We also need to know the vertical distribution of water vapor.

Here is a slightly different perspective from Spencer and Braswell (1997):

Spencer and Braswell (1997)

Spencer and Braswell (1997)

This paper took a slightly different approach.

  • Shine & Sinha looked at a 10% change in relative humidity – so for example, from 20% to 22% (20% x 110%)
  • Spencer & Braswell said, let’s take a 10% change as 20% to 30% (20% + 10%)

This isn’t an argument about how to evaluate the effect of water vapor – just how to illustrate a point. Spencer & Braswell are highlighting the solid line in the right hand graph, and showing Shine & Sinha’s approach as the dashed line.

In the end, both will get the same result if the water vapor changes from 20% to 30% (for example).

Boundary Layers and Deep Convection

Here’s a conceptual schematic from Sun and Lindzen 1993:

The bottom layer is the boundary layer. Over the ocean the source of water vapor in this boundary layer is the ocean itself. Therefore, we would assume that the relative humidity would be high and the specific humidity (the amount of water vapor) would be strongly dependent on temperature (see Part Two).

Higher temperatures drive stronger convection which creates high cloud levels. This is often called “deep convection” in the literature. These convective towers are generally only a small percentage of the surface area. So over most of the tropics, air is subsiding.

Here is a handy visualization from Held & Soden (2000):

Held and Soden (2000)

Held and Soden (2000)

The concept to be clear about is within the well-mixed boundary layer there is a strong connection between the surface temperature and the water vapor content. But above the boundary layer there is a disconnect. Why?

Because most of the air (by area) is subsiding (see note 2). This air has at one stage been convected high up in the atmosphere, has dried out and now is returning back to the surface.

Subsiding air in some parts of the tropics is extremely dry with a very low relative humidity. Remember the graphs in Part Two – air high up in the atmosphere can only hold 1/1,000th of the water vapor that can be held close to the surface. So air which is saturated when it is at the tropopause is – in relative terms – very dry when it returns to the surface.

Therefore, the theoretical connection between surface temperature and specific humidity becomes a challenging one above the boundary layer.

And the idea that relative humidity is conserved is also challenged.

Relationship between Specific Humidity and Local Temperature

Sun and Oort (1995) analyzed the humidity and temperature in the tropics (30°S to 30°N) at a number of heights over a long time period:

Sun and Oort (1995)

Sun and Oort (1995)

Note that the four graphs represent four different heights (pressures) in the atmosphere. And note as well that the temperatures plotted are the temperatures at that relevant height.

Their approach was to average the complete tropical domain (but not the complete globe) and, therefore, average out the ascending and descending portions of the atmosphere:

Through horizontal averaging, variations of water vapor and temperature that are related to the horizontal transport by the large-scale circulation will be largely removed, and thus the water vapor and temperature relationship obtained is more indicative of the property of moist convection, and is thus more relevant to the issue of water vapor feedback in global warming.

In analyzing the results, they said:

Overall, the variations of specific humidity correlate positively at all levels with the temperature variations at the same level. However, the strength of the correlation between specific humidity variations and the temperature variations at the same level appears to be strongly height dependent.

Sun & Oort (1995)

Sun & Oort (1995)

Early in the paper they explained that pre-1973 values of water vapor were more problematic than post-1973 and therefore much of the analysis would be presented with and without the earlier period. Hence, the two plots in the graph above.

Now they do something even more interesting and plot the results of changes in specific humidity (q) with temperature and compare with the curve for constant relative humidity:

Sun & Oort (1995)

Sun & Oort (1995)

The dashed line to the right is the curve of constant relative humidity. (For those still trying to keep up, if specific humidity was constant, the measured values would be a straight vertical line going through the zero).

The largest changes of water vapor with temperature occur in the boundary layer and the upper troposphere.

They note:

The water vapor in the region right above the tropical convective boundary layer has the weakest dependence on the local temperature.

And also that the results are consistent with the conceptual picture put forward by Sun and Lindzen (1993). Well, it is the same De-Zheng Sun..

Vertical Structure of Water Vapor Variations

How well can we correlate what happens at the surface with what happens in the “free troposphere” (the atmosphere above the boundary layer)?

If we want to understand temperature vertically through the atmosphere it correlates very well with the surface temperature. Probably not a surprise to anyone.

If we want to understand variations of specific humidity in the upper troposphere, we find (Sun & Oort find) that it doesn’t correlate very well with specific humidity in the boundary layer.

Sun & Oort (1995)

Sun & Oort (1995)

Take a look at (b) – this is the correlation of local temperature at any height with the surface temperature below. There is a strong correlation and no surprise.

Then look at (a) – this is the correlation of specific humidity at any height with the surface specific humidity. We can see that the correlation reduces the higher up we go.

This demonstrates that the vertical movement of water vapor is not an easy subject to understand.

Sun and Oort also comment on Raval and Ramanathan (1989), the source of the bulk of Clouds and Water Vapor – Part One:

Raval and Ramanathan (1989) were probably the first to use observational data to determine the nature of water vapor feedback in global warming. They examined the relationship between sea surface temperature and the infrared flux at the top of the atmosphere for clear sky conditions. They derived the relationship from the geographical variations..

However, whether the tropospheric water vapor content at all levels is positively correlated with the sea surface temperature is not clear. More importantly, the air must be subsiding in clear-sky regions. When there is a large-scale subsidence, the influence from the sea is restricted to a shallow boundary layer and the free tropospheric water vapor content and temperature are physically decoupled from the sea surface temperature underneath.

Thus, it may be questionable to attribute the relationships obtained in such a way to the properties of moist convection.

Conclusion

The subject of water vapor feedback is not a simple one.

In their analysis of long-term data, Sun and Oort found that water vapor variations with temperature in the tropical domain did not match constant relative humidity.

They also, like most papers, caution drawing too much from their results. They note problems in radiosonde data, and also that statistical relationships observed from inter-annual variability may not be the same as those due to global warming from increased “greenhouse” gases.

Articles in this Series

Part One – introducing some ideas from Ramanathan from ERBE 1985 – 1989 results

Part One – Responses – answering some questions about Part One

Part Two – some introductory ideas about water vapor including measurements

Part Four – discussion and results of a paper by Dessler et al using the latest AIRS and CERES data to calculate current atmospheric and water vapor feedback vs height and surface temperature

Part Five – Back of the envelope calcs from Pierrehumbert – focusing on a 1995 paper by Pierrehumbert to show some basics about circulation within the tropics and how the drier subsiding regions of the circulation contribute to cooling the tropics

Part Six – Nonlinearity and Dry Atmospheres – demonstrating that different distributions of water vapor yet with the same mean can result in different radiation to space, and how this is important for drier regions like the sub-tropics

Part Seven – Upper Tropospheric Models & Measurement – recent measurements from AIRS showing upper tropospheric water vapor increases with surface temperature

References

How Dry is the Tropical Free Troposphere? Implications for Global Warming Theory,
Spencer & Braswell, Bulletin of the American Meteorological Society (1997)

Humidity-Temperature Relationships in the Tropical Troposphere, Sun & Oort, Journal of Climate (1995)

Distribution of Tropical Tropospheric Water Vapor, Sun & Lindzen, Journal of Atmospheric Sciences (1993)

Sensitivity of the Earth’s Climate to height-dependent changes in the water vapor mixing ratio, Shine & Sinha, Nature (1991)

Some Coolness concerning Global Warming, Lindzen,Bulletin of the American Meteorological Society (1990)

Notes

Note 1 – The total amount of water vapor, TPW ( total precipitable water), is obviously something we want to know, but we don’t have enough information if we don’t know the distribution of this water vapor with height. It’s a shame, because TPW is the easiest value to measure via satellite.

Note 2 – Obviously the total mass of air is conserved. If small areas have rapidly rising air, larger areas will have have slower subsiding air.

Read Full Post »

Someone on another blog reminded me about this paper – Cooling of Atmosphere due to CO2 Emission, by Chilingar, Khilyuk and Sorokhtin (2008).

It’s clearly impressed many people, but it’s not a good paper. It’s main strength is misdirection.

Traditional anthropogenic theory of currently observed global warming states that release of carbon dioxide into atmosphere (partially as a result of utilization of fossil fuels) leads to an increase in atmospheric temperature because the molecules of CO2 (and other greenhouse gases) absorb the infrared radiation from the Earth’s surface. This statement is based on the Arrhenius hypothesis, which was never verified (Arrhenius, 1896).

The proponents of this theory take into consideration only one component of heat transfer in atmosphere, i.e., radiation. Yet, in the dense Earth’s troposphere with the pressure pa > 0:2 atm, the heat from the Earth’s surface is mostly transferred by convection (Sorokhtin, 2001a). According to our estimates, convection accounts for 67%, water vapor condensation in troposphere accounts for 25%, and radiation accounts for about 8% of the total heat transfer from the Earth’s surface to troposphere. Thus, convection is the dominant process of heat transfer in troposphere, and all the theories of Earth’s atmospheric heating (or cooling) first of all must consider this process of heat (energy)– mass redistribution in atmosphere..

Emphasis added.

The highlighted statement from the 2nd paragraph is false. Open any atmospheric physics textbook and you will find a treatment of convection.

Here are the first two pages of contents from The Physics of Atmospheres, by John Houghton, 2nd ed, 1986, Cambridge University Press:

Here are the contents from Atmospheres, by Richard Goody (1972), Prentice-Hall Inc:

Here is the first part of the contents from Elementary Climate Physics, by Prof. F.W. Taylor (2005), Oxford University Press:

If readers would like citations and extracts from many papers to demonstrate the point further, just ask.

So the writers of this “paper” conclude:

Thus, convection is the dominant process of heat transfer in troposphere, and all the theories of Earth’s atmospheric heating (or cooling) first of all must consider this process of heat (energy)– mass redistribution in atmosphere

The dominant theories of atmospheric heating and cooling do consider this. If the paper provided some evidence that this is “not considered” we could address the evidence but instead they just go on to claim:

This physical system (multiple cells of air convection) acts in the Earth’s troposphere like a continuous surface cooler. The cooling effect by air convection can surpass considerably the warming effect of radiation.

For the easily impressed this might seem like something noteworthy. And yet this is the staple of every textbook and every paper reviewing the effect of the inappropriately-named “greenhouse” effect.

For example, Lindzen (1990):

It is worth noting that, in the absence of convection, pure greenhouse warming would lead to a globally averaged surface temperature of 72°C given current conditions. Our current average temperature, 15°C, is actually much closer to the blackbody temperature without any greenhouse warming than to the pure greenhouse result. The relative ineffectiveness of the greenhouse effect is due to convection which carries heat past the bulk of the water vapor (which has a scale height of about 2km)..

Or Ramanathan & Coakley (1978):

A comparison of the radiative equilibrium temperatures with the observed temperatures has indicated the extent to which the other atmospheric processes, such as convection, large-scale circulation, and condensation processes, influence the thermal energy balance of the system. In most planetary atmospheres, radiative equilibrium temperatures cannot be sustained in the lower regions of the atmosphere..

Convection aids radiation in transporting energy from the surface of the planet to the atmosphere. The vertical transport of heat by convection tends to minimize the magnitude of dθ/dz..

And so Chilingar et al move to the “greenhouse” effect:

Therefore, the present-day greenhouse effect is approximately equal to +33°C. The term “greenhouse effect” is confusing from the physical point of view and leads the general public astray.

And like G&T, they point out that a greenhouse works differently from the atmosphere without noting that greenhouses are not used by atmospheric physicists to prove the effect of radiatively-active gases in the atmosphere. Instead atmospheric physics uses the fundamental equations (the radiative transfer equations) which determine absorption and emission of radiation by water vapor, CO2, methane, and other trace gases.

Proof of Negative Feedback

Now Chilingar and his colleagues bring out the simple equation balancing the effective radiation temperature of the earth with the solar radiation absorbed. But then they make the curious comment:

The water vapor condensation in troposphere begets clouds, which to a considerable degree determine the reflective properties of the planet, i.e., its albedo A. The latter gives rise to a strong negative feedback between the surface temperature Ts and the temperature of “absolutely black body” Tbb, which is determined by the solar radiation S reaching the Earth’s surface at its distance from the Sun.

Indeed, any increase in surface temperature intensifies the water evaporation and increases the Earth’s cloudiness, which, in turn, increases the Earth’s albedo. As a result, the reflection of solar heat from the clouds into space increases and the heat influx to the Earth’s surface decreases and the average surface temperature decreases to the previous level. Strong negative feedback in any system leads to linear dependence of system’s output on its input.

Why curious?

Because they provide no evidence for the claim of negative feedback. No papers, no equations, no research..

It might be true, but for us skeptics, we like to see evidence.

Anthropogenic Imact on the Earth’s Climate – Tiny

In their piece de resistance they start with:

The adiabatic theory allows one to evaluate quantitatively the influence of anthropogenic emission of carbon dioxide on the Earth’s climate.

And continue:

To evaluate the effect of anthropogenic emission of carbon dioxide on global temperature, one can use the adiabatic model together with the sensitivity analysis (Sorokhtin, 2001; Khilyuk and Chilingar, 2003, 2004). At sea level, if the pressure is measured in atmospheres, then p = 1 atm and

āT ≈ T α Δp                     (12)

If, for example, the concentration of carbon dioxide in the atmosphere increases two times (from 0.035% to 0.07%), which is expected by the year of 2100, then the atmospheric pressure will increase by Δp =  1.48  10-4 atm (Sorokhtin, 2001). After substitution of T = 288 K,  α = 0.1905, and Δp = 1.48  10-4 atm into Eq. (13), one obtains ΔT = 0.00812 °C..

Thus, the increase in the surface temperature at sea level caused by doubling of the present-day CO2 concentration in the atmosphere will be less than 0.01 °C, which is negligible in comparison with natural temporal fluctuations of global temperature.

From these estimates, one can deduce a very important conclusion that even considerable increase in anthropogenic emission of carbon dioxide does not lead to noticeable temperature increase. Thus, the hypothesis of current global warming as a result of increased emission of carbon dioxide (greenhouse gases) into the atmosphere is not true.

Awesome. Who could argue with that. It is in a peer-reviewed paper and has a lot of equations. Climate scientists, shame on you for neglecting convection. CO2 has almost no effect on the earth’s temperature..

The Conjuring Trick

It’s all very well to produce some equations, but in the interests of accuracy it’s important to produce the correct ones.

The conjuring trick in this paper is discussing the movement of heat from the surface to the troposphere (lower atmosphere) without discussing how the surface AND atmosphere lose heat to space.

Suppose that heat was transferred from the surface to the troposphere 100% by convection.

What would it prove? It would certainly be quite a different climate but there would still be an important question to ask.

One important question for all students of climate science is:

How does the earth’s climate system (surface, troposphere, stratosphere) lose heat to space?

Solar radiation heats the earth. In equilibrium, the earth and the atmosphere radiate the same amount of heat out to space. Imbalances between solar heating and radiative cooling change the amount of heat in the climate system.

Convection (and conduction) cannot move heat into space, only radiation can do this.

Increasing the concentration of “greenhouse” gases like CO2 has an important effect unmentioned by Chilingar and his colleagues. This effect is explained in The Earth’s Energy Budget – Part Three.

The higher the concentration of “greenhouse” gases, the more optically thick the atmosphere, and therefore radiative cooling to space takes place from higher up in the atmosphere.

The higher up you go, the colder it gets. The explanation is somewhat involved, so check out the link and also the series: CO2 – An Insignificant Trace Gas?

The important point is that Chilingar and his colleagues don’t mention this. They don’t prove the fundamental equations wrong. They don’t comment..

Perhaps they don’t understand the subject. Who knows?

Conclusion

The paper demonstrates nothing about the effect of increased CO2 on the earth’s climate.

It doesn’t show a problem in established arguments, like from Manabe and Strickler (1964), Ramanathan and Coakley (1978) or any other paper. The authors of this 2008 paper just imagine the established science away.

Understanding how the earth and atmosphere cool to space via radiation is a critical component in understanding surface temperature changes.

See also: New Theory Proves AGW Wrong!

References

Cooling of Atmosphere Due to CO2 Emission, Chilingar et al, Energy Sources, Part A: Recovery, Utilization, and Environmental Effects (2008)

Some Coolness concerning Global Warming, Lindzen, Bulletin of American Meteorological Society (1990)

Climate Modeling through Radiative-Convective Models, Ramanathan and Coakley, Reviews of Geophysics and Space Physics (1978)


Read Full Post »

This post “follows” on from Heat Transfer Basics and Non-Radiative Atmospheres and Do Trenberth and Kiehl understand the First Law of Thermodynamics? and many other posts that cover some basics.

It’s clear from comments on this blog and many other blogs that a lot of people have difficulty understanding simple scenarios because of a lack of understanding of the basics. Many confident (but erroneous) comments state that particular scenarios can never occur because they violate this or that law..

I know from my own experience that until a concept is conceptually grasped, a mathematical treatment is often not really helpful. It might be right, but it doesn’t help..

So this post has a number of examples that paint a picture. It has some maths too.

Enough examples might help some readers unfamiliar with thermodynamic concepts grasp the essence of some heat transfer basics.

Ignore the details if you like and just check the results from each example. Some maths is included to make it possible to check the results and understand the subject a little better.

Conduction

We will use the example of a “planar wall”. What exactly is that?

It’s a wall that extends off to infinity in both directions.

For those thinking this is some kind of climate madness, it’s simply physics basics – draw up a problem with simple boundary conditions and find the answer. If we start with some massively complex problem that approximates the real world then unfortunately there will be no conceptual understanding. And this article is all about conceptual understanding. Start with simple problems and gradually extend to more complex problems.. (The wall can just be a long wall if that makes you happier).

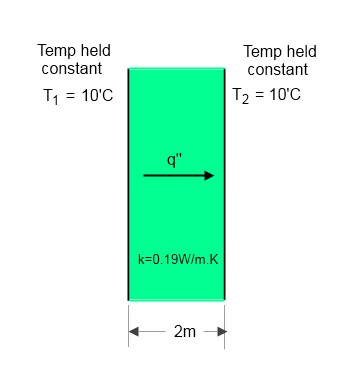
Example One is a wall, made out of PVC, with both sides held at a constant temperature (probably by a fluid at a constant temperature pumped over each side).

Example One – constant temperature conduction

We want to calculate the heat flux (heat flow per unit area) travelling through this wall of PVC.

The basic equation of heat conduction is:

q = kA . ΔT/Δx  (see note 1)

where ΔT is the temperature difference, Δx is the thickness of the wall, A is the area, k is the conductivity (the property of the material) and q is the heat flow.

To make things slightly easier we consider heat flux – heat flow per unit area, q”:

q” = k . ΔT/Δx

For PVC, k=0.19W/m.K

And for the case of this wall, T1 = 50°C, T2 = 10°C and therefore ΔT = 40°C

So,

q” = 0.19 x 40 / 2 = 3.8 W/m²

In this example, because the system is holding both surfaces at a constant temperature we have a constant (and continuous) flow of heat between surfaces.

You can see that not much heat is flowing because PVC is a very good insulator.

Example Two – constant temperature conduction, thinner wall

q” = 0.19 x 40 / 0.2 = 38 W/m²

So with the wall 10x thinner, the heat flux is 10 times greater. Hopefully, for most, this is intuitively obvious – put thinner insulation on a hot water pipe and it loses more heat; wear a thinner coat out in the cold and you get colder..

If we changed the PVC for metal then the heat flow would be very much higher, as metal conducts heat very effectively.

Now what’s supplying the heat? The liquid or gas being pumped over the higher temperature surface to keep it at that temperature.

Note that these surfaces will be radiating heat. However, this doesn’t affect the calculation of conducted heat between the two surfaces.

In simple terms, heat flow due to conduction depends on the temperature difference, the material and the dimensions of the body.

Example Three – no temperature differential

Now both sides of the wall are held at the same temperature,

q” = 0.19 x 0 / 2 = 0 W/m²

This is very simple, but obviously confuses some people, including some visitors to this blog. It is temperature difference that drives conduction of heat. If there is no temperature difference, there will be no conduction.

In these three examples we have constrained the temperature on each side to see what happens to heat flow. Now we will change these boundary conditions.

Conduction and Radiation

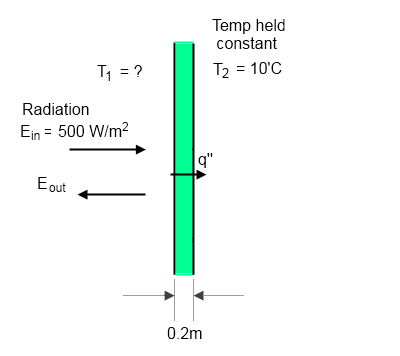
Example Four – constant heat supply one side, fixed temperature the other

This is example two but with a constant heat supply instead of a constant temperature on one side.

This example is now more complex. The right side of the wall is held at a constant temperature of 10°C, as with the first few examples, but the other surface of the wall now has a constant input of heat and we want to find out the temperature of that surface.

The heat source for the left side is incident radiation. We will assume that the proportion of radiation absorbed (“absorptivity”) is 80% or 0.8. And we will assume that the emissivity of the surface is also 0.8. See note 2.

How do we now calculate the surface temperature T1?

It’s quite simple in principle. We use the first law of thermodynamics – energy cannot be created or destroyed. And we will calculate the equilibrium condition – which is when steady-state is reached. This means no heat is being retained to increase the temperature.

So all we have to do is balance the heat flow terms at the surface (the left surface). Let’s take it step by step.

Energy absorbed from radiation:

Ein(absorbed) = Ein x 0.8

This is because 80% is absorbed and 20% is reflected, due to the material properties of PVC.

For energy balance, once the surface has reached a steady temperature:

Ein(absorbed) = q” + Eout (see the diagram)

q” is the heat flux through the wall, and Eout is the radiated energy. At this point we are assuming no convection (perhaps there is no atmosphere for example) to keep things simple.

Hopefully this is quite a simple concept – the heat absorbed from radiation is balanced by the heat radiated from the surface plus the heat conducted through the wall.

We can calculate the energy radiated using the well-known Stefan-Boltzmann equation,

Eout = εσT4

where ε = emissivity (0.8 in this example), σ is the Stefan-Boltzmann constant (5.67 x 10⁻⁸) and T is absolute temperature in K (add 273 to temperature in °C).

Except we don’t yet know the temperature.. Still, let’s put it all together and see what happens:

Ein(absorbed) = q” + Eout

Now put the numbers in that we know:

500 x 0.8 =  0.19 x ΔT / 0.2   +   0.8 x 5.67×10-8 x T14

Now ΔT is the temperature difference between T1 and T2. T2 is held constant at 10°C so ΔT=T1-10. However, the first term on the right is expressed in °C and the second term in absolute temperature (K). We will express both as absolute temperature, so ΔT = T1-283.

So now the equation is:

400 =  0.19 x (T1-283) / 0.2   +   0.8 x 5.67×10-8 x T14

The important point to note for those a little bewildered by all the numbers – we have used the first law of thermodynamics, the equation for emission of radiation and the equation for conducted heat and as a result we have an equation with only one unknown – the temperature.

This means we can find the value of T1 that satisfies this equation. (See note 3 for how it is found).

T1 = 302.80 K = 29.65°C

And using this value, conducted heat, q” = 18.7 W/m² and radiated heat, Eout = 381.3 W/m².

In this case, there is a lot more heat radiated compared with conducted.

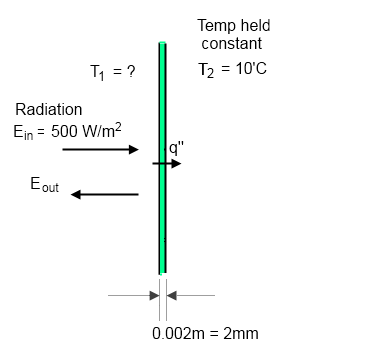
Example Five – as example four with a thinner wall

With a much thinner wall or a much higher conductivity the balance changes.

Changing the thickness of the wall from 0.2m to 2mm, keeping everything else the same and so using exactly the same equations as above, we get:

T1 = 284.24 K = 11.09°C

Note that this means the temperature differential across the wall has reduced to only (just over) 1°C.

And using this value, conducted heat, q” = 103.6 W/m² and radiated heat, Eout = 297.4 W/m².

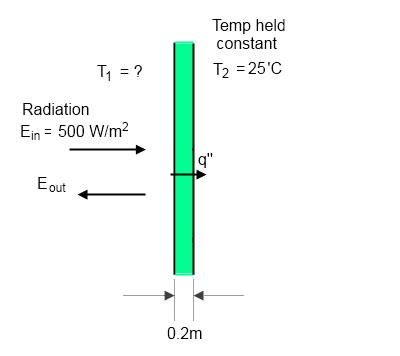
Example Six – as example four with increased “colder” temperature

Now with the 0.2m wall (example four) we increase the temperature of the colder side, from 10°C to 25°C.

Using the same maths we find that the temperature, T1, has increased:

T1 = 305.16K = 32.01°C

An increase of 2.36°C.

Most people are probably asking “why this example? it’s obvious that increasing the temperature of one side will lift the other..

However, many people believe that a colder atmosphere cannot affect the temperature of a warmer surface. See, for example, The First Law of Thermodynamics Meets the Imaginary Second Law. This reasoning is due to a misunderstanding of the second law of thermodynamics.

However, as conduction is quite familiar and more intuitive I expect that this example will be more easily accepted. And perhaps this last example will help a few people to see that a colder body can affect a warmer body without violating any laws of thermodynamics.

Conclusion

In Do Trenberth and Kiehl understand the First Law of Thermodynamics? I presented a hollow sphere in space with a heat source at its center. Some people were (and still are) convinced that there is something wrong with the results from that example. One person (at least) is convinced that the inner surface must be at the same temperature as the outer surface.

The only correct approach to calculating heat transfer and temperatures is to apply the relevant equations of conduction, convection and radiation to the particular problem in question.

  • Conduction of heat is proportional to the temperature difference across a material
  • Radiation of heat is proportional to the 4th power of (absolute) temperature of a surface
  • The first law of thermodynamics is used to solve these problems: energy in – energy out = energy retained, for any particular part of a system that you analyze

Many people rely on intuition for determining whether a solution is correct. However, intuition is not as reliable as applying the basic equations of heat transfer.

Note that the example in Do Trenberth and Kiehl understand the First Law of Thermodynamics? uses exactly the same equations and approach as the examples here. If these six examples are correct you will have trouble finding the flaw in the hollow sphere example.

Notes

Note 1 – Conventionally the equation of heat conducted has a minus sign because heat travels in the opposite direction to the temperature gradient. And for the purists, the more general equation of conduction is:

q” = -k∇T

where ∇T is the three dimensional version of the “change of T with respect to distance”

Note 2 – Emissivity = Absorptivity at a particular wavelength (and direction for “non-diffuse” surfaces). In the case of a surface receiving radiation and emitting radiation there is no reason why these two values should be the same. This is because the incident radiation will be at one wavelength (or range of wavelengths), but the wavelength of emission depends on the temperature of the surface.

Note 3 – One simple way to find the value that satisfies the equation is to plot the equation for a wide range of temperatures and look up the temperature value where the result is correct. This is what I did here. It is the work of a minute with Matlab.

Update – added Sep 15th

A graph of temperature vs wall thickness for Examples Four & Five (with T2 = 10°C):

Update – Added Sep 15th

3D graph for examples 4 to 6 – of how T1 varies with wall thickness and T2:

Click for a larger image

Update – added Sep 16th

3D graph of how T1 varies with emissivity. First, when absorptivity = emissivity:

Click for a larger image

Now with absorptivity (the proportion of incident radiation absorbed) set at 0.8, while the emissivity varies.

Click for a larger image

Notice that when the absorptivity and emissivity are equal the temperature T1 is pretty much independent of the actual value of emissivity/absorptivity – why is that?

And when emissivity varies while absorptivity is fixed (and therefore absorbed energy is fixed) the temperature T1 is pretty much independent of emissivity for very thin walls – why is that?

Read Full Post »