In On Having a Laugh – by Gerlich and Tscheuschner (2009) I commented that I had only got to page 50 and there were 115 pages in total.
Because there were so many errors already spotted, none central to the argument (the argument hadn’t started even at page 50), it seemed a pointless exercise to read it further. After all, many interesting papers await, on the thermohaline circulation, on models, on stratospheric cooling..
Perhaps most important of the criticisms was that Gerlich and Tscheuschner didn’t appear at all familiar with the climate science they were “debunking” – instead of commenting on encyclopedia references or throwaway comments in introductions to works unrelated to proving the inappropriately-named “greenhouse effect” they should be commenting on papers like Climate Modeling through Radiative-Convective Models by Ramanathan and Coakley (1978).
Clearly they were “having a laugh”
However, after noticing that a recent commenter actually cited Gerlich and Tscheuschner I went back and reviewed their paper. And in doing so I realized that many many misinformed comments by enthusiastic people on other popular blogs, and also this one, were included in the ground-breaking On Falsification Of The Atmospheric CO2 Greenhouse Effects by Gerlich and Tscheuschner.
It’s possible that rather than enthusiastic commenters obtaining misinformation from our duo that instead our duo have combined a knowledge of theoretical thermodynamics with climate science that they themselves obtained from blogs. The question of precedence is left as an exercise for the interested reader.
Miseducation
It is hard to know where to start with this paper because there is no logical flow.
Conductivity
The paper begins by reviewing the conductivity of various gases.
It is obvious that a doubling of the concentration of the trace gas CO2, whose thermal conductivity is approximately one half than that of nitrogen and oxygen, does change the thermal conductivity at the most by 0.03% and the isochoric thermal diffusivity at the most by 0.07 %. These numbers lie within the range of the measuring inaccuracy and other uncertainties such as rounding errors and therefore have no significance at all.
Clearly conductivity is the least important of means of heat transfer in the atmosphere. Radiation, convection and latent heat all get a decent treatment in studies of energy balance in the atmosphere.
If our duo had even read one book on atmospheric physics, or one central paper they would be aware of it.
Uninformed people might conclude from this exciting development that they have already demonstrated something of importance rather than just agreeing wholeheartedly with the work of atmospheric physicists.
Pseudo-Explanations to be Revealed in Part Two? Or Left as an Exercise for the Interested Student?
Following some demonstrations of their familiarity with mathematics and especially integration, they provide three conclusions, one of which refers to the Stefan-Boltzmann law, j=σT4:
The constant appearing in the T4 law is not a universal constant of physics. It strongly depends on the particular geometry of the problem considered.
and finish with (p21):
Many pseudo-explanations in the context of global climatology are already falsified by these three fundamental observations of mathematical physics.
Unfortunately they don’t explain which ones. The climate science world waits with baited breath..
The footnote to their comment on Stefan-Boltzmann:
For instance, to compute the radiative transfer in a multi-layer setup, the correct point of departure is the infinitesimal expression for the radiation intensity, not an integrated Stefan-Boltzmann expression already computed for an entirely divergent situation.
Sadly they are unfamiliar with the standard works in the field of the radiative-convective model.
Solar Energy Breakdown and A Huge Success in Miseducation
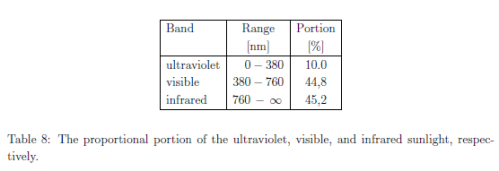
Solar Radiation Breakdown
They followed up this table with the hugely popular comment:
In any case, a larger portion of the incoming sunlight lies in the infrared range than in the visible range. In most papers discussing the supposed greenhouse effect this important fact is completely ignored.
First, a comment on the “benefit” of this miseducation – being able to separate out solar radiation from terrestrial radiation is a huge benefit in climate understanding – it allows us to measure radiation at a particular wavelength and know its source. But many people are confused and say we can’t because 50% of the solar radiation is “infrared”. Infrared means >0.7μm. Conventionally, climate scientists use “shortwave” to mean radiation < 4μm and “longwave” to mean radiation > 4μm. As less than 1% of solar radiation is >4μm this is a very useful convention. Any radiation greater than 4μm is terrestrial (to 99% accuracy).
Many uninformed people who have become miseducated are certain that much solar radiation is >4μm – possibly due to confusing infrared with longwave.
We don’t speculate on motives on this blog so I’ll just point out that Gerlich and Tscheuschner know very little about any climate science, and from this comment probably don’t even understand the inappropriately-named “greenhouse” effect.
Why? Well, what has the visibility of the radiation have to do with the “greenhouse” effect? Of course it’s ignored. Our duo are just demonstrating their ignorance of the absolute basics.
Or they have some amazing insight into how the visibility or not of solar radiation affects the radiative transfer equations. All to be shared in part two probably..
The Core Question – the Radiative Transfer Equations
After a brief explanation of Kirchoff’s law, our duo discuss the core equations, the radiative transfer equations (RTE):
LTE [local thermodynamic equilibrium] does only bear a certain significance for the radiation transport calculations, if the absorption coefficients were not dependent on the temperature, which is not the case at low temperatures. Nevertheless, in modern climate model computations, this approach is used unscrupulously.
Absorption and emission coefficients get a very thorough treatment in the numerical solutions to the RTE, however, our duo are only familiar with work around the 1900’s and skip all modern work on the subject. Perhaps a more accurate statement would be:
We have no idea what anyone does but we read somewhere that stuff wasn’t done right..
Or they could actually show what effect that dependency actually had..
Then they decide to support the RTE:

Fantastic, 50 pages in we find the real RTE. This is what atmospheric physicists use to calculate the absorption and re-emission of radiation for each layer in the atmosphere. They follow this up with:
The integrations for the separate directions are independent of one another. In particular, the ones up have nothing to do with the ones down. It cannot be overemphasized, that differential equations only allow the calculation of changes on the basis of known parameters.
The initial values (or boundary conditions) cannot be derived from the differential equations to be solved. In particular, this even holds for this simple integral.
What do they mean? Of course you need boundary conditions to solve all real-world equations.
The separate directions are independent of one another? Yes, you find that in all treatments of radiative transfer.
So Gerlich and Tscheuschner agree that the RTE can be used to solve the problem? Or not? No one can tell from the comments here. If they do, the paper should be over now with support for the inappropriately-named “greenhouse effect”, unless they demonstrate that they can solve them for the atmosphere and get a different result from everyone else.
But they don’t.
Fortunately for those interested in what our duo really know and understand – they tell us..
The Modern Solution to the RTE – or How to Miss an Important 100 Years
After surveying works from more than 100 years ago, they conclude:
Callendar and Keeling, the founders of the modern greenhouse hypothesis, recycled Arrhenius’ discussion of yesterday and the day before yesterday by perpetuating the errors of the past and adding lots of new ones.
In the 70s and 80s two developments coincided: A accelerating progress in computer technology and an emergence of two contrary policy preferences, one supporting the development of civil nuclear technology, the other supporting Green Political movements. Suddenly the CO2 issue became on-topic, and so did computer simulations of the climate. The research results have been vague ever since.
No explanation of Callendar and Keeling’s mistakes – this is left as an exercise for the interested student.
And no mention of the critical work in the 1960s and 1970s which used the radiative transfer equations and the convective structure of the atmosphere to find the currently accepted solutions.
In fact, the research results haven’t been vague at all. Regular readers of this blog will know about Ramanathan and Coakley 1978, and there are many more specific papers which find solutions to the RTE – using boundary conditions and separation of upward and downward fluxes, as wonderfully endorsed by our comedic duo.
More recent work has of course refined and improved the work of the 1960s and 1970s. And the measurements match the calculations.
But what a great way to write off a huge area of research. Show some flaws in the formative work 100 or so years ago and then skip the modern work and pretend you have demonstrated that the modern theory is wrong.
As we saw in the last section, our duo appear to support the modern equations – although they are careful not to come out and say it. Luckily, they are blissfully ignorant of modern work in the field, which all helps in the miseducation of the uninformed.
The main work of the paper should now be over, but our duo haven’t realized it. So instead they move randomly to the radiative balance concept..
Radiative Balance and Mathematical Confusion
In every introduction to atmospheric physics you find the concept of radiative balance – solar energy absorbed = terrestrial radiation emitted from the top of the atmosphere. These concepts are used to demonstrate that the atmosphere must absorb longwave (terrestrial) radiation.
This concept can be found in CO2 – An Insignificant Trace Gas? Part One
After looking at the basics of the energy balance, they comment – on the right value for albedo (or ‘1-albedo’):
In summary, the factor 0.7 will enter the equations if one assumes that a grey body absorber is a black body radiator, contrary to the laws of physics. Other choices are possible, the result is arbitrary.
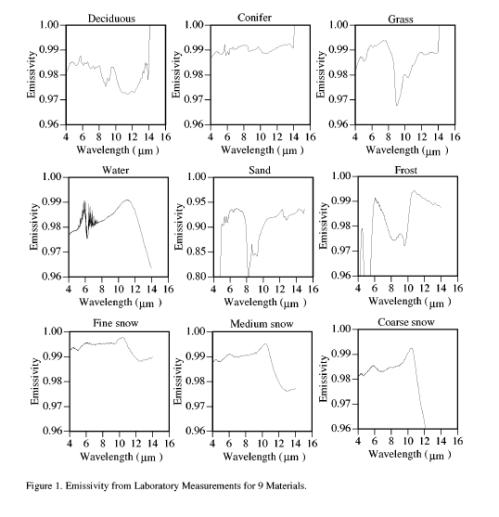
Being obscure impresses the uninformed. However, the informed will know that the earth’s emissivity and absorptivity will of course be different because the solar radiation is centered on 0.5μm while the terrestrial radiation is centered on 10μm. And the emissivity (and absorptivity) around 10um is very close to 1 (typically 0.98) while around 0.5μm the absorptivity is somewhat lower.
At this point, if we were to do a parody of our duo, we would write how their physics is extremely poor and do a three page derivation of absorptivity and emissivity as a function of wavelength.
Now follows many pages of maths explaining the impossibility of working out an average temperature for the earth during which they make the following interesting comment:
While it is incorrect to determine a temperature from a given radiation intensity, one is allowed to compute an effective radiation temperature Terad from T averages representing a mean radiation emitted from the Earth and to compare it with an assumed Earth’s average temperature Tmean
What they are saying is that for energy balance if we work out the radiation emitted from the earth we have dealt with the problem.
Fortunately for our intrepid duo, they are unacquainted with any contemporary climate science so the fact that someone has already done this work can be safely ignored. Earth’s Global Energy Budget by Trenberth, Fassulo and Kiehl (2008) covers this work.
To compute these effects more exactly, we have taken the surface skin temperature from the NRA at T62 resolution and 6-hour sampling and computed the correct global mean surface radiation from (1) as 396.4 W/m2. If we instead take the daily average values, thereby removing the diurnal cycle effects, the value drops to 396.1 W/m2 or a small negative bias. However, large changes occur if we first take the global mean temperature. In that case the answer is the same for 6 hourly, daily or climatological means at 389.2 W/m2. Hence the lack of resolution of the spatial structure leads to a low bias of about 7.2 W/m2. Indeed, when we compare the surface upward radiation from reanalyses that resolve the full spatial structure the values range from 393.4 to 396.0 W/m2.
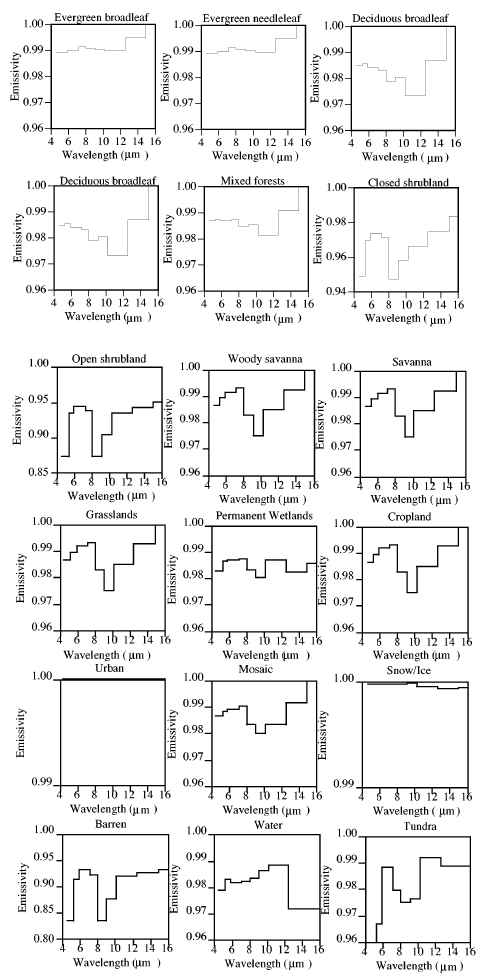
The surface emissivity is not unity except perhaps in snow and ice regions, and it tends to be lowest in sand and desert regions, thereby slightly offsetting effects of the high temperatures on longwave (LW) upwelling radiation. It also varies with spectral band (see Chédin et al. 2004 for discussion). Wilber et al. (1999) estimate the broadband water emissivity as 0.9907 and compute emissions for their best estimated surface emissivity versus unity. Differences are up to 6 W/m2 in deserts, and can exceed 1.5 W/m2 in barren areas and shrublands.
So there is potential variation of a few W/m2 depending on the approach, and Trenberth et al settles on 396 W/m2 average – at least the values can be calculated, whereas our duo decided it was computationally impossible – perhaps as they saw the problem as requiring a totally accurate GCM.
With this information, the radiative balance problem can be resolved and we can see that there is a discrepancy between the solar energy absorbed and the terrestrial radiation emitted which requires explanation. The inappropriately-named “greenhouse effect”.
Without this information we can delight in much maths and pretend that nothing can be known about anything.
Why Conduction Can be Safely Ignored and Why We Just Demonstrated It
In many climatological texts it seems to be implicated that thermal radiation does not need to be taken into account when dealing with heat conduction, which is incorrect. Rather, always the entire heat flow density q must be taken into account.. It is inadmissible to separate the radiation transfer from the heat conduction, when balances are computed..
Unfortunately, the work on even the simplest examples of heat conduction problems needs techniques of mathematical physics, which are far beyond the undergraduate level.
In fact in many texts on atmospheric physics conduction is safely ignored due to the very low value of heat conduction through gases. Strictly speaking, if we write an equation then all terms should be included, including latent heat and convection. Why just radiation and conduction?
As Ramanathan and Coakley pointed out in their 1978 paper, convection is what determines the temperature gradient of the atmosphere but solving the equations for convection is a significant problem – so the radiative convective approach is to use the known temperature profile in the lower atmosphere to solve the radiative transfer equations.
Still, no thought of conduction as that term is so insignificant – as our intrepid duo go on to realize..
Commenting on the insolubility of heat flow via conduction they take a “typical example”:
If the radius of the Moon were used as the characteristic length and typical values for the other variables, the relaxation time would be equivalent to many times the age of the universe.
Therefore, an average ground temperature (over hundreds of years) is no indicator at all that the total irradiated solar energy is emitted. If there were a difference, it would be impossible to measure it, due to the large relaxation times. At long relaxation times, the heat flow from the Earth’s core is an important factor for the long term reactions of the average ground temperature; after all, according to certain hypotheses the surfaces of the planetary bodies are supposed to have been very hot and to have cooled down. These temperature changes can never be separated experimentally from those, which were caused by solar radiation.
So heat flow by conduction is so low that achieving balance by this method will take more than the age of the universe. Therefore, it is insignificant in comparison with convection and radiation.
Good so we can move on and climate scientists are right to ignore it. Was that the point that Gerlich and Tscheuschner were making? Yes, although possibly without realizing it..
Finally, the Imaginary Second Law of Thermodynamics
In their almost concluding section we see where countless climate enthusiasts have obtained their knowledge (or the reverse).
First, here’s an extract from a contemporary work on thermodynamics. This is from Fundamentals of Heat and Mass Transfer, 6th edition (2007), by Incropera & Dewitt:
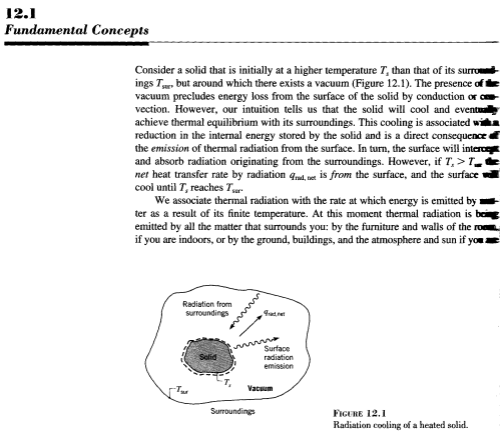
As can be seen in the text, radiation can be absorbed by a higher temperature surface from a lower temperature surface and vice versa. Of course, the net result is a heat transfer from the hotter to the cooler.
The same uncontroversial description can be found in any standard thermodynamics work, unless they consider it too unimportant to mention. Certainly, none will have a warning sign up saying “this doesn’t happen”.
The explanation of the “greenhouse effect” is that the earth’s surface warms the lower atmosphere by radiation (as well as convection and latent heat transfer). And the atmosphere in turn radiates energy in all directions – one of which is back to the earth’s surface. Believers in the imaginary second law of thermodynamics don’t think this can happen. And this is possibly due to the miseducation by our intrepid duo. Or perhaps they learnt their thermodynamics from many “climate science” blogs.
The result of the actual climate situation is that the earth’s surface is warmer than it would have been without this atmospheric radiation. Pretty simple in concept.
Here’s how Gerlich and Tscheuschner explain things:
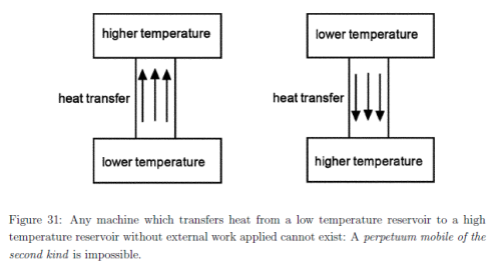
Everyone agrees.

Now the confusion. What are they saying? This isn’t what atmospheric physicists describe. The net heat transfer is from the earth’s surface (which was warmed by the sun) to the atmosphere.
Are they saying that it is impossible for any radiation to transfer heat from the atmosphere to the earth? It would appear so –
Following their diagram above, they comment, first quoting Rahmstorf:
Some `sceptics’ state that the greenhouse effect cannot work since (according to the second law of thermodynamics) no radiative energy can be transferred from a colder body (the atmosphere) to a warmer one (the surface). However, the second law is not violated by the greenhouse effect, of course, since, during the radiative exchange, in both directions the net energy flows from the warmth to the cold.
Rahmstorf’s reference to the second law of thermodynamics is plainly wrong. The second law is a statement about heat, not about energy. Furthermore the author introduces an obscure notion of “net energy flow”. The relevant quantity is the “net heat flow”, which, of course, is the sum of the upward and the downward heat flow within a fixed system, here the atmospheric system. It is inadmissible to apply the second law for the upward and downward heat separately redefining the thermodynamic system on the fly.
Our duo first attempt to confuse, as they frequently do in their opus by claiming that a clear explanation is obscure because precise enough terms aren’t used. It’s not obscure because they make the “correction” themselves.
Then add their masterstroke. It is inadmissible to apply the second law for the upward and downward heat separately redefining the thermodynamic system on the fly.
What on earth do they mean? Our comedic duo are the ones separating the system into upward and downward heat, followed by an enthusiastic army on the internet. Everyone else considers net heat flow.
As we saw in a standard work on thermodynamics, now in its 6th edition after two or three decades in print, there is no scientific problem with radiation from a colder to a hotter body – so long as there is a higher radiation from the hotter to the colder.
At this point I wonder – should I revisit the library and scan in 20 thermodynamic works? 50? What would it take to convince those who have been miseducated by our intrepid duo?
Perhaps Gerlich and Tscheuschner can now turn their attention to all of the unscientific text books like the one shown at the start of this section..
Conclusion
There is much to admire in Gerlich and Tscheuschner’s work. It can surely become a new standard for miseducation and we can expect its deconstruction by psychologists and those who study theories of learning.
From a scientific point of view, there is less to admire.
They have no understanding of modern climate science, content to dwell on works from over 100 years ago and ignoring any modern work. They appear to believe that the basis for the “greenhouse” effect is an actual greenhouse (as was covered in On Having a Laugh) even though no serious work on the subject relies on greenhouses. (Some don’t even mention it, some mention it to point out that the atmosphere doesn’t really work like a greenhouse).
In fact, the serious work of the last few decades relies on the radiative transfer equations – equations apparently endorsed by our duo, although their comments are “obscure”.
They take many other snipes at climate science by the approach of pointing out a term or dependency has been “neglected” (for example, like conduction through the atmosphere) without showing that the neglect has a significant impact – except in the case of conduction where (unwittingly?) they appear to show that conduction should definitely be ignored!
Someone could take issue with even modern work on climate science by the fact that they ignore relativistic effects.
Within the frame of modern physics, climate science is badly flawed to ignore relativity
And after 18 pages of unnecessary re-derivation of general relativity we find that “it’s therefore impossible to calculate this and the problem is insoluble“..
Well, although they haven’t read any modern climate science, it’s hard to see how they could be so confused about the application of the 2nd law of thermodynamics.
Perhaps in their follow up work they can explain why all the thermodynamics works are wrong, and especially where this 15μm (longwave) radiation comes from:
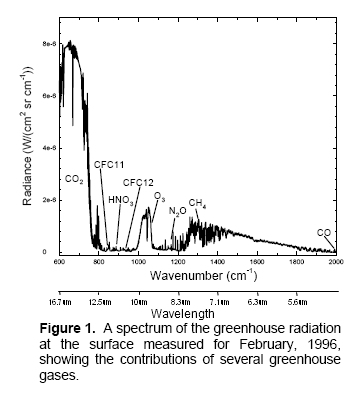
Measured downward longwave radiation at the earth's surface
According to their interpretation of the 2nd law of thermodynamics this can’t happen. No heat can flow from the colder atmosphere to the warmer surface as that would be a “perpetuum mobile” and therefore impossible.
Where is it coming from Gerlich and Tscheuschner?
Read Full Post »









On the Miseducation of the Uninformed by Gerlich and Tscheuschner (2009)
Posted in Commentary on April 5, 2010| 226 Comments »
In On Having a Laugh – by Gerlich and Tscheuschner (2009) I commented that I had only got to page 50 and there were 115 pages in total.
Because there were so many errors already spotted, none central to the argument (the argument hadn’t started even at page 50), it seemed a pointless exercise to read it further. After all, many interesting papers await, on the thermohaline circulation, on models, on stratospheric cooling..
Perhaps most important of the criticisms was that Gerlich and Tscheuschner didn’t appear at all familiar with the climate science they were “debunking” – instead of commenting on encyclopedia references or throwaway comments in introductions to works unrelated to proving the inappropriately-named “greenhouse effect” they should be commenting on papers like Climate Modeling through Radiative-Convective Models by Ramanathan and Coakley (1978).
However, after noticing that a recent commenter actually cited Gerlich and Tscheuschner I went back and reviewed their paper. And in doing so I realized that many many misinformed comments by enthusiastic people on other popular blogs, and also this one, were included in the ground-breaking On Falsification Of The Atmospheric CO2 Greenhouse Effects by Gerlich and Tscheuschner.
It’s possible that rather than enthusiastic commenters obtaining misinformation from our duo that instead our duo have combined a knowledge of theoretical thermodynamics with climate science that they themselves obtained from blogs. The question of precedence is left as an exercise for the interested reader.
Miseducation
It is hard to know where to start with this paper because there is no logical flow.
Conductivity
The paper begins by reviewing the conductivity of various gases.
Clearly conductivity is the least important of means of heat transfer in the atmosphere. Radiation, convection and latent heat all get a decent treatment in studies of energy balance in the atmosphere.
If our duo had even read one book on atmospheric physics, or one central paper they would be aware of it.
Uninformed people might conclude from this exciting development that they have already demonstrated something of importance rather than just agreeing wholeheartedly with the work of atmospheric physicists.
Pseudo-Explanations to be Revealed in Part Two? Or Left as an Exercise for the Interested Student?
Following some demonstrations of their familiarity with mathematics and especially integration, they provide three conclusions, one of which refers to the Stefan-Boltzmann law, j=σT4:
and finish with (p21):
Unfortunately they don’t explain which ones. The climate science world waits with baited breath..
The footnote to their comment on Stefan-Boltzmann:
Sadly they are unfamiliar with the standard works in the field of the radiative-convective model.
Solar Energy Breakdown and A Huge Success in Miseducation
Solar Radiation Breakdown
They followed up this table with the hugely popular comment:
First, a comment on the “benefit” of this miseducation – being able to separate out solar radiation from terrestrial radiation is a huge benefit in climate understanding – it allows us to measure radiation at a particular wavelength and know its source. But many people are confused and say we can’t because 50% of the solar radiation is “infrared”. Infrared means >0.7μm. Conventionally, climate scientists use “shortwave” to mean radiation < 4μm and “longwave” to mean radiation > 4μm. As less than 1% of solar radiation is >4μm this is a very useful convention. Any radiation greater than 4μm is terrestrial (to 99% accuracy).
Many uninformed people who have become miseducated are certain that much solar radiation is >4μm – possibly due to confusing infrared with longwave.
We don’t speculate on motives on this blog so I’ll just point out that Gerlich and Tscheuschner know very little about any climate science, and from this comment probably don’t even understand the inappropriately-named “greenhouse” effect.
Why? Well, what has the visibility of the radiation have to do with the “greenhouse” effect? Of course it’s ignored. Our duo are just demonstrating their ignorance of the absolute basics.
Or they have some amazing insight into how the visibility or not of solar radiation affects the radiative transfer equations. All to be shared in part two probably..
The Core Question – the Radiative Transfer Equations
After a brief explanation of Kirchoff’s law, our duo discuss the core equations, the radiative transfer equations (RTE):
Absorption and emission coefficients get a very thorough treatment in the numerical solutions to the RTE, however, our duo are only familiar with work around the 1900’s and skip all modern work on the subject. Perhaps a more accurate statement would be:
Or they could actually show what effect that dependency actually had..
Then they decide to support the RTE:
Fantastic, 50 pages in we find the real RTE. This is what atmospheric physicists use to calculate the absorption and re-emission of radiation for each layer in the atmosphere. They follow this up with:
What do they mean? Of course you need boundary conditions to solve all real-world equations.
The separate directions are independent of one another? Yes, you find that in all treatments of radiative transfer.
So Gerlich and Tscheuschner agree that the RTE can be used to solve the problem? Or not? No one can tell from the comments here. If they do, the paper should be over now with support for the inappropriately-named “greenhouse effect”, unless they demonstrate that they can solve them for the atmosphere and get a different result from everyone else.
But they don’t.
Fortunately for those interested in what our duo really know and understand – they tell us..
The Modern Solution to the RTE – or How to Miss an Important 100 Years
After surveying works from more than 100 years ago, they conclude:
No explanation of Callendar and Keeling’s mistakes – this is left as an exercise for the interested student.
And no mention of the critical work in the 1960s and 1970s which used the radiative transfer equations and the convective structure of the atmosphere to find the currently accepted solutions.
In fact, the research results haven’t been vague at all. Regular readers of this blog will know about Ramanathan and Coakley 1978, and there are many more specific papers which find solutions to the RTE – using boundary conditions and separation of upward and downward fluxes, as wonderfully endorsed by our comedic duo.
More recent work has of course refined and improved the work of the 1960s and 1970s. And the measurements match the calculations.
But what a great way to write off a huge area of research. Show some flaws in the formative work 100 or so years ago and then skip the modern work and pretend you have demonstrated that the modern theory is wrong.
As we saw in the last section, our duo appear to support the modern equations – although they are careful not to come out and say it. Luckily, they are blissfully ignorant of modern work in the field, which all helps in the miseducation of the uninformed.
The main work of the paper should now be over, but our duo haven’t realized it. So instead they move randomly to the radiative balance concept..
Radiative Balance and Mathematical Confusion
In every introduction to atmospheric physics you find the concept of radiative balance – solar energy absorbed = terrestrial radiation emitted from the top of the atmosphere. These concepts are used to demonstrate that the atmosphere must absorb longwave (terrestrial) radiation.
This concept can be found in CO2 – An Insignificant Trace Gas? Part One
After looking at the basics of the energy balance, they comment – on the right value for albedo (or ‘1-albedo’):
Being obscure impresses the uninformed. However, the informed will know that the earth’s emissivity and absorptivity will of course be different because the solar radiation is centered on 0.5μm while the terrestrial radiation is centered on 10μm. And the emissivity (and absorptivity) around 10um is very close to 1 (typically 0.98) while around 0.5μm the absorptivity is somewhat lower.
At this point, if we were to do a parody of our duo, we would write how their physics is extremely poor and do a three page derivation of absorptivity and emissivity as a function of wavelength.
Now follows many pages of maths explaining the impossibility of working out an average temperature for the earth during which they make the following interesting comment:
What they are saying is that for energy balance if we work out the radiation emitted from the earth we have dealt with the problem.
Fortunately for our intrepid duo, they are unacquainted with any contemporary climate science so the fact that someone has already done this work can be safely ignored. Earth’s Global Energy Budget by Trenberth, Fassulo and Kiehl (2008) covers this work.
So there is potential variation of a few W/m2 depending on the approach, and Trenberth et al settles on 396 W/m2 average – at least the values can be calculated, whereas our duo decided it was computationally impossible – perhaps as they saw the problem as requiring a totally accurate GCM.
With this information, the radiative balance problem can be resolved and we can see that there is a discrepancy between the solar energy absorbed and the terrestrial radiation emitted which requires explanation. The inappropriately-named “greenhouse effect”.
Without this information we can delight in much maths and pretend that nothing can be known about anything.
Why Conduction Can be Safely Ignored and Why We Just Demonstrated It
In fact in many texts on atmospheric physics conduction is safely ignored due to the very low value of heat conduction through gases. Strictly speaking, if we write an equation then all terms should be included, including latent heat and convection. Why just radiation and conduction?
As Ramanathan and Coakley pointed out in their 1978 paper, convection is what determines the temperature gradient of the atmosphere but solving the equations for convection is a significant problem – so the radiative convective approach is to use the known temperature profile in the lower atmosphere to solve the radiative transfer equations.
Still, no thought of conduction as that term is so insignificant – as our intrepid duo go on to realize..
Commenting on the insolubility of heat flow via conduction they take a “typical example”:
So heat flow by conduction is so low that achieving balance by this method will take more than the age of the universe. Therefore, it is insignificant in comparison with convection and radiation.
Good so we can move on and climate scientists are right to ignore it. Was that the point that Gerlich and Tscheuschner were making? Yes, although possibly without realizing it..
Finally, the Imaginary Second Law of Thermodynamics
In their almost concluding section we see where countless climate enthusiasts have obtained their knowledge (or the reverse).
First, here’s an extract from a contemporary work on thermodynamics. This is from Fundamentals of Heat and Mass Transfer, 6th edition (2007), by Incropera & Dewitt:
As can be seen in the text, radiation can be absorbed by a higher temperature surface from a lower temperature surface and vice versa. Of course, the net result is a heat transfer from the hotter to the cooler.
The same uncontroversial description can be found in any standard thermodynamics work, unless they consider it too unimportant to mention. Certainly, none will have a warning sign up saying “this doesn’t happen”.
The explanation of the “greenhouse effect” is that the earth’s surface warms the lower atmosphere by radiation (as well as convection and latent heat transfer). And the atmosphere in turn radiates energy in all directions – one of which is back to the earth’s surface. Believers in the imaginary second law of thermodynamics don’t think this can happen. And this is possibly due to the miseducation by our intrepid duo. Or perhaps they learnt their thermodynamics from many “climate science” blogs.
The result of the actual climate situation is that the earth’s surface is warmer than it would have been without this atmospheric radiation. Pretty simple in concept.
Here’s how Gerlich and Tscheuschner explain things:
Everyone agrees.
Now the confusion. What are they saying? This isn’t what atmospheric physicists describe. The net heat transfer is from the earth’s surface (which was warmed by the sun) to the atmosphere.
Are they saying that it is impossible for any radiation to transfer heat from the atmosphere to the earth? It would appear so –
Following their diagram above, they comment, first quoting Rahmstorf:
Our duo first attempt to confuse, as they frequently do in their opus by claiming that a clear explanation is obscure because precise enough terms aren’t used. It’s not obscure because they make the “correction” themselves.
Then add their masterstroke. It is inadmissible to apply the second law for the upward and downward heat separately redefining the thermodynamic system on the fly.
What on earth do they mean? Our comedic duo are the ones separating the system into upward and downward heat, followed by an enthusiastic army on the internet. Everyone else considers net heat flow.
As we saw in a standard work on thermodynamics, now in its 6th edition after two or three decades in print, there is no scientific problem with radiation from a colder to a hotter body – so long as there is a higher radiation from the hotter to the colder.
At this point I wonder – should I revisit the library and scan in 20 thermodynamic works? 50? What would it take to convince those who have been miseducated by our intrepid duo?
Perhaps Gerlich and Tscheuschner can now turn their attention to all of the unscientific text books like the one shown at the start of this section..
Conclusion
There is much to admire in Gerlich and Tscheuschner’s work. It can surely become a new standard for miseducation and we can expect its deconstruction by psychologists and those who study theories of learning.
From a scientific point of view, there is less to admire.
They have no understanding of modern climate science, content to dwell on works from over 100 years ago and ignoring any modern work. They appear to believe that the basis for the “greenhouse” effect is an actual greenhouse (as was covered in On Having a Laugh) even though no serious work on the subject relies on greenhouses. (Some don’t even mention it, some mention it to point out that the atmosphere doesn’t really work like a greenhouse).
In fact, the serious work of the last few decades relies on the radiative transfer equations – equations apparently endorsed by our duo, although their comments are “obscure”.
They take many other snipes at climate science by the approach of pointing out a term or dependency has been “neglected” (for example, like conduction through the atmosphere) without showing that the neglect has a significant impact – except in the case of conduction where (unwittingly?) they appear to show that conduction should definitely be ignored!
Someone could take issue with even modern work on climate science by the fact that they ignore relativistic effects.
And after 18 pages of unnecessary re-derivation of general relativity we find that “it’s therefore impossible to calculate this and the problem is insoluble“..
Well, although they haven’t read any modern climate science, it’s hard to see how they could be so confused about the application of the 2nd law of thermodynamics.
Perhaps in their follow up work they can explain why all the thermodynamics works are wrong, and especially where this 15μm (longwave) radiation comes from:
Measured downward longwave radiation at the earth's surface
According to their interpretation of the 2nd law of thermodynamics this can’t happen. No heat can flow from the colder atmosphere to the warmer surface as that would be a “perpetuum mobile” and therefore impossible.
Where is it coming from Gerlich and Tscheuschner?
Read Full Post »