Feeds:
Posts
Comments

Archive for August, 2015

In Renewables VI – Report says.. 100% Renewables by 2030 or 2050 we looked at a feasibility study for 100% renewables in Australia by 2030 and 2050. Many people see feasibility studies and say “look, it’s achievable and not expensive, what are we waiting for? Giddy up“. In fact, it was such an optimistic comment that led me to that report and to study it.

Feasibility studies are the first part of a journey into the unknown. Most things that look like they are possible usually are. But it might take 30 years longer and $100BN more than expected, even if we get there “in the end”. So feasibility studies attempt to get their hands around the scope of the task.

In my comment at the conclusion of the last article, after stating my point of view that getting to 100% renewables by 2030 was not at all realistic, I said:

Readers enthusiastic about renewable energy and frustrated by the slow pace of government action might think I am being unnecessarily pessimistic. Exactly the kind of attitude that the world cannot afford! Surely, there are upsides! Unfortunately, the world of large complex projects is a world that suggests caution. How many large complex projects finish early and cost only 80% of original budget? How many finish years late and cost 3x the original budget? How many apparently simple projects finish years late and cost 3x the original budget?

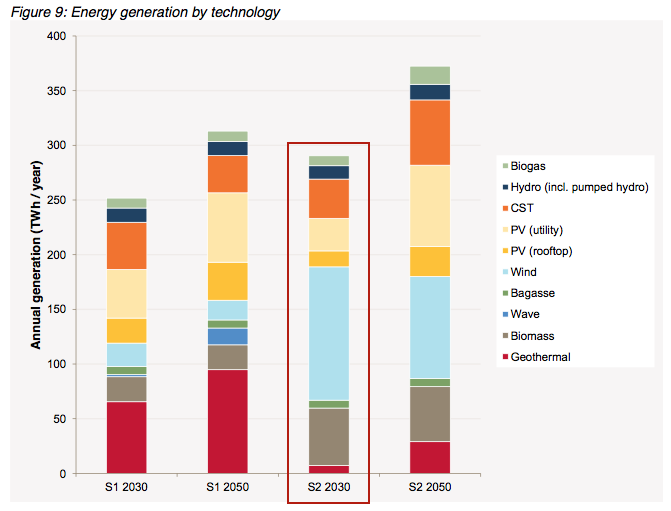
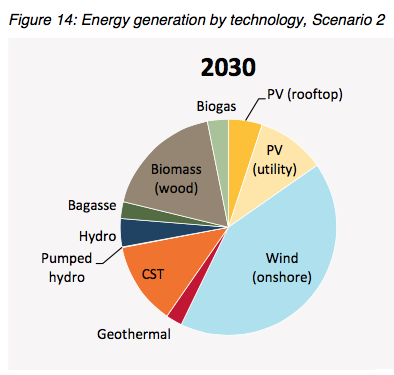
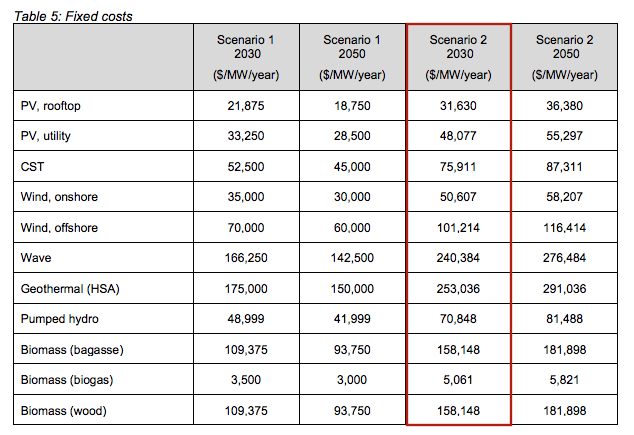
One of the questions that came up in the discussion was about geothermal – the report had an “optimistic on technology” 2030 scenario with 9 GW of supply, and the “optimistic” 2050 scenario with 13 GW of supply. We mainly focused in the report on the “non-optimistic” version which had no major technical breakthroughs and therefore little geothermal. I actually started digging into the detail because details are where the real stories are and also to understand why any geothermal was showing up in the “non-optimistic” 2030 scenario.

The Australian geothermal energy story turns out to be a salutary tale about feasibility and reality. So far. Of course, tomorrow is another day.

I would hate for readers to think I don’t believe in progress, in trying to break new ground, in new technologies. Far from it.

Most breakthroughs that have changed the world have started as ideas that didn’t really work, then half-worked, then inventors battled away for years or decades stubbornly refusing to “face reality” until finally they produced their “new steam engine”, their “wireless communication that spans countries”, their “affordable personal computer” and so on. The world we live in today is a product of these amazing people because inventions and technical progress change the world so much more than politicians.

All I am attempting to do with this series is separate fact from fiction, current technology from future technology and “feasible” from “accessible”. Many people want to change the world, to replace all of the conventional GHG-producing power with completely renewable power. Is it possible? What are the technical challenges? What will it really cost? These are the questions that this series tries to address.

And so, onto Lessons in Feasibility.

Here is a press release (originating from Geodynamics but on another website) in 2009:

An Australian geothermal energy company is at the forefront of one of the most important and exciting resource industries in the world and is preparing for a landmark year in 2009. Kate Pemberton reports.

By mid-2009, Brisbane-based Geodynamics expects to be providing Australia’s first hot rocks geothermal-generated electricity.

Following the successful completion of the Proof of Concept stage, the company’s joint venture operations with Origin Energy in the outback town of Innamincka, South Australia, will progress to commercial demonstration.

Geodynamics Managing Director and CEO Gerry Grove-White said Innamincka, which has a permanent population of just twelve, is set to be the proving ground for hot fractured rock (HFR) geothermal energy when it swaps diesel fuel power for geothermal power.

“From that one small step, Geodynamics aims to make the great leap into making the Cooper Basin a major new energy province for Australia,” said Mr Grove-White..

..Geodynamics said that the development of Australia’s vast geothermal resources could provide more than 25 per cent of the nation’s increase in demand for energy by 2050. The company believes Australia’s geothermal resources offer the most realistic and timely solution for the demand for clean, zero emission, base load power. In the coming year, Geodynamics will be seeking a significant proportion of the $500 [?] Renewable Energy Fund promised by the Federal Government to help finance its own commercial geothermal power demonstration plant.

I think the Renewable Energy Fund had $500M. On its own $500 wouldn’t get you far (just being realistic here), and another press release has:

Geodynamics also said it had submitted an application for $90 million of funding under the Federal Government’s Renewable Energy Demonstration Program (REDP).

The original press release went on:

Geodynamics’ Cooper Basin site is regarded as one of the hottest spots on earth outside volcanic centres. To date, the company has drilled three wells – Habanero 1 (named after the world’s hottest chilli), Habanero 2 and Habanero 3. Of these, Habanero 1 and 2 are not of commercial scale. Habanero 3, the first well to be drilled using the ‘Lightning Rig’, is the first commercially viable well to be drilled and its target depth of 4,221 metres was reached on 22 January 2008. The completion of drilling in Habanero 3 is the largest well of this depth ever drilled onshore in Australia and the first commercial scale HFR production well to be drilled. Geodynamics’ tenements – GELs 97, 98 and 99 – have been shown to contain more than 400,000 petajoules (PJ) of high-grade thermal energy. The company’s confidence is based on the fact that:

  • The size of the resource is clear – the large bodies of granite have been clearly delineated and proven to exist through drilling.
  • The quality and potential of the resource is proven – temperatures have been measured up to 250°C.
  • The world’s largest enhanced underground heat exchanger has been developed and initial flow tests have produced the first hot fluids to the surface.

Project studies, including long term production modelling, have shown that these resources have the potential to support a generating capacity of more than 10,000 megawatts (MW).

The company will now move forward to Stage 2 of the business plan – commercial demonstration – and expects to produce its first MW of geothermal power by the middle of 2009.

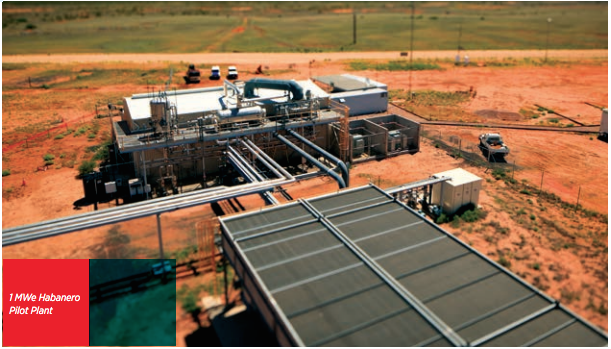
Mr Grove-White said “This great news, in conjunction with the impending commissioning of the 1 MW Pilot Plant, will allow the company to move on to building a commercial demonstration plant.”

The 1 MW pilot power station will enable the company to use geothermal energy to power its field operations near Innamincka, including workers’ accommodation, warehouses and workshops.

The company also plans to finalise its preferred design for a 50 MW power plant during 2009. Once operational (planned for 2012), the power plant will produce zero emissions with zero water requirements and will produce enough electricity to power approximately 50,000 households on a continuous basis.

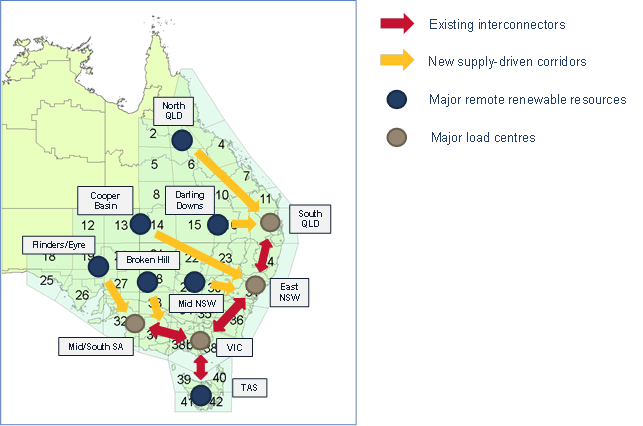
Geodynamics is focused on delivering power to the national electricity grid in 2011, with a targeted production of more than 500 MW by 2016. The company said that eventually output will reach 10,000 MW – the equivalent of 10 to 15 coal-fired power stations – giving hot rocks energy a justifiable claim as a great Australian resource to rank with the Snowy Mountains Scheme. Geodynamics has conducted concept studies to define options for transmitting power from the Cooper Basin to major load centres such as Brisbane, Adelaide or Sydney.

So it’s very positive. About to start up a 1MW plant within a few months, a 50MW plant expected in 2012 and a 500MW plant for 2016.

Long term – 10GW. This is around 25% of Australia’s projected electricity demand in 2050.

We are almost in 2016, so let’s see their progress.

The 2012/2013 report (year ending June 30th, 2013):

The first milestone was the successful completion of the Habanero 4 well and commissioning of the 1 MWe Habanero Pilot Plant in April 2013. Realising this long held goal is a significant achievement and an important demonstration of EGS technology. As one of only three EGS plants operating globally and the first new EGS plant to be commissioned for a significant period of time, there has been a great deal of interest in our results around the world, particularly in the unique reservoir behaviour of the Innamincka granite resource..

So, close to mid-2009, the company was confident of generating 1MW of power “by mid-2009”. 1MW was finally produced in 2013. There are some nice technical descriptions within the report for people who want to take a look:

Geodynamics

Innamincka – You should see the nightlife

As for plans going forward in mid-2013:

Our focus for the year ahead is demonstrating the feasibility of a viable small scale commercial plant to supply customers in the Cooper Basin. The first key objectives are the completion of a field development plan for a 5 – 10 MWe commercial scale plant, based on a six well scheme exploiting the high permeability reservoir created at Habanero. The feasibility of supplying process heat as an alternative to supplying power will also be investigated as part of this study.

A year later, the 2013/2014 annual report:

We are Australia’s most advanced geothermal exploration and development company, and a world leader in the emerging field of Enhanced Geothermal Systems (EGS). This year, the Company passed a major milestone with completion of the 1 MWe Habanero Pilot Plant trial near Innamincka, South Australia, one of only three EGS plants operating globally.

Following the successful pilot plant trial, the Company signed an exclusivity agreement with Beach Energy Limited, in regards to our exploration tenements in the Cooper Basin, an important step towards securing a customer for the geothermal resource. Under the agreement, a research program will assess the potential of the Habanero resource to supply heat and/or power to Beach’s potential gas developments in the area.

And now up to date, here is the 2014/2015 annual report (year ending June 30th, 2015):

In line with our search for profitable growth investment opportunities, on 14 July 2015 Geodynamics announced an all scrip offer to acquire Quantum Power Limited. The merger of the two companies will provide Geodynamics shareholders with entry into the biogas energy market, a growing and attractive segment of the clean technology and renewable energy sector, and exposure to immediate short-term attractive project opportunities and a pipeline of medium and longer term growth opportunities.

Geodynamics will continue to actively seek other opportunities to invest in alongside the Quantum investment to build a strong portfolio of opportunities in the clean technology sectors. Having successfully completed the sale and transfer of the Habanero Camp to Beach Energy Limited, additional field works in the Cooper Basin will be undertaken to plug and abandon and complete site remediation works associated with the Habanero-4, Habanero-1, Jolokia and Savina well sites and the surface infrastructure within the Habanero site in line with our permit obligations..

..As reported at 30 June 2014, the Company finalised the technical appraisal of its Cooper Basin project and associated resource. In the absence of a small scale commercial project or other plan to commercialise the project in the medium term, the Company impaired the carrying amount of its deferred exploration, evaluation and development costs in respect of the Cooper basin project to $nil.

[Emphasis added].

Oh.

Who did they sell the camp to?

Beach Energy is an ASX 100 listed oil and gas exploration and production company, with a primary focus on the health and safety of its employees. The company also prioritises a commitment to sustainability and the improvement of social, environmental and economic outcomes for the benefit of all its stakeholders. Beach is focused on Australia’s most prolific onshore oil and gas province, the Cooper Basin, while also having permits in other key basins around Australia and overseas.

Whether or not anyone will be able to produce geothermal energy from this region of Australia is not clear. Drilling over 4km through rock, and generating power from the heat down below is a risky business.

It’s free renewable energy. But there is a cost.

One company, Geodynamics, has put a lot of time and money (from government, private investors and Origin Energy, a large gas and power company) into commercial energy generation from this free energy source and it has not been successful.

Feasibility studies said it could be done. The company was months away from producing their first 1MW of power for 4 years before they succeeded and, following that success, it obviously became clear that the challenges of producing on a commercial scale were too great. At least for Geodynamics.

The only lesson here (apart from the entertainment of deciphering CEO-speak in annual reports) is feasibility doesn’t equate to success.

The dictionary definition seems to be “if something is feasible, then you can do it without too much difficulty”. The reality of “feasibility studies” in practice is quite different, let’s say, “buyer beware”.

Lots of “feasible” projects fail. I had a quick scan through the finances and it looks like they spent over $200M in 6 years, with around $62M from government funding.

We could say “more money is needed”. And it might be correct. Or it might be wrong. Geothermal energy from the Cooper Basin might be just waiting on one big breakthrough, or waiting on 10 other incremental improvements from the oil and gas industry to become economic. It might just be waiting on a big company putting $1BN into the exercise, or it might be a project that people are still talking about in 2030.

Individuals, entrepreneurs and established companies taking risks and trying new ideas is what moves the world forward. I’m sure Geodynamics has moved the technology of geothermal energy forward. Companies like that should be encouraged. But beware press releases and feasibility studies.

Articles in this Series

Renewable Energy I – Introduction

Renewables II – Solar and Free Lunches – Solar power

Renewables III – US Grid Operators’ Opinions – The grid operators’ concerns

Renewables IV – Wind, Forecast Horizon & Backups – Some more detail about wind power – what do we do when the wind goes on vacation

Renewables V – Grid Stability As Wind Power Penetration Increases

Renewables VI – Report says.. 100% Renewables by 2030 or 2050

Renewables VII – Feasibility and Reality – Geothermal example

Renewables VIII – Transmission Costs And Outsourcing Renewable Generation

Renewables IX – Onshore Wind Costs

Renewables X – Nationalism vs Inter-Nationalism

Renewables XI – Cost of Gas Plants vs Wind Farms

Renewables XII – Windpower as Baseload and SuperGrids

Renewables XIII – One of Wind’s Hidden Costs

Renewables XIV – Minimized Cost of 99.9% Renewable Study

Renewables XV – Offshore Wind Costs

Renewables XVI – JP Morgan advises

Renewables XVII – Demand Management 1

Renewables XVIII – Demand Management & Levelized Cost

Renewables XIX – Behind the Executive Summary and Reality vs Dreams

Read Full Post »

Regular readers are probably used to the lack of clear direction as we progress through a series (and switch to a new series, and back to an old series). Better series would have a theme, an outline, an overall direction, basically some kind of plan. Instead, we have part VI.

As I was reading the comments in The Conversation – Australia’s 2030 climate target puts us in the race, but at the back I saw that getting to 100% renewables in Australia was perfectly achievable:

The AEMO and UNSW studies showed that 100% renewables is viable and affordable. There are no problems with 50%.

– and so I thought I would take a look. It’s quite appealing to be able to convert all of a country’s electricity supply to renewables. And Australia has a couple of big benefits – lots of sunshine, and lots of land compared with the population. Probably most countries in the developed world have commissioned a report on how to get to 40% and 100% renewables by year x and Australia is no different.

As a positive the study considered two different cases and two time horizons:

The modelling undertaken presents results for four selected cases, two scenarios at two years, 2030 and 2050. The first scenario is based on rapid technology transformation and moderate economic growth while the second scenario is based on moderate technology transformation and high economic growth. The modelling includes the generation mix, transmission requirements, and hypothetical costs for each.

The major difference to 2050 is more population and economic growth, so we’ll focus on 2030 – especially as sooner is obviously better (and perhaps more difficult). And the first scenario basically assumes lots of new stuff that doesn’t exist yet, so we’ll focus on the second scenario.

As always with papers and studies, I recommend readers to review the whole document, not rely on my extracts.

The modelling suggests that considerable bioenergy could be required in all four cases modelled, however this may present some challenges. Much of the included biomass has competing uses, and this study assumes that this resource can be managed to provide the energy required. In addition, while CSIRO believe that biomass is a feasible renewable fuel, expert opinion on this issue is divided.

The costs presented are hypothetical; they are based on technology costs projected well into the future, and do not consider transitional factors to arrive at the anticipated cost reductions. Under the assumptions modelled, and recognising the limitations of the modelling, the hypothetical cost of a 100 per cent renewable power system is estimated to be at least $219 to $332 billion, depending on scenario. In practice, the final figure would be higher, as transition to a renewable power system would occur gradually, with the system being constructed progressively. It would not be entirely built using costs which assume the full learning technology curves, but at the costs applicable at the time.

The 2030 “no great technology breakthrough” scenario is given as $252 BN – “Capital costs are based on DCCEE scope assumptions which include: assumed system build in 2030 or 2050 without consideration of the transition path; and no allowance for distribution network costs, financing costs, stranded assets, land acquisition costs or R&D expenditure.

These figures are in Australian dollars and in 2013-2014 government spending was around A$400BN. Over 15 years the estimated cost of going to 100% renewables is about $17 BN per year or roughly 4% of government spending per year. What governments euphemistically call “defence” is costed at $20BN in the Australian budget so it’s not impossible. Swords into ploughshares, and F-35A Lightning II’s into Vestas V112 wind turbines..

However, assuming that achieving 100% renewables starting in 2030 requires building stuff today (not starting on Jan 1st, 2030) we should look at what it costs to build renewables today. I’ve taken their numbers as a given. The same calculations come out as 50% – 100% higher (using their estimate of today’s costs rather than 2030 cost projections), so maybe $370-$500BN.

Given there is as yet no detailed project plan (and no budget) the best case is to start building close to 2020, so more like $30-$50BN per year. Let’s call it 10% of government spending. (The study looked at increasing electricity prices to pay the bill).

What was encouraging in the study – for the 2030 scenario 2 study – was:

  • no obvious assumption of “game changer” technology that would magically appear
  • some costing associated with upgrading the transmission network (critical requirement)
  • the current (estimated) capital costs were given, as well as the future estimated capital costs

Of course, many caveats come with a feasibility study:

It is important to note that the cost estimates provided in this study do not include any analysis of costs associated with the following:

  1. Land acquisition requirements. The processes for the acquisition of up to 5,000 square kilometres of land could prove challenging and expensive.
  2. Distribution network augmentation. The growth in rooftop PV and demand side participation (DSP) would require upgrades to the existing distribution networks.
  3. Stranded assets. While this study has not considered the transition path, there are likely to be stranded assets both in generation and transmission as a result of the move to a 100 per cent renewable future.

Costs for each of these elements are likely to be significant.

This report is not to be considered as AEMO’s view of a likely future, nor does it express AEMO’s opinion of the viability of achieving 100 per cent renewable electricity supply.

Buying 5,000 km² of land could be cheap if it is out in the desert or $10BN if in the country.

Transmission lines might be the the wild card – you need transmission lines to get power from the new supply locations to the load centers – i.e., people. People are in cities. Land in cities and close to cities is expensive. Building the transmission lines and connecting generation was estimated at $27BN but it’s not clear if it includes the land acquisition costs. Here is the map of the added infrastructure:

AEMO-fig4-new-transmission

Figure 1

Where the Energy Will Come From

It was a surprise to find that solar was not the biggest by far. All that sun – and yet solar is still outclassed by wind:

AEMO-GenerationMix-fig9

Figure 2

CST = Concentrating Solar Thermal, in this case it comes with storage. The yellows and oranges are solar of various types, while blue is wind.

Focusing on scenario 2 for 2030:

AEMO-fig14

Figure 3

Capital costs per unit energy, by type. Note the difference between “today” i.e., the first column, and the estimated future costs for the scenario in question:

AEMO-Capitalcosts-table4

Figure 4

The estimated capital costs, with the assumption that all the costs are incurred in the final year:

AEMO-Costs-table5

Figure 5

I noted that geothermal is very expensive in that 2030 scenario, and is currently unproven technology (there are lots of practical difficulties once the geothermal source is not close to the surface), so it’s not really clear why they didn’t go for biomass instead of limited geothermal. It seems that there is believed to be some limited, easier to access, geothermal supply close to population centers.

Common to all scenarios is the need to change the timing of demand load.

The most challenging power system design issue, or ‘critical period’, that emerged from the modelling was meeting the evening demand when PV generation decreases to zero on a daily basis.

To manage demand at this time, the modelling shifts the available flexible demand from evening to midday, to take advantage of the surplus of PV generation that typically occurs.

Even so, the majority of dispatchable generation and the largest ramps in dispatchable generation occur in the evening in all four cases. With EV [electric vehicle] recharging possibly being more efficient during the day rather than overnight (when a fossil fuelled system would have surplus generation), installing EV recharging infrastructure at workplaces and shopping centres may need to be considered.

This figure below is using scenario 1 (new technologies), but the changes in demand are in all scenarios:

AEMO-fig2-scenario1-with-demand-management

Figure 6

However, the scenario we are looking closest at seems to have the least requirement for demand shifting, but it’s still there:

AEMO-fig20-winter-demand-matching

Figure 7

Expected DSP increases result from appropriate incentives being implemented to enable consumers to alter the quantity and timing of their energy consumption to reduce costs. This drives a shift in consumption patterns that responds to market needs and takes advantage of high renewable generation availability (usually when PV is peaking) to reduce energy spills.

Scenario 1 assumes up to 10% of demand is available for DSP and Scenario 2 assumes up to 5%. For each case modelled, half of the DSP is assumed to be curtailable load (that is, demand which can be reduced at a given cost) and half is modelled as ‘movable demand’ which can be consumed at an alternative time that day.

Both components of DSP represent voluntary customer behaviour. These are separate to unserved energy (USE), which is involuntary curtailment of customer demand. The reliability standard discussed in Section 5.2 refers to USE only, not DSP.

[Emphasis added].

Key Technical Points

There are four important points that we can see in this report:

  • a requirement for baseload – you can’t generate 100% of electricity from wind and solar, you need some “dispatchable” power source as a backup, either conventional power stations, or, in this case, biomass, and some solar which has the critical addition of (expensive) storage
  • new transmission – when you create a lot of new power generation you need to move it from the new supply locations to the demand centers (mostly cities) – this requires new transmission lines
  • demand management to improve the time of day matching of supply and demand – when you have significant solar there is a problem: peak power is often generated at a different time from peak demand
  • no new hydro – in most developed countries this renewable energy source is “tapped out”

We will look into the transmission issues and costs in future articles.

I’d like to highlight the 3rd point here – in many countries solar PV has been taken up by the population because of “feed-in tariffs” that give the (affluent) PV solar purchaser a kWh buy price many times the wholesale price. And this generous price is for electricity at a time when the grid demand is often low.

However, once solar PV moves from a hobby to a grid necessity, given that there is no conventional baseload, it is a necessity to move demand to the time of maximum sunshine. As a result, demand management seems to have two components:

  • price signals to move demand to times of maximum supply (perhaps new technology, aka smart metering, in each home, perhaps a news report?)
  • storage capacity to allow consumers to purchase at times of low demand or solar PV owners to supply at times of high demand

How does this transition happen? If I had purchased solar PV with a very favorable feed-in tariff for 20 years why would I double or treble my investment to add sufficient storage? (The answer is I wouldn’t). If I am a consumer without solar PV (or with solar PV but no feed-in tariff) what kind of punitive prices do I need to see on my electricity bill before I go out and purchase my very expensive battery pack? And/or what kind of subsidies from the government will be necessary?

It would be interesting to see where these costs of demand management appear – perhaps they are missing from the estimated price tag. If consumers demonstrate impressive resistance it’s not clear whether the 2030 scenario 2 works. That is, demand management may be a project plan dependency and therefore would need to be resolved first.

The Bill

I was surprised by the low price.

However, I was involved as a minor supplier in a commercial energy project (not a renewable) that was fully costed, with a detailed project plan, that had a cost estimate in many $BNs, yet increased by >50% during the life cycle of the project (a few years). Many factors increased the cost: the complexity of the project, escalating contractor costs, technical difficulties that had been underestimated – along with project delays due to land issues and environmental compliance. Some initial assumptions that seemed reasonable turned out to be wrong – and as anyone involved in big projects will affirm – small changes to scope, specification and timing can lead to very large unintended consequences.

Feasibility studies are a great starting point. Lots of projects pass feasibility but actual costs and risks – even before detailed design – turn out to be much higher than anticipated and the project never starts. One way to resolve the problem is to use an EPC (engineering, procurement and construction company) and get a fixed price proposal. The EPC takes the risk – and prices the risk into the job. They also write a specification with assumptions that ensure all variations (like project delays due to land acquisition) are extras. Running very large projects is difficult.

I’m sure no government has obtained an EPC price for a national 100% renewable project. Actually writing the specification would take a couple of years, and getting bids and negotiating the contract probably another year or two. If the price came out at $750BN instead of $250BN I wouldn’t be surprised. Of course, in any kind of competitive bid, intelligent bidders calculate the “missing elements” in the specification written by the client or their engineer, subtract that from their estimate of the final price and bid the difference. So the bid price is the minimum and doesn’t tell you the final bill – but it would have a lot more realism than a feasibility study.

As a counter, “big bang projects” have a huge risk, but changes that can take place incrementally, even ones that radically change the landscape over decades, have much lower inherent risk. If you told someone in England in 1880 that within 70 years virtually the entire country would have an affordable yet amazing new power source called “electricity” for lights, heating, cooking, industry – and a network of roads for motor vehicles that ran on “petrol” (= “gasoline” in America) – they would probably have laughed. “Who will pay for this?” “Where will all this infrastructure come from?”

But all of this did happen. In England the electricity supply was initially from wealthy landowners, private enterprises and municipal projects. Later, the CEGB was formed and took over all the little supply projects, linking them together. Somehow, an entire new industry was formed out of basically nothing. No overall project plan to be seen. Of course, the benefits of creating this system were huge and contributed to economic miracles by way of productivity. It’s a little different when you are displacing an existing system for a new system with the same output.

Of course, another point with the cost comparison is that over the next 35 years much of the current power generation will need to be replaced anyway – at what cost? So the real comparison cannot be “cost of 100% renewable electricity” vs zero, instead it must be “cost of 100% renewable electricity” vs “deferred cost of replacing conventional generation” – with the appropriate discount rates for deferred cost.

Overall, I found it an interesting document – with plenty of good explanations around assumptions. But as well as saying “The AEMO and UNSW studies showed that 100% renewables is viable and affordable..” we could equally say “The AEMO and UNSW studies showed that 100% renewables may be very expensive, with some critical elements that first need to be resolved..”  That’s the great thing about feasibility studies, something for everyone.

For example:

However, to fully understand the operational issues that such a system might pose, it would be necessary to undertake a full set of dynamic power system studies, which is beyond the scope of this report.

In a 100 per cent renewable NEM, there are likely to be instances when non-synchronous technologies would contribute the majority of generation. Many of these non-synchronous generation sources are subject to the inherent weather variations and forecast-uncertainty of the wind, sunshine or waves.

The resulting power system is likely to be one that is at or beyond the limits of known capability and experience anywhere in the world to date, and would be subject to a number of important technical and operational challenges. Many of the issues identified would require highly detailed technical investigations that are beyond the scope of this study.

Transitioning to a very high renewable energy NEM over time would allow more scope for learning and evolution of these challenges. Further refinement of the generation mix or geographical locations could also be applied to overcome particularly onerous operational issues. International collaboration and learning will also be helpful.

Now, just to be clear, none of this relies on new ground-breaking technology. I’m sure it is all solvable. But these kinds of issues are why I think a 2030 scenario is not one that has any relationship with reality.

2030 is “possible”, but there’s a lot of building to do and you can’t start building until you know what you are building, how it will be connected together and how it will be managed and controlled.

If you ask a competent team to work out an actual delivery plan there will be several years of work (at least) just in resolving the technical questions. Your front-end engineering design should be where all the hard work is done. Trying to redesign around new core assumptions once you are in detailed design will cost many times more. Trying to redesign around core assumptions once you are in implementation and commissioning will cost 10x more.

As a pithy summary, a software engineer I once worked with had this pinned above his desk: “Remember, you can save hours of design with just a few weeks of coding.

Readers enthusiastic about renewable energy and frustrated by the slow pace of government action might think I am being unnecessarily pessimistic. Exactly the kind of attitude that the world cannot afford! Surely, there are upsides! Unfortunately, the world of large complex projects is a world that suggests caution. How many large complex projects finish early and cost only 80% of original budget? How many finish years late and cost 3x the original budget? How many apparently simple projects finish years late and cost 3x the original budget?

Articles in this Series

Renewable Energy I – Introduction

Renewables II – Solar and Free Lunches – Solar power

Renewables III – US Grid Operators’ Opinions – The grid operators’ concerns

Renewables IV – Wind, Forecast Horizon & Backups – Some more detail about wind power – what do we do when the wind goes on vacation

Renewables V – Grid Stability As Wind Power Penetration Increases

Renewables VI – Report says.. 100% Renewables by 2030 or 2050

Renewables VII – Feasibility and Reality – Geothermal example

Renewables VIII – Transmission Costs And Outsourcing Renewable Generation

Renewables IX – Onshore Wind Costs

Renewables X – Nationalism vs Inter-Nationalism

Renewables XI – Cost of Gas Plants vs Wind Farms

Renewables XII – Windpower as Baseload and SuperGrids

Renewables XIII – One of Wind’s Hidden Costs

Renewables XIV – Minimized Cost of 99.9% Renewable Study

Renewables XV – Offshore Wind Costs

Renewables XVI – JP Morgan advises

Renewables XVII – Demand Management 1

Renewables XVIII – Demand Management & Levelized Cost

Renewables XIX – Behind the Executive Summary and Reality vs Dreams

References

100 percent Renewables Study – Modelling Outcomes, Australian Energy Market Operator Limited (2013)

Read Full Post »

This field is changing rapidly and so some of these issues may be better resolved than appears from some of the extracts. But it is useful to understand that currently there are limits to the penetration of some kinds of renewable energy on the electricity grid and it is still an area of international research.

In essence the “old-fashioned” power system had lots of big rotating equipment generating power at the business end. This has a lot of inertia – by which I mean inertia in the physics sense, rather than in the sense of institutional resistance..

The rotation is at a speed that generates 50 Hz or 60 Hz depending on where in the world you live. Supply has to match demand on a second by second basis. As the load on the system increases, it slows down the rotation of all of the large generation equipment and this allows two things:

  • automatic response from systems (that monitor the frequency) to increase power
  • flags to the operator to bring other power supply systems online (standby systems, aka reserves)

Wind turbines also rotate but they they don’t act the same as “old-fashioned” power systems – their inertial energy, in most cases, is effectively decoupled from the grid. This isn’t a problem at small penetration levels but the problem increases as the wind power penetration increases. This is called System Non-Synchronous Penetration (SNSP) – although in different places there may be different terms and acronyms.

There is also the critical issue of fault ride-through, which means that if the line voltage drops/collapses – when it comes back the wind farm should continue to provide power. This is critical at high penetration levels, because, without fault ride-through in wind farms, a temporary line voltage drop could take out the entire wind power generation system.

Here is Göksu et al (2010):

Conventional power plants, which are composed of synchronous generators, are able to support the stability of the transmission system by providing inertia response, synchronizing power, oscillation damping, short-circuit capability and voltage backup during faults. These features allow the conventional power plants to comply with the grid codes, thus today’s TSOs have a quite stable and reliable grid operation worldwide.

Wind turbine generator technical characteristics, which are mainly fixed and variable speed induction generators, doubly fed induction generators and synchronous generators with back to back converters, are very different to those of the conventional generators. As the installation of WPPs, which consist of these wind turbine generators, has reached important levels that they have a major impact on the characteristics of the transmission system..

Coughlan, Smith, Mullane & O’Malley (2007):

Renewable energy generation systems are being connected in increasing numbers to power systems worldwide. Of the commercially available systems, wind-turbine generators (WTGs) using non-synchronous-based technology are proving most successful. Unlike the synchronous machine whose operating characteristics have been documented and understood for decades, the generation of bulk ac electricity using non-synchronous machine-based generators is a relatively new phenomenon.

The effects of large penetrations of non-synchronous machine-based generators on power system stability have not been thoroughly studied. This problem is most serious in smaller power systems such as the Republic of Ireland, which have very large proportions of installed wind capacity compared to conventional generation and limited interconnection capability. Such systems are likely to experience possible stability issues related to wind generation, earlier than larger systems having lower proportions of installed wind generation..

..The level of wind turbine modelling detail required for power system stability studies remains an area where there is as yet not widespread agreement. This issue is complicated by the large number of wind turbine designs, the requirement for models in different time-frames, and the application of the model. As the end users of wind turbine models have predominantly been power system operators and due to the general lack of power system analysis expertise on the part of the wind turbine manufacturers, the wind turbine model development process has also proved cumbersome. Models are developed on behalf of manufacturers by third parties and supplied to system operators for use.

As many of the turbine models are not yet mature, system operators have acted as model testers reporting model bugs, irregularities, and errors and often advising manufacturers on appropriate action. Remedial action is then often relayed to third parties who make the necessary software changes.

Zhao & Nair (2010):

Renewable energy generation systems are being increasingly connected to power system networks worldwide. Among all commercially available systems, wind turbine generators (WTGs) using non-synchronous-based technology are being used predominantly. Unlike the traditional synchronous machine whose operating characteristics have been understood for decades, electricity generation using induction machine-based wind generators is relatively recent. In order to allow for the continued penetration of wind generation into electricity networks in the absence of operational experience, dynamic models of WTG have become more important for carrying out stability studies..

.. However, it is generally observed during large-scale wind integration studies that the so-called ‘standard’ components of the wind turbine models are quite often not standardised among manufacturers. Further during simulations, more detailed individual models (i.e. manufacturer-specific models) are used for analysis. The non-disclosure of the model details makes it very difficult to diagnose problems using simulation results. Considerable effort is needed to reproduce the model in a case containing no confidential data..

..Unlike conventional synchronous generators, where injection tests can be employed to test the unit response during a grid disturbance, a wind farm does not provide this option. Utilities rely solely on the WTGs model to determine how they would react to system dynamics, and therefore, the accuracy and validity of the model is important. To date, a very few number of wind turbine generator field test results are published..

..The validation of user-written models with field measurements needs careful planning and preparation, which includes obtaining permission from authorities, the power system operator and the wind turbine manufacturer. Disturbances which the wind turbines and the power system network can be subjected to are often limited. For example, it is not always easy to obtain permission to execute a balanced three-phase short-circuit fault in the transmission network, even though the results of such experiments would be highly valuable for validating the dynamic wind turbine model.

[Emphasis added].

Hansen & Michalke (2007):

Today, the wind turbines on the market mix and match a variety of innovative concepts with proven technologies for both generators and power electronics. The main trend of modern wind turbines/wind farms is clearly the variable-speed operation and a grid connection through a power converter interface.

Two variable-speed wind turbine concepts have a substantial predominance on the market today. One of them is the variable-speed wind turbine concept with partial-scale power converter, known as the doubly fed induction generator (DFIG) concept. The other is the variable-speed wind turbine concept with full-scale power converter and synchronous generator. These two variable-speed wind turbine concepts compete against each other on the market, with their more or less weak and strong features.

Nowadays, the most widely used generator type for units above 1 MW is the doubly fed induction machine. Presently, the primordial advantage of the DFIG concept is that only a percentage of power generated in the generator has to pass through the power converter. This is typically only 20–30% compared with full power (100%) for a synchronous generator-based wind turbine concept, and thus it has a substantial cost advantage compared to the conversion of full power

It seems that many national grid codes have been revised, and also that many people are studying the subject. Zhao & Nair compared wind farm models with reality under a line fault and found quite a discrepancy. However, in that case reality was a lot better than the model predicted, which is obviously a good thing.

A key question is what level of wind power the network can support before “curtailment”. Garrigle, Deane & Leahy (2013) discussed some scenarios in Ireland given that the current system non-synchronous penetration (SNSP) is set by the grid operator at 60%, but might be lifted to 75%.

You might think that a 60% limit on windpower means wind can achieve a penetration of 60% – pretty good, right?

But no. Remember that wind power is an intermittent resource. If wind power was like a conventional “dispatchable” generation source you would keep increasing wind farms and the output would rise up to 60% and then there would be no more wind farms built (until such time as the wind farm electrical characteristics were improved, or other methods of improving grid stability had been introduced).

Taking an extreme counter-example just for the purposes of illustration – imagine that some of the time there is zero wind, and the rest of the time all the wind-farms are running at 100%. And let’s say that the average output is 40% of nameplate capacity – i.e., we have no wind 60% of the time and lots of wind 40% of the time. Let’s say the country needs 5GW continuously and the government target to come from wind power is 40%, or 2GW on average. If we have 5GW of “nameplate” windpower capacity that implies that we can produce our target of 2GW.

However, the grid requires curtailment of any “non-synchronous” source above 60%. So in fact, from 5GW nameplate we will be producing 5GW x 60% for 40% of the time and 0 for the remainder. The result is an output of only 1.2GW, not 2GW – i.e., 24% of the national output instead of 40% of the national output.

Under this extreme scenario, it is impossible to produce the required 40% of national output from windpower.

Of course, this scenario is not reality. But the challenge remains – when the grid requires curtailment the limitation has a greater effect than we might first think.

Garrigle et al studied the effect of wind power curtailment under a variety of scenarios (including a certain amount of offshore wind power, currently a lot more expensive than onshore but less correlated to onshore wind power):

The primary result from this work is an estimate of the required installed wind capacities for both NI [Northern Ireland] and ROI [Republic of Ireland] to meet their 2020 RES-E targets. It is evident that this varies greatly due to the large differences in wind curtailment that will occur based on the assumptions made.

The required capacity estimates range from 5911 MW to 6890 MW which results in extra cost of c. € 459 million between what is considered to be the lowest technically feasible wind curtailment scenario (high offshore wind at SNSP limit of 75%, including TCGs) to that of the highest (low offshore wind at SNSP limit of 60%, including TCGS)

In the context of the electricity system this is a considerable extra expense similar in magnitude to the cost of two of the proposed North-South interconnector between NI and ROI. This illustrates the importance of increasing the SNSP limit as high as technically and economically feasible.

There were also dependencies on the interconnection to the rest of Great Britain. The way to think about this is:

  • can you export power to another country when you produce “too much”?
  • if that other country is also producing significant power from the same source (windpower in this example) how correlated is their output to yours?

Grid interconnections aren’t cheap. And if Great Britain is producing peak windpower at the same time as NI/ROI is producing peak windpower then the interconnections are of no benefit for that particular case.

Articles in this Series

Renewable Energy I – Introduction

Renewables II – Solar and Free Lunches – Solar power

Renewables III – US Grid Operators’ Opinions – The grid operators’ concerns

Renewables IV – Wind, Forecast Horizon & Backups – Some more detail about wind power – what do we do when the wind goes on vacation

Renewables V – Grid Stability As Wind Power Penetration Increases

Renewables VI – Report says.. 100% Renewables by 2030 or 2050

Renewables VII – Feasibility and Reality – Geothermal example

Renewables VIII – Transmission Costs And Outsourcing Renewable Generation

Renewables IX – Onshore Wind Costs

Renewables X – Nationalism vs Inter-Nationalism

Renewables XI – Cost of Gas Plants vs Wind Farms

Renewables XII – Windpower as Baseload and SuperGrids

Renewables XIII – One of Wind’s Hidden Costs

Renewables XIV – Minimized Cost of 99.9% Renewable Study

Renewables XV – Offshore Wind Costs

Renewables XVI – JP Morgan advises

Renewables XVII – Demand Management 1

Renewables XVIII – Demand Management & Levelized Cost

Renewables XIX – Behind the Executive Summary and Reality vs Dreams

References

Wind Turbine Modelling for Power System Stability Analysis—A System Operator Perspective, Coughlan, Smith, Mullane & O’Malley, IEEE Transactions on Power Systems (2007)

Assessment of wind farm models from a transmission system operator perspective using field measurements, S. Zhao N.-K.C. Nair, IET Renewable Power Generation (2010)

Fault ride-through capability of DFIG wind turbines, Anca Hansen & Gabriele Michalke, Renewable Energy (2007)

How much wind energy will be curtailed on the 2020 Irish power system? EV Mc Garrigle, JP Deane & PG Leahy, Renewable Energy (2013)

Overview of Recent Grid Codes for Wind Power Integration, Altin, Göksu, Teodorescu, Rodriguez, Jensen & Helle, 12th International Conference on Optimization of Electrical and Electronic Equipment (2010)

Read Full Post »

For some countries – cold, windy ones like England – wind power appears to offer the best opportunity for displacing GHG-emitting electricity generation. In most developed countries renewable electricity generation from hydro is “tapped out” – i.e., there is no opportunity for developing further hydroelectric power.

There’s a lot of confusion about wind power. Some of this we looked at briefly in earlier articles.

Nameplate & Actual

The nameplate is not what anyone (involved in the project) is expecting to get out of it.

So if you buy “10GW” of wind farms you aren’t expecting 10 GW x 8,760 (thanks to DeWitt Payne for updating me on how many hours there are in a year) = 87.6 TWh of annual electricity generation. Depending on the country, the location, the turbines and turbine height you will get an “average utilization”. In the UK that might be something like 30%, or even a little higher. So for 10GW of wind farms – everyone (involved in the project) is expecting something like 26 TWh of annual electricity generation (10 x 8760 x 0.3 / 1000).

We could say, on average the wind farm will produce 3GW of power. That’s just another way of writing 26 TWh annually. So 10GW of nameplate wind power does not need “10 GW of backup” or “7 GW of backup”. Does it need “3GW of backup”? Let’s look at capacity credit.

Just before we do, if you are new to renewables, whenever you see statements, press releases and discussions about “X MW of wind power being added” check whether it is nameplate power or actual expected power. Often it is secondarily described in terms of TWh or GWh – this is the actual energy expected over the year from the wind farm or project.

Capacity Credit

The capacity credit is the “credit” the operator gives you for providing “capacity” when it is in most demand. Operators have peaks and troughs in demand. There are lots of ways of looking at this, here is one example from Gross et al 2006, showing the time of day variation of demand for different seasons in the UK. We can see winter is the time of peak demand:

From Gross et al 2006

From Gross et al 2006

Figure 1

If you have a nuclear power station it probably runs 90% of the time. Some of the off-line time is planned outages for maintenance, upgrades, replacement of various items. Some of the off-line time is unplanned outages, where the grid operator gets 10 minutes notice that “sorry Sizewell B is going off line, can’t chat now, have a great day”, taking out over 1GW of capacity. So the capacity credit for nuclear reflects the availability and also the fact that the plant is “dispatchable” – apart from unplanned outages it will run when you want it to run.

The grid of each country (or region within a country) is a system. Because all of the generation within most of the UK is connected together, Sizewell B doesn’t need to be backed up with its own 1GW of coal-fired power stations. All you need is to have sufficient excess capacity to cope with peak demand given the likelihood of any given plant(s) going off line.

It’s a pool of resources to cope with:

  • a varying level of demand, and
  • a certain amount of outage from any given resource

Wind is “intermittent” (likewise for solar). So you can’t dispatch it when you need it. Everyone (involved in producing power, planning power, running the grid) knows this. Everyone (“”) knows that sometimes the wind turns off.

If you add lots of wind power – let’s say a realistic 3GW of wind, from 10GW of nameplate capacity – the capacity credit isn’t 90% of 3GW like you get for a nuclear power station. It is a lot smaller. This reflects the fact that at times of peak demand there might be no wind power (or almost no wind power). However, wind does have some capacity credit.

This is a statistical calculation – for the UK, the winter quarter is used to calculate capacity credit (because it is the time of maximum demand). The value depends on the wind penetration, that is, how much energy is expected from the wind from that period. For low penetrations of wind, say 500 MW, you get full capacity credit (capacity credit = 500MW). For higher penetrations it changes. Let’s say wind power provides 20% of total demand. Total demand averages about 40GW in the UK so wind power would be producing an average 8GW. For significant penetrations of wind power you get a low percentage of the output as capacity credit. The value is calculated from the geographical spread and statistical considerations, and it might be 10-20% of the expected wind power. Let’s say 8GW of output power (averaged over the year) gets 0.8GW – 1.6GW of “capacity credit”.

This means that when calculating how much aggregate supply is available windpower gets a tick in the box for 0.8GW – 1.6GW (depending on the calculation of credit). This is true even though there are times when the wind power is zero. How can it get capacity credit above zero when sometimes its power is zero? Because it is a statistical availability calculation. How can Sizewell B get a capacity credit when sometimes it has an unplanned outage? We can’t rely on it either.

The point is, hopefully it is clear, sorry for laboring it – when the wind is zero, Sizewell B and another 60GW of capacity are probably available. (If it’s not clear, please ask, I’m sure I can paint a picture with an appropriate graph or something).

Low Capacity Credit Doesn’t Mean Low Benefit – And What We Do About Low Capacity Credit

Let’s say the capacity credit for wind was zero, just for sake of argument. Even then, wind still has a benefit (it has a cost as well). Its benefit comes from the fact that the marginal cost of energy is zero (neglecting O&M costs). And the GHG emissions are zero from all the energy produced. It has displaced GHG-emitting electricity generation.

What we do about the low capacity credit is we add – or retain – GHG-emitting conventional backup. The grid operator, or the market (depends on the country in question), has the responsibility/motivation to provide backup. Running a conventional station less often, and keeping a station part running, but not at full load – these reduce efficiency.

Let’s say we produce 70 TWh of electricity from wind (20% of UK electricity requirement of 350 TWh). Wonderful. We have displaced 70 TWh of GHG emitting power. But we haven’t. We have kept some GHG emitting power stations “warmed up” or “operational at part load” and so we might have displaced 65 TWh or 60 TWh (or some value) of GHG emitting power stations because we ran the conventional generators less efficiently than before.

We will look at the numbers in a later article.

So wind has benefit even though it is not “dispatchable”, even though sometimes at peak demand it produces zero energy.

Statistics of Wind and Forecast Time Horizons

Let’s suppose that even though wind is not “dispatchable” we had a perfect forecast of wind speeds around the region for the next 12 months. This would mean we could predict the power from the wind turbines for every hour of the day for the next 365 days.

In this imaginary case, power plant could be easily scheduled to be running at the right times to cover the lack of wind power. We could make sure that major plants did not have outages in the periods of prolonged low wind speeds. The efficiency of our “backup” generation would be almost as perfect as before wind power was introduced. So if we produced 70 TWh of wind energy we would displace just about 70 TWh of conventional GHG emitting generation. We would also probably need less excess capacity in the system because one area of uncertainty had been removed.

Of course we don’t have that. But at the same time, our forecast horizon is not zero.

The unexpected variability of wind changes with the time horizon we are concerned about. Let’s put it another way, if we are getting 1.5 GW from all of our wind farms right now, the chance of it dropping to 0 GW 10 minutes from now is very small. The chance of it being 0 GW 1 hour from now is quite small. But the chance of it being 0 GW in 4 hours might be quite a bit higher.

I hope readers are impressed with the definitive precision with which I nailed the actual probabilities there..

There are many dependencies – the location of the wind farms (the geographical spread), the actual country in question and the season and time of day under consideration.

We’ve all experienced the wind in a location dropping to nothing in an instant. But as you install more turbines over a wider area the output variance over a given time period reduces. A few graphs from Boyle (2007) should illuminate the subject.

Here is a comparison of 1 hour changes between a single wind farm and half of Denmark:

Boyle 2010 Denmark hourly change single vs all

Figure 2

Here is a time-series simulation of a given 1000MW capacity in one location (single farm) vs that same capacity spread across the UK:

Boyle 2010 Wind power single vs distributed

Figure 3

Here is an example from the actual output of the wind power network in Germany:

From Boyle 2010

Figure 4

At some stage I will dig out some more recent actuals. The author of that chapter comments:

Care should be taken in drawing parallels, however, between experiences in Germany and Denmark and the situation elsewhere, such as in the UK. Wind conditions over the whole British electricity supply system should be assumed to be different unless proved otherwise. Differences in latitude and longitude, the presence of oceans, as well as the area covered by the wind power generation industry make comparisons difficult. The British wind industry, for example, has a longer north–south footprint than in Denmark, while in Germany the wind farms have a strong east–west configuration.


Here is an example from Gross et al (2006) of variations across 1, 2 and 4 hours:

From Gross et al 2006

From Gross et al 2006

Figure 5

Here’s another breakdown of how the UK wind output varies, this time as a probability distribution:

Boyle 2010 PD of wind power in UK

Figure 6

In another paper on the UK, Strbac et al 2007:

Standard deviations of the change in wind output over 0.5hr and 4hr time horizons were found to be 1.4% and 9.3% of the total installed wind capacity, respectively. If, for example, the installed capacity of wind generation is 10 GW (given likely locations of wind generation), standard deviations of the change in wind generation outputs were estimated to be 140 MW and 930 MW over the 0.5-h and 4-h time horizons, respectively.

What this means for a grid operator is that predictability changes with the time horizon. This matters because their job is to match supply and demand and if the wind is going to be high, less conventional stations are needed to be “warmed up”. If the wind is going to be low, more conventional stations are needed. But if we didn’t know anything in advance – that is, if we could get anything between 0GW to 10GW with just 30 minutes notice – it would present a much bigger problem.

Closing the Gate, Spinning Reserves and Frequency

The grid operator has to match supply and demand (see note for an extended extract on how this works).

Demand varies, but must be met – except for some (typically) larger industrial customers who have agreed contracts to turn off their plant under certain conditions, such as when demand is high.

The grid operator has a demand forecast based on things like “reviewing the past” and as a result enters into contracts for the hour ahead for supply. This is the case in the UK. Other countries have different rules and time periods, but the same principles apply: the grid operator “closes the gate”. To me this is not an intuitive term because he/she has contracts for flexible supply and reserves – in case demand is above what is expected or contracted plant goes offline. So gate closure means the contract position is fixed for the next time period.

However, the actual problem is to meet demand and to do this flexible plant is up and running and part loaded. Some load matching is done automatically. This happens via frequency. If you increase the load on the system the frequency starts to fall. Reserve plant increases its output automatically as the frequency falls (and the converse). This is how the very short term supply-demand matching takes place.

So the uncertainty about the wind output over the next hour is the key for the UK grid operator. It is a key factor in changing the cost of reserves as wind power penetration increases. If the gate closure was for the next 12 hours it should be clear that the cost to the grid operator of matching supply and demand would increase – given that the uncertainty about wind is higher the longer the time period in question.

Whether one hour or 12 hours gate closure makes a huge difference in overall cost of supply is likely a very complicated one, and not one I expect we can uncover easily, or at all. The market mechanism in the UK is around the 1 hour gate closure and so suppliers have all creating pricing models based on this.

Grid Stability – SNSP and Fault Ride-Through

System Non-Synchronous Penetration (SNSP) and fault ride-through capability are important for wind power. Basically wind power has different characteristics from existing conventional plant and has the potential to bring the grid down. We will look at the important question of what wind power does to the stability of the grid in a subsequent article.

Articles in this Series

Renewable Energy I – Introduction

Renewables II – Solar and Free Lunches – Solar power

Renewables III – US Grid Operators’ Opinions – The grid operators’ concerns

Renewables IV – Wind, Forecast Horizon & Backups – Some more detail about wind power – what do we do when the wind goes on vacation

Renewables V – Grid Stability As Wind Power Penetration Increases – Brief simplified discussion of Fault ride-through and System Non-Synchronous Penetration (SNSP)

Renewables VI – Report says.. 100% Renewables by 2030 or 2050

Renewables VII – Feasibility and Reality – Geothermal example

Renewables VIII – Transmission Costs And Outsourcing Renewable Generation

Renewables IX – Onshore Wind Costs

Renewables X – Nationalism vs Inter-Nationalism

Renewables XI – Cost of Gas Plants vs Wind Farms

Renewables XII – Windpower as Baseload and SuperGrids

Renewables XIII – One of Wind’s Hidden Costs

Renewables XIV – Minimized Cost of 99.9% Renewable Study

Renewables XV – Offshore Wind Costs

Renewables XVI – JP Morgan advises

Renewables XVII – Demand Management 1

Renewables XVIII – Demand Management & Levelized Cost

Renewables XIX – Behind the Executive Summary and Reality vs Dreams

References

Renewable Electricity and the Grid : The Challenge of Variability, Godfrey Boyle, Earthscan (2007) – textbook

The Costs and Impacts of Intermittency: An assessment of the evidence on the costs and impacts of intermittent generation on the British electricity network, Gross et al, UK Energy Research Centre (2006) – free research paper

Impact of wind generation on the operation and development of the UK electricity systems, Goran Strbac, Anser Shakoor, Mary Black, Danny Pudjianto & Thomas Bopp, Electric Power Systems Research (2007)

Notes

Extract from Gross et al 2006 explaining the UK balancing in a little detail – the whole document is free and well-worth spending the time to read:

The supply of electricity is unlike the supply of other goods. Electricity cannot be readily stored in large amounts and so the supply system relies on exact second-by-second matching of the power generation to the power consumption. Some demand falls into a special category and can be manipulated by being reduced or moved in time.

Most demand, and virtually all domestic demand, expects to be met at all times.

It is the supply that is adjusted to maintain the balance between supply and demand in a process known as system balancing.

There are several aspects of system balancing. In the UK system, contracts will be placed between suppliers and customers (with the electricity wholesalers buying for small customers on the basis of predicted demand) for selling half hour blocks of generation to matching blocks of consumption. These contracts can be long standing or spot contracts.

An hour ahead of time these contract positions must be notified to the system operator which in Great Britain is National Grid Electricity Transmission Limited. This hour-ahead point (some countries use as much as twenty-four hour ahead) is known as gate closure.

At gate closure the two-sided market of suppliers and consumers ceases. (National Grid becomes the only purchaser of generation capability after gate closure and its purpose in doing so is to ensure secure operation of the system.) What actually happens when the time comes to supply the contracted power will be somewhat different to the contracted positions declared at gate closure. Generators that over or under supply will be obliged to make good the difference at the end of the half hour period by selling or buying at the system sell price or system buy price. Similar rules apply to customers who under or over consume.

This is known as the balancing mechanism and the charges as balancing system charges. This resolves the contractual issues of being out-of- balance but not the technical problems.

If more power is consumed than generated then all of the generators (which are synchronised such that they all spin at the same speed) will begin to slow down. Similarly, if the generated power exceeds consumption then the speed will increase. The generator speeds are related to the system frequency. Although the system is described as operating at 50 Hz, in reality it operates in a narrow range of frequency centred on 50 Hz. It is National Grid’s responsibility to maintain this frequency using “primary response” plant (defined below). This plant will increase or decrease its power output so that supply follows demand and the frequency remains in its allowed band. The cost of running the primary response plant can be recovered from the balancing charges levied on those demand or supply customers who did not exactly meet their contracted positions. It is possible that a generator or load meets its contract position by consuming the right amount of energy over the half hour period but within that period its power varied about the correct average value. Thus the contract is satisfied but the technical issue of second-by-second system balancing remains..

..Operating reserve is generation capability that is put in place following gate closure to ensure that differences in generation and consumption can be corrected. The task falls first to primary response.

This is largely made up of generating plant that is able to run at much less than its rated power and is able to very quickly increase or decrease its power generation in response to changes in system frequency. Small differences between predicted and actual demand are presently the main factor that requires the provision of primary response. There can also be very large but infrequent factors that need primary response such as a fault at a large power station suddenly removing some generation or an unpredicted event on TV changing domestic consumption patterns.

The primary response plant will respond to these large events but will not then be in a position to respond to another event unless the secondary response plant comes in to deal with the first problem and allow the primary response plant to resume its normal condition of readiness. Primary response is a mixture of measures. Some generating plant can be configured to automatically respond to changes in frequency. In addition some loads naturally respond to frequency and other loads can be disconnected (shed) according to prior agreement with the customers concerned in response to frequency changes.

Secondary response is normally instructed in what actions to take by the system operator and will have been contracted ahead by the system operator. The secondary reserve might be formed of open-cycle gas-turbine power stations that can start and synchronise to the system in minutes. In the past in the UK and presently in other parts of the world, the term spinning reserve has been used to describe a generator that is spinning and ready at very short notice to contribute power to the system. Spinning reserve is one example of what in this report is called primary response. Primary response also includes the demand side actions noted in discussing system frequency..

Read Full Post »

In Part I we had a brief look at the question of intermittency – renewable energy is mostly not “dispatchable”, that is, you can’t choose when it is available. Sometimes wind energy is there at the right time, but sometimes when energy demand is the highest, wind energy is not available.

The statistical availability depends on the renewable source and the country using it. For example, solar is a pretty bad solution for England where the sun is a marvel to behold on those few blessed days it comes out (we all still remember 1976 when it was more than one day in a row), but not such a bad solution in Texas or Arizona where the peak solar output often arrives on days when peak electricity demand hits – hot summer days when everyone turns on their air-conditioning.

The question of how often the renewable source is available is an important one, but is a statistical question.

Lots of confusion surrounds the topic. A brief summary of reality:

  1. The wind does always blow “somewhere”, but if we consider places connected to the grid of the country in question the wind will often not be blowing anywhere, or if it is “blowing” the output of the wind turbines will be a fraction of what is needed. The same applies to solar. (We will look at details of the statistics in later articles).
  2. The fact that at some times of peak demand there will be little or no wind or solar power doesn’t mean it provides no benefit – you simply need to “backup” the wind / solar with a “dispatchable” plant, i.e. currently a conventional plant. If you are running on wind “some of the time” you are displacing a conventional plant and saving GHG emissions, even if “other times” you are running with conventional power. A wind farm doesn’t need “a dedicated backup”, that is the wrong way to think about it, instead there needs to be sufficient “dispatchable” resources somewhere in the grid available for use when intermittent sources are not running.
  3. The costs and benefits are the key and need to be calculated.

However, the problem of intermittency depends on many factors including the penetration of renewables. That is, if you produce 1% of the region’s electricity from renewables the intermittency problem is insignificant. If you produce 20% it is significant and needs attention. If you produce 40% from renewables you might have a difficult problem. (We’ll have a look at Denmark at some stage).

Remember (or learn) that grid operators already have to deal with intermittency – power plants have planned and, even worse, unplanned outages. Demand moves around, sometimes in unexpected ways. Grid operators have to match supply and demand otherwise it is a bad outcome. So – to some extent – they have to deal with this conundrum.

What do grid operators think about the problem of integrating intermittent renewables, i.e., wind and solar into the grid? It’s always instructive to get the perspectives of people who do the actual work – in this case, of balancing supply and demand every day.

Here’s an interesting (free) paper: The intermittency of wind, solar, and renewable electricity generators: Technical barrier or rhetorical excuse? Benjamin K. Sovacool. As always I recommend reading the paper for yourself. Here is the abstract:

A consensus has long existed within the electric utility sector of the United States that renewable electricity generators such as wind and solar are unreliable and intermittent to a degree that they will never be able to contribute significantly to electric utility supply or provide baseload power. This paper asks three interconnected questions:

  1. What do energy experts really think about renewables in the United States?
  2. To what degree are conventional baseload units reliable?
  3. Is intermittency a justifiable reason to reject renewable electricity resources?

To provide at least a few answers, the author conducted 62 formal, semi-structured interviews at 45 different institutions including electric utilities, regulatory agencies, interest groups, energy systems manufacturers, nonprofit organizations, energy consulting firms, universities, national laboratories, and state institutions in the United States.

In addition, an extensive literature review of government reports, technical briefs, and journal articles was conducted to understand how other countries have dealt with (or failed to deal with) the intermittent nature of renewable resources around the world. It was concluded that the intermittency of renewables can be predicted, managed, and mitigated, and that the current technical barriers are mainly due to the social, political, and practical inertia of the traditional electricity generation system.

Many comments and opinions from grid operators are provided in this interesting paper. Here is one from California:

Some system operators state that the intermittence of some renewable technologies greatly complicates forecasting. David Hawkins of the California Independent Systems Operator (ISO) notes that:

Wind, for instance, can be forecasted and has predictable patterns during some periods of the year. California uses wind as an energy resource but it has a low capacity factor for meeting summer peak-loads. The total summer peak-load is 45,000 MW of load, but in January daily peak-loads are 29,000 MW, meaning that 16,000 MW of our system load is weather sensitive. In the winter and spring months, big storms come into California which creates dramatic changes in wind. We have seen ramps as large as 800 MW of wind energy increases in 30 min, which can be quite challenging“.

..A report from the California ISO found that relying on wind energy excessively complicated each of the five types of forecasts. As the study concluded, ‘‘although wind generator output can be forecast a day in advance, forecast errors of 20–50% are not uncommon’’

And a little later:

For instance, California Energy Commissioner Arthur Rosenfeld comments that:

Germany had to build a huge reserve margin (close to 50 percent) to back up its wind. People show lots of pictures of wind turbines in Germany, yet you never see the standby power plants in the picture. This is precisely why utilities fear wind: the cost per kWh of wind on the grid looks good only without the provision of large margins of standby power“.

Thomas Grahame, a senior researcher at the U.S. Department of Energy’s Office of Fossil Fuels, comments that:

‘‘when intermittent sources become a substantial part of the electricity generated in a region, the ability to integrate the resource into the grid becomes considerably more complex and expensive. It might require the use of electricity storage technologies, which will add to cost. Additionally, new transmission lines will also be needed to bring the new power to market. Both of these add to the cost’’

The author looks at issues surrounding conventional unplanned outages, at the risks and costs involved in the long cycle of building a new plant plus getting it online – versus the rapid deployment opportunities with wind and solar.

I’m aware of various studies that show that up to 20% wind is manageable on a grid, but above that issues may arise (e.g. Gross et al., 2006). There are, of course, large numbers of studies with many different findings – my recommendation for placing any study in context is first ask “what percentage of renewable penetration was this study considering”. (There are many other questions as well – change the circumstances and assumptions and your answers are different).

The author of this paper is more convinced that any issues are minor and the evidence all points in one direction:

Perhaps incongruously, no less than nine studies show that the variability of renewables becomes easier to manage the more they are deployed (not the other way around, as some utilities suggest). In one study conducted by the Imperial College of London, researchers assessed the impact that large penetration rates (i.e., above 20 percent) of renewable energy would have on the power system in the United Kingdom. The study found that the benefits of integrating renewables would far exceed their costs, and that ‘‘intermittent generation need not compromise electricity system reliability at any level of penetration foreseeable in Britain over the next 20 years.’’ Let me repeat this conclusion for emphasis: renewable energy technologies can be integrated at any level of foreseeable penetration without compromising grid stability or system reliability.

Unfortunately, there was no reference provided for this.

Claiming that the variability of renewable energy technologies means that the costs of managing them are too great has no factual basis in light of the operating experience of renewables in Denmark, Germany, the United Kingdom, Canada, and a host of renewable energy sites in the United States.

As I commented earlier I recommend readers interested in the subject to read the whole paper instead of just my extracts. It’s an interesting and easy read.

I can’t agree that the author has conclusively, or even tentatively, demonstrated that wind & solar (intermittent renewables) can be integrated into a grid to any arbitrary penetration level.

In fact most of the evidence cited in his paper is at penetration levels of 20% or less. Germany is cited because the country “is seeking to generate 100 percent of its electricity from renewables by 2030”, which doesn’t quite stand as evidence (and it would be uncharitable to comment on the current coal-fired power station boom in Germany). Denmark I would like to look at in a later article – is it a special case, or has it demonstrated the naysayers all to be wrong? We will see.

The penetration level is the key, combined with the technology and the country in question. It’s a statistical question. Conceptually it is not very difficult. Analyze meteorological data and/or actuals for wind and solar power generation in the region in question over a sufficiently long time and produce data in the format required for different penetration levels:

  • minimums at times of peak demand
  • length of time power from X MW capacity is below Y% of X MW capacity & how often this occurs & as a function of peak demand times
  • ..and so on

This does mean – it should be obvious – that each region and country will get different answers with different technologies. Linking together different regions with sufficient redundant transmission capacity is also not trivial, neither is “adding sufficient storage”.

If the solution to the problem is an un-costed redundant transmission line, we need to ask how much it will cost. The answer might be surprisingly high to many readers. If the solution to the problem is “next-generation storage” then the question is “will your solution work without this next-generation storage and what specification & cost are required?”

Of course, I would like to suggest another perspective to keep in mind with the discussion on renewables: the sunk cost of the existing power generation, transmission and distribution network is extremely high, and more than a century of incremental improvement and dispersion of knowledge and practical experience has led us to today – with obviously much lower marginal costs of using and expanding conventional power. But, we are where we are. What I hope to shed some light on in this series is what renewables actually cost, what benefits they bring and what practical difficulties exist in expanding renewables.

The author concludes:

Conventional power systems suffer variability and reliability problems, just to a different degree than renewables. Conventional power plants operating on coal, natural gas, and uranium are subject to an immense amount of variability related to construction costs, short-term supply and demand imbalances, long term supply and demand fluctuations, growing volatility in the price of fuels, and unplanned outages.

Contrary to proclamations stating otherwise, the more renewables that get deployed, the more – not less – stable the system becomes. Wind- and solar-produced power is very effective when used in large numbers in geographically spaced locations (so the law of averages yields a relative constant supply).

The issue, therefore, is not one of variability or intermittency per se, but how such variability and intermittency can best be managed, predicted, and mitigated.

Given the preponderance of evidence referenced here in favor of integrating renewables, utility and operator objections to them may be less about technical limitations and more about tradition, familiarity, and arranging social and political order.

The work and culture of people employed in the electricity industry promote ‘‘business as usual’’ and tend to culminate in dedicated constituencies that may resist change.

Managers of the system obviously prefer to maintain their domain and, while they may seek increased efficiencies and profits, they do not want to see the introduction of new and disruptive ‘‘radical’’ technologies that may reduce their control over the system.

In essence, the current ‘‘technical’’ barriers to large-scale integration of wind, solar, and other renewables may not be technical at all, and more about the social, political, and practical inertia of the traditional electricity generation system.

I’ve never met a grid operator, but I have worked with many people in technical disciplines in a variety of fields – in operations, production, maintenance, technical support, engineering and design. This includes critical infrastructure and the fields include process plants, energy, telecommunications networks, as well as private and municipal. You get a mix of personality types. Faced with a new challenge some relish the opportunity (more skills, more employable, promotion & pay opportunities, just the chance to learn and do something new). Others are reluctant and resist.

The author of the paper didn’t have so many doubts about this subject – other studies have concluded it will all work fine so the current grid operators are trapped in the past.

If I was asking lots of people in the field doing the actual job about the technical feasibility of a new idea and they unanimously said it would be a real problem, I would be concerned.

I would be interested to know why grid operators in the US that the author interviewed are resistant to intermittent renewables. Perhaps they understand the problem better than the author. Perhaps they don’t. It’s hard to know. The evidence Sovacool brings forward includes the fact that grid operators currently have to deal with unplanned outages. I suspect they are aware of this problem more keenly than Sovacool because it is their current challenge.

Perhaps US grid operators think there are no real technical challenges but expect that no one will pay for the standby generation required. Or they have an idea what the system upgrade costs are and just expect that this is a cost too high to bear. It’s not clear from this paper. I did peruse his PhD thesis that this paper was drawn from but didn’t get a lot more enlightenment.

However, it’s an interesting paper to get some background on the US grid.

References

The intermittency of wind, solar, and renewable electricity generators: Technical barrier or rhetorical excuse? Benjamin K. Sovacool, Utilities Policy (2009)

Articles in this Series

Renewable Energy I – Introduction

Renewables II – Solar and Free Lunches – Solar power

Renewables III – US Grid Operators’ Opinions – The grid operators’ concerns

Renewables IV – Wind, Forecast Horizon & Backups – Some more detail about wind power – what do we do when the wind goes on vacation

Renewables V – Grid Stability As Wind Power Penetration Increases

Renewables VI – Report says.. 100% Renewables by 2030 or 2050

Renewables VII – Feasibility and Reality – Geothermal example

Renewables VIII – Transmission Costs And Outsourcing Renewable Generation

Renewables IX – Onshore Wind Costs

Renewables X – Nationalism vs Inter-Nationalism

Renewables XI – Cost of Gas Plants vs Wind Farms

Renewables XII – Windpower as Baseload and SuperGrids

Renewables XIII – One of Wind’s Hidden Costs

Renewables XIV – Minimized Cost of 99.9% Renewable Study

Renewables XV – Offshore Wind Costs

Renewables XVI – JP Morgan advises

Renewables XVII – Demand Management 1

Renewables XVIII – Demand Management & Levelized Cost

Renewables XIX – Behind the Executive Summary and Reality vs Dreams

Read Full Post »

[Later note, Sep 2015, it’s clear – as can be seen in the later comments that follow the article – there is a difference between a number of papers that cannot be explained by ‘improved efficiencies in manufacturing’ or ‘improved solar-electricity conversion efficiencies’. The discrepancies are literally one group making a large mistake and taking “energy input” to be electricity input rather than fuel to put into power stations to create electricity – or the reverse. I suspect that the paper I highlight below is making the mistake, in which case this article is out by a factor of 3 against solar being a free lunch. In due course, I will try to fight through all the papers again to get to the bottom of it. I also have not been able to confirm that any of the papers really account for building all the new factories that manufacture the solar panels (instead perhaps they are just considering the marginal electricity use to make each solar cell).]

There are lots of studies of the energy and GHG input into production of solar panels. I’ve read some and wanted to highlight one to look at some of the uncertainties.

Lu & Yang 2010 looked at the energy required to make, transport and install a (nominal) 22 KW solar panel on a roof in Hong Kong – and what it produced in return. Here is the specification of the module (the system had 125 modules):

Lu & Wang 2010 - Solar panel details

For the system’s energy efficiency, the average energy efficiency of a Sunny Boy inverter is assumed 94%, and other system losses are assumed 5%.

This is a grid-connected solar panel – that is, it is a solar panel with an inverter to produce the consumer a.c. voltage, and excess power is fed into the grid. If it had the expensive option of battery storage so it was self-contained, the energy input (to manufacture) would be higher (note 1).

For stand-alone (non-rooftop) systems the energy used in producing the structure becomes greater.

Here’s the pie chart of the estimated energy consumed in different elements of the process:

From Lu & Yang (2010)

From Lu & Yang (2010)

A big part of the energy is consumed in producing the silicon, with a not insignificant amount for slicing it into wafers. BOS = “balance of system” and we see this is also important. This is the mechanical structure and the inverter, cabling, etc.

The total energy per meter squared:

  • silicon purification and processing – 666 kWh
  • slicing process – 120 kWh
  • fabricating PV modules – 190 kWh
  • rooftop supporting structure – 200 kWh
  • production of inverters – 33 kWh
  • other energy used in system operation and maintenance, electronic components, cables and miscellaneous – 125 kWh

Transportation energy use turned out pretty small as might be expected (and is ignored in the total).

Therefore, the total energy consumed in producing and installing the 22 kW grid-connected PV system is 206,000 kWh, with 29% from BOS, and 71% from PV modules.

What does it produce? Unfortunately the data for the period is calculated not measured due to issues with the building management system (the plan was to measure the electrical production, however, it appears some data points have been gathered).

Now there’s a few points that have an impact on solar energy production. This isn’t comprehensive and is not from their paper:

  • Solar cells rated values are taken at 25ºC, but when you have sunlight on a solar cell, i.e., when it’s working, it can be running at a temperature of up to 50ºC. The loss due to temperature is maybe 12 – 15% (I am not clear how accurate this number is).
  • Degradation per year is between 0.5% and 1% depending on the type of silicon used (I don’t know how reliable these numbers are at 15 years out)
  • Dust reduces energy production. It’s kind of obvious but unless someone is out there washing it on a regular basis you have some extra, unaccounted losses.
  • Inverter quality

Obviously we need to calculate what the output will be. Most locations, and Hong Kong is no exception, have a pretty well-known solar W/m² at the surface. The angle of the solar cells has a very significant impact. This installation was at 22.5º – close to the best angle of 30º to maximize solar absorption.

Lu & Yang calculate:

For the 22 kW roof-mounted PV system, facing south with a tilted angle of 22.5, the annual solar radiation received by the PV array is 266,174 kWh using the weather data from 1996 to 2000, and the annual energy output (AC electricity) is 28,154 kWh. The average efficiency of the PV modules on an annual basis is 10.6%, and the rated standard efficiency of the PV modules from manufacturer is 13.3%. The difference can be partly due to the actual higher cell operating temperature.

The energy output of the PV system could be significantly affected by the orientations of the PV modules. Therefore, different orientations of PV arrays and the corresponding annual energy output are investigated for a similar size PV system in Hong Kong, as given in Table 3. Obviously, for the same size PV system, the energy output could be totally different if the PV modules are installed with different orientations or inclined angles. If the 22 kW PV system is installed on vertical south-facing facade, the system power output is decreased by 45.1% compared that of the case study.

So the energy used will be returned in approximately 7.3 years.

Energy in = 206 MWh. Energy out = 28 MWh per year.

Location Location

Let’s say we put that same array on a rooftop in Germany, the poster-child for solar takeup. The annual solar radiation received by the PV array is about 1000 KWh per m², about 60% of the value in HK (note 2).

Energy in = 206 MWh. Energy out in Germany = 15.8 MWh per year (13 years payback).

I did a quick calculation using 13.3% module efficiency (rated performance at 25ºC), a 15% loss due to the high temperature of the module being in the direct sunlight (when it is producing most of its electricity), an inverter & cabling efficiency of 90% and a 0.5% loss per year of solar efficiency. Imagine no losses from dust. Here is the year by year production – assumes 1000 kWhr solar radiation annually and 150 m² PV cells:

Screen Shot 2015-08-02 at 6.10.33 pm

Screen Shot 2015-08-02 at 6.14.11 pm

Here we get to energy payback at end of year 14.

I’m not sure if anyone has done a survey of the angle of solar panels placed on residential rooftops but if the angle is 10º off its optimum value we will see very roughly something towards a 10% loss in efficiency. Add in some losses for dust (pop quiz – how many people have seen residents cleaning their solar panels on the weekend?) What’s the real long term energy efficiency of a typical economical consumer solar inverter? It’s easy to see the energy payback moving around significantly in real life.

Efficiency Units – g CO2e / kWh and Miles per Gallon

When considering the GHG production in generating electricity, there is a conventional unit – amount of CO2 equivalent per unit of electricity produced. This is usually grams of CO2 equivalent (note 3) per KWh (a kilowatt hour is 3.6 MJ, i.e., 1000J per second for 3,600 seconds).

This is a completely useless unit to quote for solar power.

Imagine, if you will, the old school (new school and old school in the US) measurement of car efficiency – miles per gallon. You buy a Ford Taurus in San Diego, California and it gets you 28 miles per gallon. You move to Portland, Maine and now it’s doing 19 miles per gallon. It’s the exact same car. Move back to San Diego and it gets 28 miles per gallon again.

You would conclude that the efficiency metric was designed by ..

I’m pretty sure my WiFi router uses just about the same energy per GBit of data regardless of whether I move to Germany, or go and live at the equator. And equally, even though it is probably designed to sit flat, if I put it on its side it will still have the same energy efficiency to within a few percent. (Otherwise energy per GBit would not be a useful efficiency metric).

This is not the case with solar panels.

With solar panels the metric you want to know is how much energy was consumed in making it and where in the world most of the production took place (especially the silicon process). Once you have that data you can consider where in the world this technology will sit, at what angle, the efficiency of the inverter that is connected and how much dust accumulates on those beautiful looking panels. And from that data you can work out the energy efficiency.

And from knowing where in the world it was produced you can work out, very approximately (especially if it was in China) how much GHGs were produced in making your panel. Although I wonder about that last point..

The key point on efficiency in case it’s not obvious (apologies for laboring the point):

  • the solar panel cost = X KWh of electricity to make – where X is a fixed amount (but hard to figure out)
  • the solar panel return = Y KWhr per year of electricity – where Y is completely dependent on location and installed angle (but much easier to figure out)

The payback can never be expressed as g CO2e/KWh without stating the final location. And the GHG reduction can never be expressed without stating the manufacturing location and the final location.

Moving the Coal-Fired Power Station

Now let’s consider that all energy is not created equally.

Let’s suppose that instead of the solar panel being produced in an energy efficient country like Switzerland, it’s produced in China. I can find the data on electricity production and on GHG emissions but China also creates massive GHG emissions from things like cement production so I can’t calculate the GHG efficiency of their electricity production. And China statistics have more question marks than some other places in the world. Maybe one of our readers can provide this data?

Let’s say a GHG-conscious country is turning off efficient (“efficient” from a conventional fossil-fuel perspective) gas-fired power stations and promoting solar energy into the grid. And the solar panels are produced in China.

Now while the energy payback stays the same, the GHG payback might be moving to the 20 year mark or beyond – because 1 KWh “cost” came from coal-fired power stations and 1 KWh return displaced energy from gas-fired power stations. Consider the converse, if we have solar panels made in an (GHG) energy efficient country and shipped to say Arizona (lots of sun) to displace coal-fired power it will be a much better equation. (I have no idea if Arizona gets energy from coal but last time I was there it was very sunny).

But if we ship solar panels from China to France to displace nuclear energy, I’m certain we are running a negative GHG balance.

Putting solar panels in high latitude countries and not considering the country of origin might look nice – and it certainly moves the GHG emissions off your country’s balance sheet – but it might not be as wonderful as many people believe.

It’s definitely not free.

Other Data Points

How much energy is consumed in producing the necessary parts?

This is proprietary data for many companies.

Those very large forward-thinking companies that might end up losing business if important lobby groups took exception to their business practices, or if a major government black-listed them, have wonderful transparency. A decade or so ago I was taken on a tour through one of the factories of a major pump company in Sweden. I have to say it was quite an experience. The factory workers volunteer to take the continual stream of overseas visitors on the tour and all seem passionate about many aspects including the environmental credentials of their company – “the creek water that runs through the plant is cleaner at the end than when it comes into the plant”.

Now let’s picture a solar PV company which has just built its new factory next to a new coal-fired power station in China. You are the CEO or the marketing manager. An academic researcher calls to get data on the energy efficiency of your manufacturing process. Your data tells you that you consume a lot more power than the datapoints from Siemens and other progressive companies that have been published. Do you return the call?

There must be a “supplier selection” bias given the data is proprietary and providing the data will lead to more or less sales depending on the answer.

Perhaps I am wrong and the renewables focus of countries serious about reducing GHGs means that manufacturers are only put on the approved list for subsidies and feed-in tariffs when their factory has been thoroughly energy audited by an independent group?

In a fairly recent paper, Peng et al (2013) – whose two coauthors appear to be the same authors of this paper we reviewed – noted that mono-silicon (the solar type used in this study) has the highest energy inputs. They review a number of studies that appear to show significantly better energy paybacks. We will probably look at that paper in a subsequent article, but I did notice a couple of interesting points.

Many studies referenced are from papers from 15 years ago which contain very limited production data (e.g. one value from one manufacturer). They comment on Knapp & Jester (2001) who show much higher values than other studies (including this one) and comment “The results of both embodied energy and EBPT are very high, which deviate from the previous research results too much.” However, Knapp & Jester appeared to be very thorough:

This is instead a chiefly empirical endeavor, utilizing measured energy use, actual utility bills, production data and complete bill of materials to determine process energy and raw materials requirements. The materials include both direct materials, which are part of the finished product such as silicon, glass and aluminum, and indirect materials, which are used in the process but do not end up in the product such as solvents, argon, or cutting wire, many of which turn out to be significant.

All data are based on gross inputs, fully accounting for all yield losses without requiring any yield assumptions. The best available estimates for embodied energy content for these materials are combined with materials use to determine the total embodied and process energy requirements for each major step of the process..

..Excluded from the analysis are (a) energy embodied in the equipment and the facility itself, (b) energy needed to transport goods to and from the facility, (c) energy used by employees in commuting to work, and (d) decommissioning and disposal or other end-of-life energy requirements.

Perhaps Knapp & Jester got much higher results because their data was more complete? Perhaps they got much higher results because their data was wrong. I’m suspicious.. and by the way they didn’t include the cost of building the factory in their calculations.

A long time ago I worked in the semiconductor industry and the cost of building new plants was a lot higher than the marginal cost of making wafers and chips. That was measured in $ not kWh so I have no idea on the fixed/marginal kHr cost of making semiconductors for solar PV cells.

Conclusion

One other point to consider, the GHG emissions of solar panels all occur at the start. The “recovered” GHG emissions of displaced conventional power are year by year.

Solar power is not a free lunch even though it looks like one. There appears to be a lot of focus on the subject so perhaps more definitive data in the near future will enable countries to measure their decarbonizing efforts with some accuracy. If governments giving subsidies for solar power are not getting independent audits of solar PV manufacturers they should be.

In case some readers think I’m trying to do a hatchet job on solar, I’m not.

I’m collecting and analyzing data and two things are crystal clear:

  • accurate data is not easily obtained and there may be a selection bias with inefficient manufacturers not providing data into these studies
  • the upfront “investment” in GHG emissions might result in a wonderful payback in reduction of long-term emissions, but change a few assumptions, especially putting solar panels into high-latitude energy-efficient countries, and it might turn out to be a very poor GHG investment

Articles in this Series

Renewable Energy I – Introduction

Renewables II – Solar and Free Lunches – Solar power

Renewables III – US Grid Operators’ Opinions – The grid operators’ concerns

Renewables IV – Wind, Forecast Horizon & Backups – Some more detail about wind power – what do we do when the wind goes on vacation

Renewables V – Grid Stability As Wind Power Penetration Increases

Renewables VI – Report says.. 100% Renewables by 2030 or 2050

Renewables VII – Feasibility and Reality – Geothermal example

Renewables VIII – Transmission Costs And Outsourcing Renewable Generation

Renewables IX – Onshore Wind Costs

Renewables X – Nationalism vs Inter-Nationalism

Renewables XI – Cost of Gas Plants vs Wind Farms

Renewables XII – Windpower as Baseload and SuperGrids

Renewables XIII – One of Wind’s Hidden Costs

Renewables XIV – Minimized Cost of 99.9% Renewable Study

Renewables XV – Offshore Wind Costs

Renewables XVI – JP Morgan advises

Renewables XVII – Demand Management 1

Renewables XVIII – Demand Management & Levelized Cost

Renewables XIX – Behind the Executive Summary and Reality vs Dreams

References

Environmental payback time analysis of a roof-mounted building-integrated photovoltaic (BIPV) system in Hong Kong, L. Lu, H.X. Yang, Applied Energy (2010)

Review on life cycle assessment of energy payback and greenhouse gas emission of solar photovoltaic systems, Jinqing Peng, Lin Lu & Hongxing Yang, Renewable and Sustainable Energy Reviews (2013)

Empirical investigation of energy payback time for photovoltaic modules, Knapp & Jester, Solar Energy (2001)

Notes

Note 1: I have no idea if it would be a lot higher. Many people are convinced that “next generation” battery technology will allow “stand-alone” solar PV. In this future scenario solar PV will not add intermittancy to the grid and will, therefore, be amazing. Whether or not the economics mean this is 5 years away or 50 years away, note to the enthusiasts to check the GHG used in the production of these (future) batteries.

Note 2: The paper didn’t explicitly give the solar cell area. I calculated it from a few different numbers they gave and it appears to be 150m², which gives an annual average surface solar radiation of 1770 KWh/m². Consulting a contour map of SE Asia shows that this value might be correct. For the purposes of the comparison it isn’t exactly critical.

Note 3: Putting of 1 tonne of methane into the atmosphere causes a different (top of atmosphere) radiation change from 1 tonne of CO2. To make life simpler, given that CO2 is the primary anthropogenic GHG, all GHGs are converted into “equivalent CO2”.

Read Full Post »