Recap
In Part I and IV – Wind, Forecast Horizon & Backups we looked at a few basics, including capacity credit which is basically how much “credit” the grid operator gives you for being there. If you are a 1GW coal-fired power station you probably get around 850MW – 900MW capacity credit. This reflects the availability that your power generation offers. The grid operator needs to ensure the region or country can meet the demand in any given second, minute, hour, day, week, month and year.
And so the grid operator’s calculation is a statistical one – given a “fleet” (always a strange name to me for such immobile units) of generating units how can we be sure that we can meet demand in every minute of the year? Conventional generation (gas, coal, nuclear) is mostly “dispatchable” – which means that, apart from unexpected outages, you can choose to run the gas plant or nuclear power station when you want.
Wind power, on the other hand, is not dispatchable. And it turns out that its capacity credit, as a proportion of actual capacity, reduces significantly as its penetration into the network increases. Another way of saying it is that wind is less reliable than conventional generation at any given point in time and this problem gets worse the more wind power you have available.
However, this doesn’t present some insuperable obstacle to using wind. What it means at the moment in various countries is that you can use windpower when the wind is blowing, and when it’s not blowing (or not much) you can crank up a gas plant. As wind power penetration grows in a given network the variability of this ever larger power source must result in less efficiency of the conventional units operating at part load or in reserve. Everyone agrees on this point. However, in this series so far we have not reviewed any actual papers or data on the loss of efficiency – something to look forward to.
Baseload Power
On a different point – the focus of this article – the intermittency of windpower raises an important question, especially as it is the cheapest source of renewable energy (given that hydro is “tapped out” in most developed countries).
Is it possible to generate base load power from wind?
If not, then there is clearly a limit to the growth of wind power. (We have already covered some real problems of high wind power penetration in V – Grid Stability As Wind Power Penetration Increases – those problems haven’t gone away). This is related to the question of the maximum reduction in GHG emissions from electricity generation while “keeping the lights on”.
Generally we can think of increasing wind power in a region as creating a benefit and a problem:
- the benefit – more wind power usually means more geographical dispersion which averages out peaks and troughs (see IV – Wind, Forecast Horizon & Backups)
- the problem – more wind power means peaks and troughs cause more problems for the grid (a 100MW unforecast fluctuation over a few hours is easily dealt with in most countries, but a 5GW unforecast fluctuation is more problematic)
So.. on with this article..
In Czisch & Ernst (2001), the authors consider a massive area wind power network. I don’t believe this paper is a complete answer because some questions are unanswered, but the idea is instructive.
As they state:
Europe currently has by far the highest installed wind power capacity of all regions in the world. However, this is not due to Europe being the best possible place to build wind power, but rather to a favourable political climate
It is a slightly different take on the question I asked in X – Nationalism vs Inter-Nationalism – why is Germany building windfarms in Germany instead of places with lots of wind?
In the graph below “Full Load Hours/Year” is basically a way of showing capacity factor (not to be confused with capacity credit). Capacity factor is average output/nameplate and depends how much wind you get – across the UK capacity factor is just over 30%, in Germany it is around 18%, in Oklahoma, maybe 41%.
In this genre of papers it’s common to dispense with the crazy idea of percentages – who can understand them? Instead of percentages, let’s use the much more intuitive idea of the output expressed as if the wind farm ran at full load for x number of hours in the year. So 2100 full load hours = the old school 24% (2100/8760)..
Anyway, via color coding (which at least follows a familiar pattern), we see why Ireland and the north of the UK has a windfarm advantage, along with European and African coastal regions:
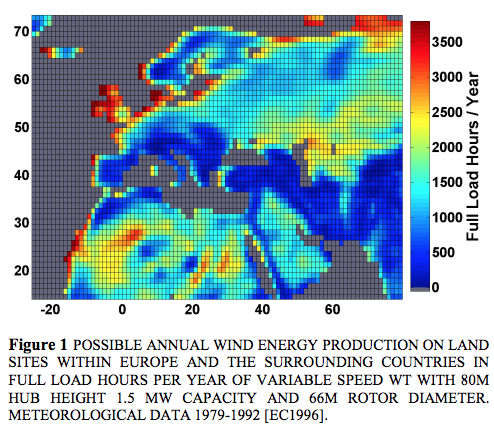
From Czisch & Ernst 2001
Figure 1
The data above is based on wind speeds taken from reanalysis data (from ECMWF). “Reanalysis” is basically a blend of data and models filling in the blanks where data doesn’t exist. (See Water Vapor Trends under the sub-heading “Filling in the Blanks”).
Then they look at the correlation between different sites, based on actual measurements.
For people new to wind power, a low correlation is good. A high correlation is bad. Why? If you have 1000x 3MW wind turbines and the correlation of output power between the turbines is high then they will be producing 3GW some of the time, 1.5GW some of the time, and 0GW some of the time – their output power rises and falls in unison. If the correlation is low then they will be producing (for example) 1GW nearly all of the time – this is clearly much better – as one turbine slows down, another speeds up.
Low correlation implies sustained output. High correlation implies big peaks and troughs.
As we might expect – as the turbines get further apart their output power correlation reduces = good. For example, the wind in London is well correlated with the wind in Reading, England (60km apart), but not well correlated with the wind in Moscow (2,500 km apart).
And for any given geographical separation the correlation is higher (=bad) as we consider longer time periods. This is also expected. There might be considerable minute to minute fluctuation between two sites due to the turbulent nature of wind, but the average across 12 hours will be more correlated because the overall weather patterns cover bigger areas:
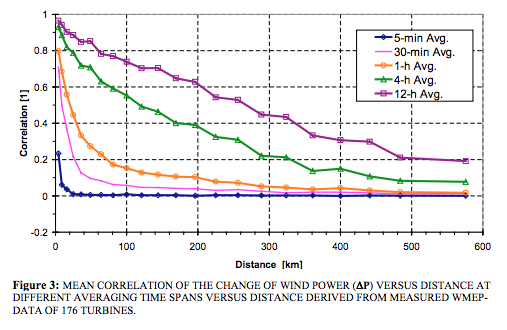
From Czisch & Ernst 2001
Figure 2
Super Grids
Now let’s look at longer time periods and longer distances (I don’t understand the dots in this graph):
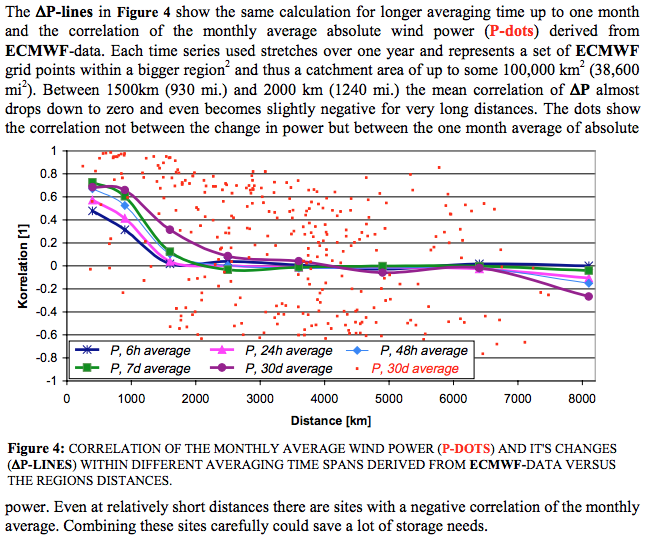
From Czisch & Ernst 2001
Figure 3
The paper goes on to select the best regions, place large hypothetical wind farms in those regions and calculate the wind farm output:
The potentials described in the above section altogether make a capacity of nearly 950 GW and close to 2800 TWh annual electricity production. This is more than the total demand of the EU countries plus Norway which was 2100 TWh in 1997. The average production exceeds 2900 full load hours.
Electricity consumption in the EU has increased a fair bit since 1997 – EU consumption in 2014 was about 2800 TWh (which for reference is about 320GW continuously) – I’m not sure if this represents economic growth, adding countries to the EU or both.
But the regions that they propose have more than sufficient wind to meet much higher output. The population density is low and wind potential is high in the regions they select. Unlike the places where most European wind power is being built at the moment (with high population density and low wind speeds).
The key lines in the graph are the red line = demand and the black line = supply for one scenario:
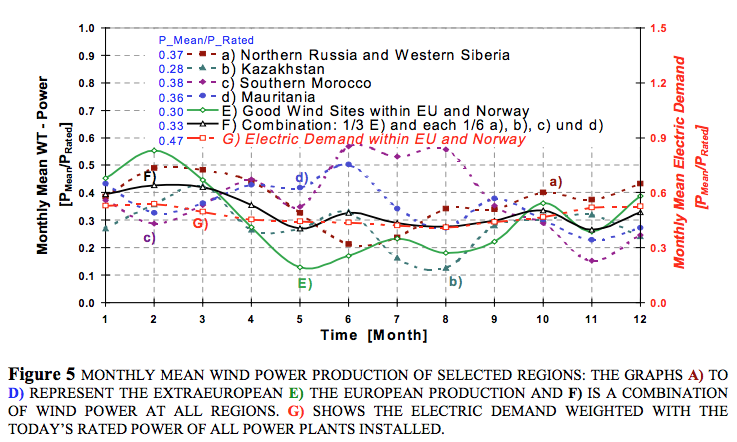
From Czisch & Ernst 2001
Figure 4
Discussion
To me their paper doesn’t quite complete the picture. They provide some more insights, including transmission and storage requirements, and propose providing baseload power but not peak power for the whole of the EU. Given the potential wind power in the regions they select it’s not clear what limits actually exist.
The questions seem straightforward:
- For a given scenario (nameplate per region) produce the usual graph of hourly output, not as a time-series, but in declining output order (e.g. fig 6 below), so we can see for how many hours the output drops below key values
- Calculate the actual nameplate capacity needed in the various production regions to ensure “Loss of Load Probability” (LOLP) below the standard 9 years per century (or some other metric)
Armed with this data we would be able to see the number of wind turbines required and the transmission requirements between each region. And what, if any, pumped hydro storage would be needed in addition. And what, if any, conventional backup generation would be needed.
In a scenario with wind power producing a large portion of EU energy any problems get amplified.
For example – and this is just my example – if we built a wind network to supply say 320GW it might be a nameplate capacity of 900GW (something like 450,000 wind turbines of 2MW). But if our analysis showed that individual regions at any given time would be supplying most of the load, the nameplate capacity of the whole system might need to be 3TW (1,500,000 wind turbines). If the system instead had gas power as a backup for say 10% of the time when the wind “super-system” dropped well below the demand, the fuel cost would be relatively low, but the construction cost would be very high for the power supplied – because we would have built 300GW of supply to run just 10% of the time.
Some of these ideas are taken up by other papers.
In Archer & Jacobson (2007) the authors look at the statistics of wind energy across 19 sites in the midwest of the USA:
In this study, benefits of interconnecting wind farms were evaluated for 19 sites, located in the Midwestern United States, with annual average wind speeds at 80 m above ground, the hub height of modern wind turbines, greater than 6.9 m/s (class 3 or greater). We found that an average of 33% and a maximum of 47% of yearly-averaged wind power from interconnected farms can be used as reliable, baseload electric power.

From Archer & Jacobson 2007
Figure 5
Unfortunately, their description of “reliable baseload power” indicates they are “having a laugh” – let’s hope they didn’t really mean it.
After noting the problem of intermittency of wind power they state:
On the other hand, because coal combustion can be controlled, coal energy is not considered intermittent and is often used as “baseload” energy. Nevertheless, because coal plants were shut down for scheduled maintenance 6.5% of the year and unscheduled maintenance or forced outage for another 6% of the year on average in the United States from 2000-2004, coal energy from a given plant is guaranteed only 87.5% of the year, with a typical range of 79-92% (NERC 2005, Giebel 2000).
And in their wind power analysis they are then content when their hypothetical system meets this 79% threshold, given that is the (minimum) benchmark for one coal-fired power station. Hopefully readers of this series can see the problem with this threshold. Grid operators provide baseload power by combining multiple units of dispatchable power. No one is under the illusion that one coal-fired power station is nirvana. This was probably true even 100 years ago in England. Grid operators provide some statistical inevitability of keeping the lights on by using more than one power station.
The real question we want to answer is whether combining ever more distant wind farms can actually provide baseload power to meet grid operator requirements and therefore replace a network of conventional power stations. And how many turbines in each of how many locations, what transmission capacity, and so on.
The key curves are given below, with the blue curve being the key one representing the combination of 19 sites, with output power placed in decreasing order. As we can see, moving from 1 to 7 to 19 sites increases our minimum output:

From Archer & Jacobson 2007
Figure 6
It’s a useful graph. In this example we would put up 19 wind farms in a wide area, with the furthest extremes separated by almost 900 km. And for 90% of the year we would get more than 13% of the nameplate output. And for 95% of the year we would get more than 10% of the output.
So does that mean we should build nameplate capacity at 10x our required demand, and provide gas plants to match demand for the 2½ weeks a year that the wind farms can’t keep up?
It’s half an answer, like the earlier paper we reviewed. At least it gives us the graph we need to see (figure 6, their figure 3) for this specific geographical distribution.
Conclusion
Baseload electric power is not an optional extra – unless the population decides to vote for it, which seems unlikely. It does seem possible that the right combination of wind farms across a super-grid might be a solution for most of the EU’s energy needs. It needs to be evaluated in more detail and costed.
If the statistics of wind power variability make this solution a possible contender, then the costs will be a minimum of $1-5TN plus transmission costs. Perhaps $2-10TN. Perhaps more. I’m just trying to get a broad idea of the cost.
For the EU this is not such a large amount. Germany has already spent more than €40BN just to get 10% of electricity from wind power.
If the EU is serious about decarbonizing electricity generation then putting up wind turbines in Germany and central Europe – instead of investigating a European super-grid capitalizing on the best regions – is possibly a monumental failure of policy (maybe this subject has already been discussed and discarded).
Articles in this Series
Renewable Energy I – Introduction
Renewables II – Solar and Free Lunches – Solar power
Renewables III – US Grid Operators’ Opinions – The grid operators’ concerns
Renewables IV – Wind, Forecast Horizon & Backups – Some more detail about wind power – what do we do when the wind goes on vacation
Renewables V – Grid Stability As Wind Power Penetration Increases
Renewables VI – Report says.. 100% Renewables by 2030 or 2050
Renewables VII – Feasibility and Reality – Geothermal example
Renewables VIII – Transmission Costs And Outsourcing Renewable Generation
Renewables IX – Onshore Wind Costs
Renewables X – Nationalism vs Inter-Nationalism
Renewables XI – Cost of Gas Plants vs Wind Farms
Renewables XII – Windpower as Baseload and SuperGrids
Renewables XIII – One of Wind’s Hidden Costs
Renewables XIV – Minimized Cost of 99.9% Renewable Study
Renewables XV – Offshore Wind Costs
Renewables XVI – JP Morgan advises
Renewables XVII – Demand Management 1
Renewables XVIII – Demand Management & Levelized Cost
Renewables XIX – Behind the Executive Summary and Reality vs Dreams
References
High wind power penetration by the systematic use of smoothing effects within huge catchment areas shown in a European example, Czisch & Ernst, Windpower (AWEA), 2001
Supplying baseload power and reducing transmission requirements by interconnecting wind farms, CL Archer & MZ Jacobson, Journal of Applied Meteorology and Climatology (2007)


FYI, there was a study in 2010 in PNAS on the Capacity Factor of an hypothetical array off-shore wind parks along the USA east coast covering thousands of miles [Kempton et al., 2010]. They specifically wanted to investigate the effect of synoptic scale weather on wind energy generation.
http://www.pnas.org/content/107/16/7240.full
One of the things that struck me is that even for such an array of wind parks covering thousands of miles, the time dependent behavior of the Capacity Factor of all wind parks combined still showed periods of several days (and longer) with hardly any generation of wind power (CF << 10%). To me this suggests that although "the wind always blows somewhere" you generally will not be able to harvest energy where the wind blows as your wind parks are not situated there – unless you start to install wind parks everywhere, which appears to be practically impossible.
Anyhow, the paper might be an interesting additional resource for your analysis.
Jos,
This is a very interesting paper with a better presentation (for our needs) than Czisch & Ernst.
It confirms a similar story. Even extending from Maine to the Keys still gives low power days. This is using offshore sites, which generally have better, more persistent wind. (And offshore is still an “experimental technology”, as the wind turbines work, but the equipment lifetime/maintenance costs are still “all at sea”).
Here’s the map:
Here’s the output curve (compare with figure 6 in the article of a smaller US region – Czisch & Ernst didn’t provide one for their European supergrid):
Here’s the histogram of capacity factor:
Here’s the timeseries with red triangles marking the times of less than 5% CF (click graph to expand):
And here’s a focus (left) on a problem time period:
So we can see a pretty good dataset from the hypothetical array.
There’s one point missing for me, which we can almost see in the data, but it’s not quite explicit.
The graph of “maximum length of time power drops below CF” vs CF. This is important – we are surely aiming to produce “almost baseload” power from wind.
Say that CF is below 10% for 4% of the time – which is what I see from fig S3.
If that 4% is all in one continuous time period then we need a set of conventional power stations to fire up and run for that 4% of time. This might be a good solution – because they will be quite efficient, even if very under-utilized. And the forecast of this drop in power will probably be quite good – maybe 12 or 24 hours ahead (see Part IV).
If that 4% is made up of lots of sub 1-hour periods then storage might be a viable solution.
Lastly, the question still remains, is there a wider supergrid where CF never drops below 10% and only drops below 20% for short periods.
The paper makes similar points as I’ve made earlier about the advantages of regions working together rather than a “state by state” windpower solution. It also, like Archer & Jacobson, compares the availability of its hypothetical wind farm with a conventional power station. Again, wrong comparison.
SoD,
“Lastly, the question still remains, is there a wider supergrid where CF never drops below 10% and only drops below 20% for short periods.”
I don’t know if that is a useful question. For the U.S. east coast array in your post to be treated as a single source would require very expensive grid upgrades. I think the real question is when such “wind outages” occur. If at low demand times, they are easily dealt with. If at peak times, then they are a big problem.
Mike,
The idea is to see what can be done, and then some estimates of what it costs.
Of course, the question about low output also needs to be placed in the light of demand.
Generally the answer is low total output often coincides with high demand.
For example, the time of high demand in the UK is the winter. This is generally a windier time. But many periods of low wind also occur in the winter. The capacity credit calculations for wind usually focus on the high demand periods – in the UK they are calculated for the winter quarter.
Mike M. “I think the real question is when such “wind outages” occur. If at low demand times, they are easily dealt with. If at peak times, then they are a big problem.”
For the US East Coast the peak load high energy demand days are associated with hot and humid weather which in the worst cases are associated with high pressure systems. That means the wind outages do occur at peak times.
This series is very good – thank you!
SOD: “The capacity credit calculations for wind usually focus on the high demand periods – in the UK they are calculated for the winter quarter.”
That brings up an inconvenient aspect for those who claim the grid can be powered only by renewables. On the US East Coast the peak demand period is in the summer and solar PV helps. If you get away from fossil fuel for space heating then the peak demand period shifts to the winter and solar PV is not as helpful. For both the winter and summer peaks the energy demand is highest during high pressure systems and wind is not helpful.
Another very nice analysis. The issue of where to build turbines is one where politics interferes with reasoned choices; I don’t know how that can be resolved.
The investment to generate and distribute most electric power from wind (€5 trillion is about the middle of your estimate) represents €10000 per inhabitant of the EC. If you wanted to do this over a 20 year period, it would cost €500 per year per person. Considering the high prices already paid for electricity in Europe, adding that much more to the existing cost might be politically difficult.
The dispactability issue points once again to inexpensive storrage as the key to making wind power more affordable. If battery storage costs fell to under $0.10 per KWH, then dispatchability would become much less important. Seems to me that expenditures on battery development make more sense than subsidies for solar and wind power.
Smaller regions highlight the key problems of wind power. Excellent summary on key points from this paper:
Will British weather provide reliable electricity? Oswald, Raine & Ashraf-Ball, Energy Policy (2008):
In the developed world, dispatchable electricity from fossil fuels has made the supply of electricity is very elastic. Since most of the cost is fuel, increasing supply to meet demand Involves low variable operating cost. In a system where dispatchable generation is no longer capable of meeting demand, the supply of electricity will be very Inelastic at times. At those times, demand must be reduced by high prices or rationing. If demand is reduced by rising prices until it is equal to supply, the price could rise to equal the cost of stored electricity: pumped storage, batteries, etc. (In CA, the cost of electricity on peak demand days is rumored to be 10-fold normal.)
Presumably someone has properly explained this with supply/demand curves. Utilities report average supply cost for the month, not marginal cost at peak demand and minimum supply.
Demand is relatively inelastic – bu at any rate wholesale price signals do not penetrate to the consumer – who are charged at a standard rate. Wholesale prices vary considerably.
http://www.eia.gov/electricity/monthly/update/wholesale_markets.cfm
CH: When you combine an inelastic supply curve for energy from renewable sources with our current inelastic demand curve, they reach equilibrium at a high price (or you have rationing). One aspect of a “smart grid” is to deliver price signals to customers to reduce demand when the supply of renewable energy is low.
Smart metering is about reducing demand from less critical users during periods of inadequate supply. Supply and demand suggest that over the mid term markets will adjust supply and demand to equilibriate – high prices increase supply and reduce demand.
The two are totally different – and you are misusing the economic concepts to somehow justify a less reliable and more costly energy supply.
Are you suggesting that certain users can opt out of rationing by paying more? Power for the rich? Laughable nonsense.
The lack of supply at certain periods is the problem – not that we are not paying enough for it. Good power system design balances supply and load – with a >96% reliability – bad design does not.
“If the EU is serious about decarbonizing electricity generation then putting up wind turbines in Germany and central Europe – instead of investigating a European super-grid capitalizing on the best regions – is possibly a monumental failure of policy (maybe this subject has already been discussed and discarded).”
So what.
It still is a hopeless 3rd world energy system.
Is everybody blind?
The adults have moved on. “Renewables” is hydro period. The only alternative is nuclear, not the contemporary useless nuclear but very high temperature fission reactors that produce both heat and electricity.
RDG,
“The adults have moved on. “Renewables” is hydro period. The only alternative is nuclear, not the contemporary useless nuclear but very high temperature fission reactors that produce both heat and electricity.”
Who are these “adults”?
What is a “very high temperature fission reactor” and how does it differ from conventional nuclear reactors that produce both heat and electricity?
I am coming to the conclusion that wind is hopeless, thanks to SoD writing these articles and getting me to think about it. But it is hardly 3rd world technology – the 3rd world can’t afford it.
Solar PV has the potential to be helpful since it correlates with demand in the areas most favorable to it. But to really exploit solar PV would seem to require two breakthroughs: inexpensive multi-junction cells (or some other way to get much higher efficiency) and cost effective storage. There seems to be no fundamental barrier to either. I don’t see how we can seriously get away from fossil fuel without a major contribution from nuclear, presumably Generation IV reactors.
High temperature, small, modular, fast neutron reactors are the obvious future source of both electricity and liquid fuels.
Doesn’t need a supergrid at all. That alone more than halves the cost in Africa.
http://watertechbyrie.com/2015/06/06/safe-cheap-and-abundant-energy-back-to-the-nuclear-energy-future/
https://www.facebook.com/groups/1045711932120349/
This is an cool paper on a global electricity grid. If you do a search on the authors you can see many more they have written on the topic. In appendix A they offer cost estimates for long (>1000km) undersea HVDC cables. Worth reading for comparison to the calculations on this post.
By the way, if anyone has a good reference for the loss mechanisms and construction challenges of HVDC undersea cables, vs overhead, would love to read it.
“The Global Grid”, http://arxiv.org/pdf/1207.4096.pdf
Rob,
As a broad comparison, the data in appendix A indicates very roughly “about double” what I estimated from other papers of overhead lines HVDC costs – about $2BN per GW per 1000km.
Putting in redundant power should double both overhead and subsea. I don’t see many savings. You need two of everything for redundancy.
I’m sure there are costs that don’t scale linearly as power and distance goes up.
For example, with subsea you only need two sets of conversion regardless of distance. And with subsea your “installation cost” is probably similar regardless of 1GW or 5GW.
On the other hand, as you put in HVDC overland for a national or regional network, the number of “off-take points” might be high and each load center will need expensive conversion equipment. Tower costs and installation might increase disproportionately above certain weights (weight will be roughly proportional to GW transmitted).
SoD,
Why build an HVDC transmission line with multiple off-take points at all? That would seem to defeat the whole principle of HVDC transmission. You build one line from point A to point B and distribute with lower voltage AC lines from point B. Any point between A and B is probably better serviced with a shorter AC transmission line from point A.
DeWitt,
It’s just an economic calculation (but not simple).
If you generate 10GW and want to get 5GW to a center 500km away and the balance of 5GW a further 500km (total 1000km) you are definitely better to have a HVDC line with 2 conversion stations (plus at the generator site).
If you break that into 3 centers of about 3GW each separated by 300km you are still probably better off with HVDC.
At some point it becomes more economic to start using AC.
The economics are the conductor costs (better with HVDC), the losses (better with HVDC) and the conversion stations (worse with HVDC).
I’m thinking as well that the towers carry less weight with HVDC, not sure if that is a big factor, and not sure if I am double counting (“reduced losses” = same conductor, higher efficiency OR same efficiency, lighter conductor, less tower costs) – probably needs more than 2 minutes consideration..
I guess that assumes that the intermediate stations are along a reasonable approximation of a straight line between the generator and the final destination. That wouldn’t necessarily be the case for say, transmitting power from the midwest to the east or west coast of the US.
[…] « Renewables XII – Windpower as Baseload and SuperGrids […]
[…] “For people new to wind power, a low correlation is good. A high correlation is bad. Why? If you have 1000x 3MW wind turbines and the correlation of output power between the turbines is high then they will be producing 3GW some of the time, 1.5GW some of the time, and 0GW some of the time – their output power rises and falls in unison.” https://scienceofdoom.com/2015/09/19/renewables-xii-windpower-as-baseload-and-supergrids/ […]
There’s a great new paper just published by Nature that I will write about shortly:
Future cost-competitive electricity systems and their impact on US CO2 emissions
Alexander E. MacDonald, Christopher T. M. Clack, Anneliese Alexander, Adam Dunbar, James Wilczak and Yuanfu Xie, Nature Climate Change (2016)
The paper itself, due to Nature is only 4 pages, but the supplementary material is the real paper, and that is 70 pages.
Finally someone has looked at the entire US and worked out how to match supply and demand (hour by hour) with wind & solar (leaving existing hydro and nuclear in place) by using the entire country’s wind & solar resources and costing the transmission.
According to the paper it is practical and they claim, not a real change in cost from current cost of building conventional power. This seems hard to make sense of, given wind is more costly than gas in the US (with current gas prices) and there is a massive transmission project also required.
As always, we have to read the whole paper and find the assumptions and details to figure it out.
I’m betting they don’t include replacement costs for nuclear power plants. They live a long time, but not forever.