In IX – Onshore Wind Costs we looked at the capital and O&M costs of building onshore wind power. We stayed away from converting the numbers into “Levelized Cost of Energy”, or LCOE, because it obscures too much – instead we just tried to get a rough idea of the costs.
The data presented in the article was a little dated and one of our commenters pointed to more recent values (corrected my information) for capital cost which makes it very simple:
Capital cost of onshore wind farms = €1M per MW nameplate. (The article itself had €1.2M per MW).
For reference, right now €1 = US$1.13, but at times during the last 10 years the rate has been above $1.40.
What does it cost to build a gas plant? Once again I’ll use out-of-date values, this time because a great textbook from 2009 has some pretty good breakdowns. And as we’ll see, the capital cost is not so significant, it’s mostly about the fuel cost.
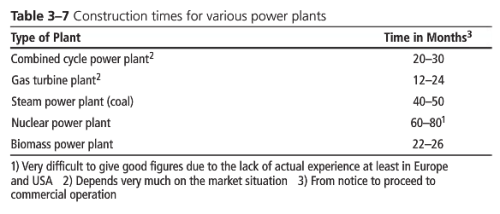
These days, combined cycle gas plants are the fashionable item to have. Their efficiency is very high and they are relatively quick to build – typically around 2 years.
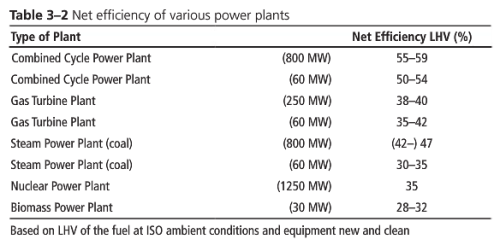
Figure 1 – From Kehlhofer et al 2009
The efficiency figures for the gas plant are output electrical energy at the high voltage transformer terminals / energy of input fuel.
Like onshore wind farms, combined-cycle gas plants are proven technology. You know they are going to work – in fact, many are built by EPCs (the costs we will look at are EPC costs) = “Engineering, Procurement & Construction” companies. You pay the money and the EPC gets the job done – a turnkey job. On commissioning they have to run the plant for x number of days or months at nameplate for the customer to sign off. Penalties and rewards apply. While I’m sure there are some sad stories out there, as in any industry – with competent management you will get a plant of a given efficiency, given operation costs and given construction costs.
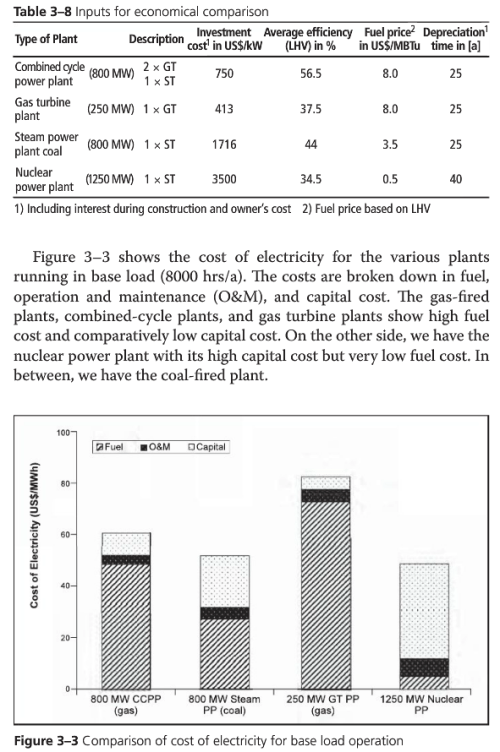
Here are some costs, for combined-cycle and other conventional technologies. We will focus on the other technologies another time (for example, the nuclear data is not reliable because so few have been built recently):
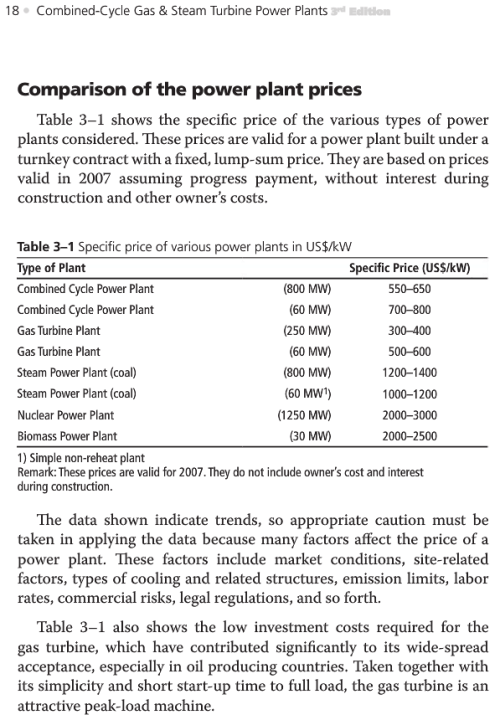
Figure 2
So the capital cost of the gas plant is about $0.6M per MW, versus something like $1.1M per MW for wind (at prevailing exchange rates). These are nameplate values. As we saw, the actual “capacity factor” of wind is dependent on where you plant it. Oklahoma might be 41%. Ireland might be 31%. Germany might be 18%.
On the other hand, gas plants can run almost as much as you want. For well-designed and operated plants we have these figures, where reliability gives you what you lose from unplanned problems, while availability gives you what you lose from unplanned and planned outages (these are necessary for upgrades & maintenance):
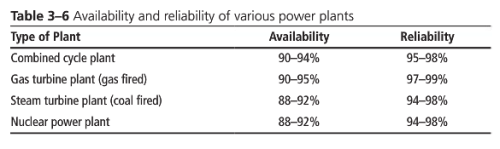
Figure 3
So let’s run with 90% availability for the gas plant.
Readers might wonder why some gas plants only run for 10% of the time – it’s not (usually) because they have been badly designed, it’s because those plants are designed as peaker plants, deliberately designed to run only when the spot price is high. You can’t store electricity, so at times of high demand and problems with general supply the spot price can be 10x the normal price (or much more). Some plants are designed to start up quickly, throw caution to the wind, grab the cash and turn off. They turn on a dime, so to speak.
And as we will see, the numbers don’t change that much if we chose 85% or even 80% availability. Of course, if you designed a combined-cycle gas plant to run as much as possible and you only achieved 80% availability year after year – you wouldn’t be doing a great job.
Let’s look at operations and maintenance costs. These conventional plant O&M costs have been broken up between “per MWh” costs and fixed annual costs. We saw with the wind farms that these two categories existed as well, but the numbers had all been converted into “per MWh” and we only had that to work with – a value around $14/MWh):
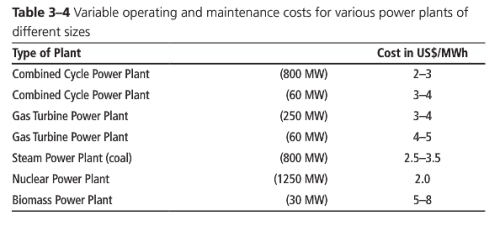
Figure 4
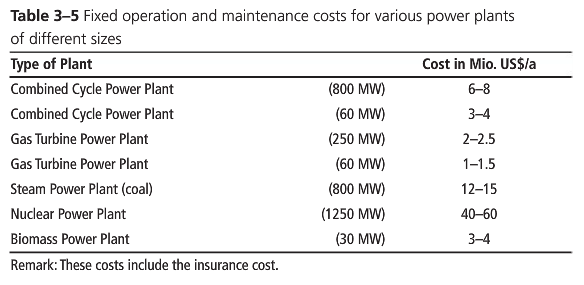
Figure 5
Comparing Combined Cycle Gas with Wind
Most discussions about “costs” throw out a number and the average reader can’t break it apart. If you are in one of the cheerleading squads this is excellent. Just pick your favorite LCOE quoted without any analysis, reference points, or clarity and “prove” your point. Hurray for my side!! We’re winning!!
Here, I will attempt to make it as clear as I can without equations (other than 1+1=2 and 10/2=5) how the costs compare.
Smaller gas plants are less efficient and have higher costs bases, and we are really interested in getting large amounts of power out of the door, so we are going to use the costs of the 800MW plant as the basis for our calculation (scaled up a little).
Let’s think about a reference 1GW plant.
For wind farms this means we have to think about where the wind farms will be located. For now, let’s think about Europe, which seems to average 25% capacity – that is, if you have 4GW of nameplate wind farm capacity you can expect over one year to average 1GW. (But note we’re using US currency). At the end, we will look at the magic of Oklahoma and what that does for our simple sums.
For the gas plant we will assume our 90% availability and so we need to build 1.1 GW of nameplate.
Now, a little conversion factor is necessary, if you produce 1GW (=power) for 1 hour you produce 1GWh (=energy), which is 1000MWh (=energy in different units). If you average 1GW of output and run for one year you produce (rounded up) 8.8M of these MWh (=8760 x 1000).
So both our wind farms and our gas plant are producing 8.8M “MWh” per year.
That’s so we can compare them.
Running Costs
Wind
- Fuel = $0 (nice)
- O&M = $14/MWh (can also be written as 1.4c/kWh) – from IX – Onshore Wind Costs
Combined-Cycle Gas
- Fuel = $ lots & lots
- O&M = fixed $10M + $2.50/MWh = $1.10/MWh (i.e., $10M/8.8M MWh) + $2.50 = $3.60/MWh
The fuel is easy to calculate (we’ll come to that), but obviously the cost depends on the gas price which fluctuates a lot. Here is the European and US price, over 7 years to end-2014:
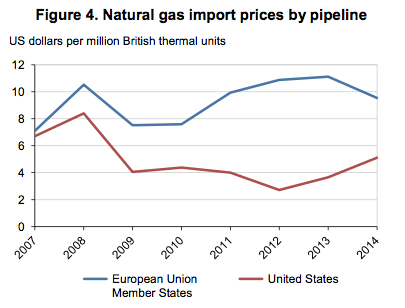
From IEA 2015
Figure 6
And the US price up to July 2015 (also in that strange British unit):
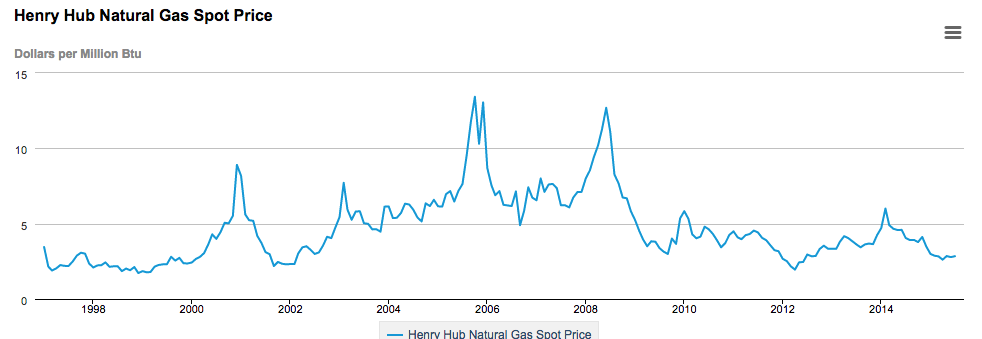
Source: IEA Henry Hub Prices
Figure 7
So we need a couple of reference points. We’ll pick $3, around the recent US price – and $10, the end-2014 European price.
Our favorite gas plant has an efficiency of 56.5% so we need to input 1.77 (=1/0.565) units of energy for every 1 unit we turn into electricity at the output transformer.
Energy data is wonderful. Usually in one report you can read gas production in billion cubic meters (volume, new school), later in trillion cubic feet (volume, old school), then in MBTUs (energy, old school), then in GJ (energy, new school), then in MWh (energy, not quite new school, but easy to convert from your consumer bill of kWh). Somewhere in the report the energy will also be quoted as MBoe (million barrels of oil equivalent – energy, very old school but also very contemporary). It’s all designed so you need to pay expensive consultants to explain the report to you.
In other news, Usain Bolt ran the 100m in a new stadium record of 61,336 furlongs per fortnight.
For simplicity, pretend 1 GJ (a billion joules – energy) = 1 MBTU (million British thermal unit). The correct value is 0.95 but forget that.
And 1 GJ (energy) = 278 kWh (energy) = 0.28 MWh (1W running for 278,000 hours = 1W running for 278,000 x 3600 seconds = 1GJ)
Sorry for all the numbers, but I think it’s helpful to show the paper trail, rather than just pull a rabbit out of a hat. For people interested, you can do the numbers yourself..
So – for each MWh output at the transformer, we need to put 6.4GJ (=1/(0.278 x 0.565) of gas energy into the inlet flange of the plant.
Roughly speaking, we see gas costs for our two reference prices (taking into account plant efficiency) of $19/MWh (6.4 x $3) and $64/MWh (6.4 x $10). What does this mean? Nothing changes for wind, but we can add up our running costs for the gas plant:
Wind
- Fuel = $0 (nice)
- O&M = $14/MWh
Combined-Cycle Gas
- Fuel = $ 19/Mhr & $64/MWh
- O&M = $3.60/MWh
- Total = $23/MWh & $68/MWh
Capital Cost
Now let’s look at capital cost. The gas plant can’t be built overnight, it takes a couple of years so converting the “overnight cost” to the real cost including interest adds about 10%. We’ll do the same to the wind farm, which probably takes longer to build out, but also it can start producing from day 90 instead of waiting until the end of how ever many years the wind project takes:
Wind – 4GW nameplate
- Cost = €4BN x 1.1 (for capital during startup) x 1.13 (exchange rate) = $5BN
Gas plant – 1.1GW nameplate
- Cost (see notes) = $0.75BN (includes capital during startup) x 1.1 (converting cost per GW to 1.1GW) = $0.83BN
If we do the nice simple calculation as I did in the wind farm example we can divide this capital cost by 20 for an annual cost. It’s simple, but unfortunately too simple:
- Wind farm capex = $250M per year (no cost of capital) = $28/MWh (for 8.8 MWh per year)
- Gas plant capex = $ 42M per year ( ” “) = $4.70/MWh (” “)
There is a annuity calculation that allows us to compare the cost year by year, depending on the life of the equipment and the cost of capital. I’ll present the results of the calculation and we will see that it doesn’t make a big difference for the gas plant (because the fuel cost is so much higher), but does have quite an impact on the wind farms.
By way of example, for capital upfront, if we take 1/20th of the cost per year, we get 5% of the total capex per year (=1/20).
But if we take into account a “cost of capital” of 8% per year, the capex “really costs” 10% of the total per year. So “cost of capital” has actually doubled our effective capital cost. This is normal.
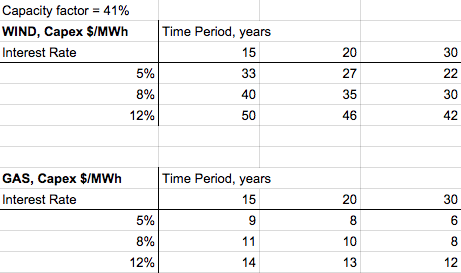
So let’s look at the “real capex cost” for 15, 20 and 30 year lifetimes of equipment, at 5%, 8% and 12% cost of capital:
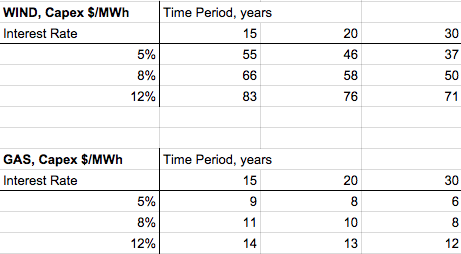
Figure 8
We see the ratios are the same. But because the gas plant costs 1/6 of the wind farm, the actual gas plant capex is very low compared with its fuel cost. In essence, it doesn’t really matter what values we choose when we look at the gas plant (it matters to the owner, but not to us, for our purposes of broad comparison). On the other hand, cost of capital (“interest rate”) and time of operation make a big difference for the wind farm because the capex costs dominates.
Lets review our total operating costs:
- Wind = $14/MWh
- Combined-Cycle Gas = $23/MWh (@$3/GJ) – $68/MWh (@$10/GJ)
- Extra operating cost of gas over wind = $9/MWh (@$3) – $54/MWh (@$10)
So now we can calculate the total cost. Overall, if we look at the difference between the two tables, i.e., the capex difference, and add the opex difference, at recent European gas prices, for 20 year+ time horizons, wind is a little more competitive than gas plants (unless the cost of capital gets too high). At recent US gas prices, wind is way more expensive than gas.
Hey, wind is cheaper than gas
Hey, gas is cheaper than wind
Something for everyone.
Semi-Conclusion
Lots of numbers. It’s deliberate.
If you just want the answer that helps your cause, there it is – pick the one you like. If you want to understand the real story, a little work is needed.
What we can see is that even for quite different costs of construction for the gas plant, it won’t affect the comparison of gas vs wind. This matters a lot for a gas plant owner, along with the plant efficiency. But it doesn’t have much impact on our comparison numbers.
All of the numbers calculated can be questioned. There is no right answer. But hopefully everyone can see that the values that affect the cost comparison are:
a) price of gas, and
b) capex cost of wind turbines along with interest rate and lifetime of the turbines
We’re Not in Kansas Anymore
Let’s consider Oklahoma. Now the capacity factor has jumped up to 41%. So our upfront capex cost to produce an average 1GW has reduced from $5BN to about $3BN. Lovely. I recalculated the numbers (gas capex hasn’t changed, opex hasn’t changed for either):
If we pick 8% and 20 years we see that wind power capex is only $25/MWh more than the gas capex cost.
So with our “gas opex adder” of $9/MWh for cheap “I can’t believe it’s not Christmas” US gas, wind is still pricey. Wind is still $16/MWh more expensive ($25-$9).
But with our “cor blimey what are those Europeans doing” opex adder of $54/MWh, wind is now $29/MWh cheaper ($25-$54) than gas.
And last but not least, who’s the buyer?
Route 66
If we have a local buyer for this 1GW of power, we are in good shape. Although the current low US gas prices still make wind a little more expensive than gas in the Oklahoma example, recent history might make a wind power entrepreneur feel positive.
But suppose our customers are in New York. It’s about 1,000km in old money to get from windy Oklahoma to New York. We have a 2.5GW nameplate wind farm, so during windy periods we are producing 2.5GW. Now we need to get it 1000km.
According to our calculations in VIII – Transmission Costs And Outsourcing Renewable Generation this will cost around $2.5BN, give or take a little (or maybe a lot).
So we have almost doubled our capex price. Possible we have moved (in the wrong direction) past our European example, to a worse cost base. At our benchmark 8%, 20 year lifetime we are at capex approaching $70/MWh. Add in opex of $14/MWh = $84/MWh. So we are way more pricey than gas if we want to supply New York.
Of course, we can redo our calculations for a wind farm closer to New York, and on the minus side we might have a lower capacity factor for wind, but on the plus side maybe we can connect to a nearby under-capacity transmission line. Or worst case, we might need to build a transmission line – but it will be a lot shorter.
The gas plant has a constraint too – building gas pipelines aren’t cheap. (I forget the numbers I learnt but they might be in the same order of magnitude as power transmission lines for similar GW).
However, the gas plant entrepreneur is lucky, they can look at a map of gas pipelines and a map of power transmission lines and pick the optimized spot. It’s quite likely they will be able to tap off an existing gas pipeline and connect to an existing transmission line.
The benefit of incumbency and decades of infrastructure that they don’t have to pay for.
Conclusion
A bewildering array of numbers.
If you want to get your hands around the problem, it takes a little work, but it’s not so hard. Gas plants are cheap to build by comparison with the fuel costs. The fuel costs dominate. Wind farms are very expensive to build, have no fuel costs but still cost a bit to look after.
Gas plants can mostly be cited where you want – so you choose close to pipelines and close to transmission lines. Wind farms are often (but not always) subject to more location constraints – what you gain in better capacity factor (more wind) you might lose in building expensive transmission.
Which is cheaper per MWh of energy delivered to the customer? It depends.
So many cheerleaders with so many confident answers. And yet the right answer depends on the situation, the gas price, the cost of capital, the current capital cost of wind turbines, and most of all, where you are citing the wind farm and where your customers will be.
If there’s a lesson, it’s that turning a complex problem into one number doesn’t reduce confusion, it increases it.
What’s the average age of the population of Japan compared with the USA? The comparison can be a useful one. Still, it would be nice to see the demographic bulge – the graph of population vs age is much more useful than one number.
What’s the average weight of the population of Germany vs Mexico? Now we are really getting to a useless number (don’t we want to know the proportion of under 10s and over 70s before we draw any conclusions? And the average height of Mexicans vs Germans?)
If you add a carbon price to gas, wind will look better. You can easily do that yourself with the numbers in the article.
For people convinced that decarbonization is urgent, any extra cost of wind is of no issue. For people convinced that decarbonization is a total or partial waste of time, any extra cost of wind just illustrates how pointless the exercise is.
I make no comment on those points – I simply wanted to get an understanding of the cost comparison (here’s hoping I didn’t miss a factor of 1000 in one of my calculations).
If you want to figure out how to get to 50% renewables (% of electricity production) none of these numbers help.
Baseload Power and Messianic Storage have not yet been covered. That’s still a mystery.
Articles in this Series
Renewable Energy I – Introduction
Renewables II – Solar and Free Lunches – Solar power
Renewables III – US Grid Operators’ Opinions – The grid operators’ concerns
Renewables IV – Wind, Forecast Horizon & Backups – Some more detail about wind power – what do we do when the wind goes on vacation
Renewables V – Grid Stability As Wind Power Penetration Increases
Renewables VI – Report says.. 100% Renewables by 2030 or 2050
Renewables VII – Feasibility and Reality – Geothermal example
Renewables VIII – Transmission Costs And Outsourcing Renewable Generation
Renewables IX – Onshore Wind Costs
Renewables X – Nationalism vs Inter-Nationalism
Renewables XI – Cost of Gas Plants vs Wind Farms
Renewables XII – Windpower as Baseload and SuperGrids
Renewables XIII – One of Wind’s Hidden Costs
Renewables XIV – Minimized Cost of 99.9% Renewable Study
Renewables XV – Offshore Wind Costs
Renewables XVI – JP Morgan advises
Renewables XVII – Demand Management 1
Renewables XVIII – Demand Management & Levelized Cost
Renewables XIX – Behind the Executive Summary and Reality vs Dreams
References
Combined-Cycle Gas and Steam Turbine Power Plants (3rd Edition), Rolf Kehlhofer et al, PennWell (2009)
Notes
Construction times:
Their LCOE calculations:
Breakdown of the plant costs for interest:


You posit a false dichotomy – high cost and low are the only alternatives for ‘decarbonisation’. It is relatively easy to obtain a discounted cost for infrastructure. This is not however the ‘incremental cost’ of intermittent sources. A different methodology is requires to make rational cost comparisons. Such as the NREL 80% (40% wind) scenario.
– http://www.nrel.gov/analysis/re_futures/
The high cost high penetration of intermittent sources should give all rational people pause. It little matters what the source of power is – but it must remain relatively inexpensive if we are to maximise economic development this century and address population pressures and environmental degradation that comes with poverty.
It begs the question of whether there are not other courses of action that are far more cost effective – and practical and ethical – to reduce emissions of greenhouse gases and aerosols. Gas generation reduces emissions in principle – but a comprehensive policy must include addressing population through enhanced health and education opportunities, creating resources through economic growth for restoring agricultural soils, for conserving and restoring ecosystems and for making manufacturing and transport more efficient. Nitrous oxide, tropospheric ozone, CFC’s, sulphides and black carbon can all be usefully addressed while increasing productivity and reducing health impacts. Failing to address these pressures is a policy to fail. In aggregate they are far more significant than carbon dioxide from power plants.
Addressing these issues requires a fundamentally different approach.
e.g. http://watertechbyrie.com/2015/06/06/economic-growth-and-environmental-management-in-a-global-iriai/
Chief Hydrologist
I haven’t put forward a dichotomy (‘a division or contrast between two things that are or are represented as being opposed or entirely different.‘), I have put forward a cost comparison between 2 different methods of energy production, which – as explained in many previous articles – have differences beyond cost.
This is the dichotomy I referred to – a stark contrast between two equally silly and simplistic positions. I have no doubt that there are silly and simplistic ideas out there.
And as I pointed out your costing methodology cannot address the difference between dispatchable and non-dispatchable generation. The cost of high penetration of wind is significantly higher than the NREL baselin scenario. This is the starting point – and not the discounted figure for capital cost plus operation and maintenance plus fuel costs.
The more nuanced position of NREL, the Breakthrough Institute and the Copenhagen Consensus on electricity costs is based on research and development of innovative energy systems in addition to reduction in greenhouse gas emissions in a far broader policy framework.
Very nice post, and informative, as always. One small correction, it is a little over 2000 Km from Oklahoma City to New York City.
One unaddressed issues is still important: There will remain a need for fossil fuel generation capacity for when wind doesn’t blow; how much depends on lots of factors, but certainly not close to zero. So looking at the bigger picture, the drop in capital and maintenance costs for fossil fuel plants is not in proportion to the average added capacity of the wind turbines, but somewhat less. So the true total cost of ‘a workable system’ is partially hidden when you just look at the costs for building and operating wind turbines along with transmission costs.
stevefitzpatrick
As I said in the article:
stevefitzpatrick,
You are right. I’m not sure how I got such a short distance when it is so far..
So, using my highly apocryphal cost calculator for power transmission the cost jumps up even more.
The information in the notes is very interesting. The book uses 2008 prices for natural gas, before the shale fracking boom; with current prices for gas in the States, the combined cycle gas plant has the lowest total cost by far, so there is no surprise that CC gas plants are being built instead of other types. But there is another factor in play. The relatively low capital cost, and relatively rapid construction for CC natural gas, means lower risk for investment. The relatively benign environmental image for natural gas (no sulfur, no ash, no waste products, etc.) means CC natural gas has very low “political risk” compared to coal and nuclear. Even if the inflated capital cost for nuclear could be reduced significantly using standardized designs and streamlining the licensing process, making it the lowest cost base load supply, there would continue to be the “irrational fear” political issue, which is unlikely to go away (Germany, Japan, Harry Reid), so investors will continue to migrate toward natural gas, in spite of the potential for rising gas prices. The possibility of massive stranded investments is always going to influence investors.
Fracking is still frowned on by greens. I occasionally see ‘Ban Fracking’ bumper stickers. It is banned in NY. Germany would rather buy methane from Putin than use fracking, apparently.
An excellent article. Thanks.
I’ve had a bee in my bonnet for some time about natural gas emissions, and would love for you to delve into it. I don’t have access to any sort of scientific journals, so I can only gets bits in dribs and drabs. (Perhaps when you’ve finished this series?)
Natural gas is supposed to have half the carbon emissions of coal, but in looking into that, I can’t find terribly clear answers. The 50% number comes from old values for methane to CO2 equivalence, exclusive use of natural gas by power plants, and ignorance of fracking/shale emissions.
I’m familiar with Ingraffea’s work;
Click to access Howarth-EtAl-2011.pdf
The industry ‘line’ is that it was unfair for Ingraffea to compare natural gas and coal since coal isn’t burned in the home. However, when looking at an energy source its important to look at the whole picture. Ingraffea points out that venting on completion for fracking releases another 20-30% more CO2 equivalent, and that pipes leak. A lot.
By the way, LNG compression burns 5% of the natural gas, and various leaks in transport add up to another 3% or so.
It’s the heat of reaction. Breaking the carbon to hydrogen bond and reaction with oxygen to form water is more energetic than reacting oxygen with carbon to form CO2.
CH4 + 2O2 → CO2 + 2H2O ΔH = -890kJ/mol
C + O2 → CO2 ΔH = -393.5 kJ/mol
So for the same amount of energy, you make about half the CO2 burning methane.
Uh No. I’m talking about emissions.
If you read Ingraffea’s paper you’ll note that he claims Natural Gas has similar emissions as coal. Mainly because of various fugitive leaks in pipes, well completion, and final delivery (particularly to homes).
Given the SOD was talking about old delivery its a bit apropos to mention that old rusty pipes are leaky…
DeWitt Payne and anoilman,
“So for the same amount of energy, you make about half the CO2 burning methane.”
Also, methane can be converted to electricity more efficiently than coal; about 54% efficiency using the higher heating value (I think that is the number you cite) vs. about 45% for the best modern coal plants. So 480 kJ electricity per mole of CO2 vs. about 180 for coal.
On the other hand, there is the question of fugitive methane emissions, referred to by anoilman. Methane is a much more effective greenhouse gas than CO2, but it only remains in the atmosphere for a tiny fraction of the time. People compare the two by integrating the forcing over some period of time to get the “global warming potential”; the result depends on the time interval chosen. If you want to make methane look bad, you pick a ridiculously short time horizon like 20 years. That gives methane a GWP close to 100 (CO2 being unity), so that leakage of even 1% of methane has a huge impact. More reasonable time horizons give smaller values.
I think that GWP is silly for short lived gases like methane. The only reason CO2 is of concern is that once we put it in the atmosphere we are stuck with it, whereas methane released to the atmosphere is pretty much gone in a few decades. So 50 years from now, the only effect of the methane that we release now will be the CO2 that it gets oxidized to.
The GWP of methane is high mainly because there’s so little methane in the atmosphere. In terms of molar absorptivity, the principal CO2 absorption band is higher than CH4 and it’s in a part of the spectrum where the emission intensity is higher. But CO2 is 400ppmv and CH4 is 1.7ppmv. It takes a lot less methane to double its concentration. So a kg of CH4 has a greater effect than a kg of CO2. And a kg of CH4 contains three times the number of moles of CH4 than the number of moles in a kg of CO2. Which means that a kg of CH4 will eventually produce 3kg of CO2 when it’s fully oxidized.
By the way, rice agriculture and other wetlands and ruminants account for over 50% of all emissions of methane to the atmosphere. The energy industry is less than 20%.
Current atmospheric methane is about.1.1 PPM above the pre-industrial level (ice core data), and since the fracking boom began (2008) has been rising at a rate of about 0.006 PPM per year; prior to that, nearly flat for some time.. The rate of oxidation of methane is about 10% of the total per year, so to maintain a level of ~1.1 PMM above the pre-industrial background, total human emissions from all sources (natural gas drilling, agriculture, coal mining releases, land fills, pipe-line/distribution leaks, etc) has to be approximately equal to ~0.11 PPM per year. So a first order estimate of the increase in methane emissions from all sources since 2008 is a little over 0.006/0.11 = 5.5%. To be conservative, we can say at most a 7% increase. If we make the (heroic) assumption that 7% is all due to fracking, increased gas use, and increased distribution losses, then at equilibrium the level of methane would be expected to increase by about 7% of 1.1 PPM = 0.077 PPM, equal to a forcing of about 0.03 watt per square meter (compared to a current total man made GHG forcing of about 3 watts per square meter). Not a huge forcing, but not zero. If we assume fracking will triple in the next decade, and losses increase proportionally, then total increase in forcing at equilibrium might represent 3% of today’s forcing.
Of course, the heroic assumption that all increase in atmospheric methane is due to fracking would need to be justified for the above to be credible; it represents a worse-case estimate for the impact of fracking/increased gas use. The net impact for substituting natural gas for coal in power generation (short lived methane versus long lived CO2) will depend on the time horizon considered, the actual contribution to atmospheric methane from drilling and distribution of gas to power plants, and the assumed half life of CO2 in the atmosphere… which itself has considerable uncertainty. It seems prudent to look carefully at how much gas is actually lost from fracking and distribution, and minimize those losses. This is low hanging fruit compared to many other options for reducing GHG forcing.
I think there is a decimal point error in my above comment… I will fix it.
I checked the arithmetic… I think it is OK.
stevefitzpatrick wrote: “It seems prudent to look carefully at how much gas is actually lost from fracking and distribution, and minimize those losses. This is low hanging fruit compared to many other options for reducing GHG forcing.”
It would be prudent for the gas producers to look at this. Since they have an economic incentive to do so, we can leave it with them. But it would be most imprudent to have governments look at this. The public policy concern is not about the forcing that exists today, it is about what *might* happen two or three generations in the future. The methane we emit today will be long gone by then, but the CO2 will still be in the atmosphere. So if we opt for the low hanging fruit, there is no long term benefit and a possible long term cost (if we reduce methane rather than CO2).
Mike M,
I think that depends on how long natural gas will be recovered, how much natural gas is actually lost in drilling and distribution, and so how far in the future forcing from methane will be significant; reserve estimates I have read suggest natural gas production will be important for a century or more. Best estimates for forcing from man-released methane are at present ~0.4-0.45 watt/M^2. If that could be significantly reduced through improved practice in drilling and distribution (not to mention better control of other known sources like rice paddies and land fills), then the forcing from methane could be reduced… both now and well into in the future.
Whether the only “value” involved is the economic value of the lost gas depends on how important/potentially harmful one things warming might be, as well as what you think the sensitivity to additional forcing is. Personally, I believe sensitivity is quite modest (<0.5C per watt/M^2 at equilibrium), and an additional forcing of 0.1 watt/M^2 over the next century is not likely to be a significant issue. But there are many who think sensitivity is much higher. My point was that if any action is going to be taken to reduce GHG forcing, then low hanging fruit like natural gas leaks is probably a lot less costly than subsidizing solar panels.
stevefitzpatrick,
“My point was that if any action is going to be taken to reduce GHG forcing, then low hanging fruit like natural gas leaks is probably a lot less costly than subsidizing solar panels.”
My point is that if we are going to take any action *now* it had better be something that will make a difference 50 years from now. That is, it must be something that reduces long-lived greenhouse gases like CO2 or CF4. Reducing methane leaks now will have no effect on atmospheric methane 50 years from now, so money spent on that now will be wasted, even if there is as big a problem as some people claim. But if 50 years from now we want to reduce atmospheric methane concentrations, action taken then will be effective, unlike CO2. The best we could do with CO2 would be to stop it from increasing further.
I am skeptical of the need to take any action beyond what will forced by the finite supply of fossil fuel. The only reason I am worried at all is because of the essentially irreversible nature of increased atmospheric CO2. But increasing atmospheric methane is reversible, so there is no reason to be concerned until and unless it becomes an actual problem.
Mike M,
I think we mostly agree. The only thing you can do about CF4 and SF6 is to not use them. CO2 is relatively long lived, but a sufficient reduction (>50%) in CO2 emissions certainly would lead to falling atmospheric concentrations due to continued plant and ocean uptake (the exact required reduction in emissions to see a drop in concentration is uncertain). But reality is that developing countries (China, India, many in Africa, etc) are only going to increase the burning of fossil fuels in the next few decades, so a net global reduction from today’s emissions is a) almost certainly impossible in the next 50+ years, and b) would be monumentally expensive if it could be done. The thing I really don’t understand is the resistance to nuclear power among most who say they are concerned about GHG driven warming. Nuclear generation really could make a substantial impact on total CO2 emissions at pretty reasonable cost.
Don’t forget cows!
Yes, cows too.
stevefitzpatrick,
OK, I’ll agree to agree (mostly).
A sufficient reduction of CO2 emissions (much more than 50%, I think) would indeed lead to falling atmospheric concentrations. But the half-life would be measured in centuries, so it will not do much to save our grand children’s butts if the alarmists turn out to be right. And a net reduction from today’s emissions will not happen for at least several decades.
“Nuclear generation really could make a substantial impact on total CO2 emissions at pretty reasonable cost.”
I agree, even with current technology. If we put real resources into advanced tech, such as molten salt reactors (and eventually thorium), the situation could be much better in a decade or two. To get all electricity from nuclear might be a problem without storage, but that problem would not kick in until 50% or more is from nuclear.
“The thing I really don’t understand is the resistance to nuclear power among most who say they are concerned about GHG driven warming.”
Perhaps I am reading you too literally (and therefore explaining what you already know), but many of those concerned about global warming are not acting on the basis of science. Their position is based on a misguided ideology that sees capitalism and industrial civilization as something that destroys people and nature. So catastrophic warming is not a cause of their position, it is a chance to say “I told you so”. And nuclear power, arguably the epitome of industrial civilization, has no place in such an ideology, except as an evil to fight against.
Mike M,
The current uptake of CO2 is just about 50% of total emissions, with about half going intoithe oceans and half being taken up by faster plant growth. So if all CO2 emissions were to stop tomorrow, then there would be an inital rate of fall in atmospheric CO2 about equal to the current rate of rise (that is, half of current emissions). Of course, that would change over time due to “saturation” of the system, especially ocean surface waters, but enhanced plant uptake would continue for some time (decades?) at near the current rate, and thermohaline circulation would continue to pump more CO2 into cold deep waters than is released from upwelling/warming water, so the rate of fall would take a while to diminish very much. (Exactly how quickly is unclear.) In any case, it would not take much more than a 50% decline to see at least an inital drop in the atmospheric concentration of CO2.
.
I had a long, unpleasant argument with Michael Tobis about this subject years ago at Lucia’s blog. He stopped participating in public blog discussions not long after. Maybe a coincidence.
Steve,
I wrote a post about the carbon cycle a few years back at the Air Vent. It doesn’t work quite the way you describe. It’s true that the amount of CO2 absorbed is equivalent to about half of the emissions in a given year, but only a small part of that comes from that year’s emissions. The rest is continuing absorption of CO2 emitted earlier that decays more or less exponentially. If you could cut emission instantaneously by 50%, the concentration would remain approximately steady for the next year. But unless you continued to cut emissions every year after that, the atmospheric concentration would continue to rise, but at a much slower rate until it reached steady state.
See the graphs of emissions reduction and atmospheric CO2 concentration here from the IPCC assessment report.
DeWitt,
Yes, I agree that is what would happen. But while there would be a slow rise starting not too long after the initial fairly constant period (a year sounds reasonable) following a 50% cut in emissions, I think there is considerable uncertainty in how atmospheric concentration would evolve after that. In any case, a cut of significantly more than 50% would almost certainly lead to an initial decline in atmospheric CO2, the rate of which would gradually flatten before starting a very slow rise.
Ugg… I forgot about all this and showed up late…
In the 100 year time frame, natural gas is %50-100 the carbon emissions of coal. I suppose its good to know that it won’t be as bad in the longer term.
Mike M, the UK has asked industry leaders to look into improving the methane emissions form fracking, but industry is resisting. The issue is bad… you’re talking about a lot of infrastructure needing to be replaced to clean it up. And… in that light, you may as well go with new renewable infrastructure since we know the old stuff is the problem.
http://www.desmog.uk/2015/06/08/revealed-uk-government-lobbied-big-oil-be-green-gas-leaders-shell-bp-not-so-keen
In the US, Industry/EPA have decided that ‘Green Completions’ will be required to put a dent in well completion. Green Completions are just flaring, so we’ll burn 20-30% of a well’s gas.
https://www.edf.org/media/first-academic-study-released-edf%E2%80%99s-groundbreaking-methane-emissions-series
The reason I have a bee in my bonnet over all this is that methane isn’t that clean. It concerns me.
anoilman,
You wrote: “The reason I have a bee in my bonnet over all this is that methane isn’t that clean. It concerns me.”
If the reason that you say methane isn’t that clean is because of its so-called “global warming potential” then your concern is misplaced. GWP is not a useful concept for short lived greenhouse gases. The time scale for atmospheric removal is a critical aspect of the CO2 problem, if there is such a problem.
Can’t reply to you directly Mike M… but thanks. It does help to try and think in those terms.
http://news.stanford.edu/news/2015/september/methane-pipeline-replacement-090915.html
To imagine that new gas generation plants with new pipelines – or even existing plants on major pipelines – add all that much to leakage is disingenuous.
Hear, hear! Or +1. Or indeed!
The figure is by the way gas use in the US by sector.
Decarbonisation = Deindustrialisation = Conquered by some Carbon Military
A lot of people are trying to convince themselves that throwing around numbers (economists) is going to save themselves from the firing squad of whomever controls the remaining fossil fuel reserves.
I’m not sure why you think your interest rate values are reasonable in today’s world. Homeowners can get 30-year loans at less than 4%. Governments can get lower rates than that. I don’t think 8% is the right number for comparisons at least under current economic conditions. And that rate, and the expected lifetime, makes a huge difference in the wind farm comparison as you yourself note. In fact the world today seems to be awash in capital trying to find good things to invest in – renewables seem an awfully good choice in that context.
That the money isn’t being invested in renewables means that those with the money to invest don’t agree with you that it’s a good choice.
Arthur,
Do you have some numbers from some wind farm operators?
I don’t have actual numbers.
Typically the “cost of capital” paid by a commercial entity is substantially more than a home owner loan. It depends on lots of factors. If it’s a new entity they pay a lot more. If it’s an established entity where the wind farm is a small part of their business and that business has lots of collateral then they pay only a little more.
If GE runs its own wind farms then it will have a great interest rate for borrowings – except it will use a weighted mix of capital – equity and debt – where its return on equity is expected to be “X”, and “X” is a lot higher than the homeowner interest rate.
Basically if you are a successful blue chip company and you, the CEO, business unit GM, etc, get a 4% return on equity you will probably get fired.
I’m a bit out of touch with weighted cost of capital, maybe someone else can add a little substance.
One last point, if there is a government “sponsored” or government-owned institution setup for the purpose of loaning money to renewable energy providers, which borrows commercially but has implicit state backing then the interest rate to wind farm operators will be very low.
Aaa corporate bond rates are very close to 4% right now according to this chart:
https://research.stlouisfed.org/fred2/series/AAA
And this JP Morgan report from almost a year ago expects long term returns on equity to be between 4.5% and 7% (10-15-year time frame) for most developed countries (exhibit 8):
https://am.jpmorgan.com/be/institutional/ltcmra
Arthur,
A lot of wind farm operators won’t have a bond rating because they don’t issue bonds – if they did, they would be “junk bonds”.
The first couple of wind farm operators I found were owned by private equity houses.
The next was AES, h/o in Arlington, Virginia. It is a substantial company, been operating a long time, with generation assets in gas, coal & renewables, in many countries:
In their 10K (this is the annual SEC filing – note, never read annual reports with glossy photos and fabulous excitement around their amazing executive team, if you want to understand a company’s finances, instead read their boring 10K) they show:
$20.9BN debt and interest expense of $1.5BN, which equals over 7%. Their debts are backed by the collateral of generation assets.
Here are the gory details:
Click to enlarge
Click to enlarge
Remember as well that companies have equity and will finance projects internally with a weighted cost of capital. They require a better return on equity so the internal cost of capital applied to a business unit will be higher than their raw debt financing cost.
The EIA use a 6.1% weighted average cost of capital. It includes a ‘no risk’ return – government bonds – return plus a market premium representing opportunity cost. 6.1% is historically low and a result of ongoing low interest rates.
In reality capital goes to the best return – most positive LACE – LCOE. You can skew that with tax credits if you want.
Arthur,
Perhaps a little lower than 8% would be more suitable, at least in today’s economy. But historic capital costs are significantly higher, as are interest rates on secured home mortgages. Remember too that nuclear power has very high capital costs and very low fuel costs, so any reduction in presumed interest rates makes nuclear more attractive as well…. and it is not intermittent.
Like DeWitt notes, if wind is financially attractive, investors will invest. Absent subsidies, there are not many places where wind pays reasonable returns.
Arthur: In the US, essentially all home mortgages are being insured by the FHA, making their interest rates artificially low. And the Fed bought $2T of Treasuries and $1.5T of US-guaranteed mortgage backed mortgage securities through various quantitative easing programs. By way of comparison, the current annual budget deficit is around $0.5T (and was twice as high at the peak), so the Fed has bought up a significant fraction of the new debt being issued. So, it doesn’t make sense to calculate the cost of capital based the unusually low and unsustainable interest rates you cite. The CBO expects interest rate on Treasuries to double over the next ten years.
Most investment in electricity generation is done by private companies and/or private investors such as hedge funds. Through public utility commissions, power generators are allowed to charge customers an agreed upon cost of capital. There is competition for capital: Investors will take their money elsewhere if they can’t negotiate an attractive return on capital. Poor economic growth since the Great Recession has certainly reduced the competition for capital in recent years, but we are all hoping for a return to better conditions.
The cost of capital also varies with the risk of the investment: When, if ever, will that transmission line get built to take electricity from windy Oklahoma to where it is needed? Will the gearbox in today’s turbines last for 8 or 20 years? Will the US start exporting its natural gas, narrowing the gap between US and world markets? Are liberal activists or conservative patsies being appointed to the public utilities commission? If you a hedge fund manager who has no intention of owning a wind farm for 30 years, how much will a wind farm be worth in five years?
When the EPA set the discount rate for calculating the social cost of carbon, they used a government borrowing rate, not the higher cost of capital that is being charged to customers on their electricity bill. The government can lower the cost of capital by interfering in the marketplace with guaranteed loans, tax deductions, renewable energy requirements, etc., but then citizens are likely pay the extra costs through inefficiencies like Solyndra. Do you really want the government borrow money at a low rate and invest that money directly or through crony capitalism?
Thanks – very informative article, although I’m not sure how meaningful cost comparisons before taking account of dispatchability and back-up costs for intermittent sources are.
Re the discussion on forcing from methane, this does not depend logarithmically on concentration like it does for CO2, and it is affected by N2O levels. The IPCC TAR gave an approximate formula relating the change in CH4 forcing to the change in its concentration:
ΔF= α(√M–√M_0)–(f(M,N_0)–f(M_0,N_0)) where M is CH4 in ppb, N is N2O in ppb, f(M,N) = 0.47 ln[1+2.01×10⁻⁵ (MN)0.75+5.31×10⁻¹⁵ M(MN)1.52], _0 signifies initial concentration, and α=0.036.
Stevefitzpatrick wrote: “CO2 is relatively long lived, but a sufficient reduction (>50%) in CO2 emissions certainly would lead to falling atmospheric concentrations due to continued plant and ocean uptake (the exact required reduction in emissions to see a drop in concentration is uncertain).”
I think Steve’s point is worth emphasizing. We are currently burning enough fossil fuel to raise CO2 by 4 ppm/year. (These units are more comprehensible that gigatons/year.) CO2 in the atmosphere is accumulating at a rate of 2 ppm/year, meaning that 2 ppm/year is currently disappearing into sinks and that CO2 would stabilize with a 50% reduction in emissions. (As long as sinks don’t saturate.) The developed world is being told that we need to reduce emission by 80% to avoid catastrophe. The cost associated with emission reduction certainly will rise rapidly between 50% and 80%. Once citizens in the mostly democratic developed world realized what is being asked of them (and not the undeveloped world), 80% reduction may be politically impossible.
Last time I looked, per capita Chinese emissions of CO2 were already above those of the EU. Under the agreement between Obama and China, I estimated that per capita Chinese emission of CO2 would be equal to that in the US by 2030 (the year China expects their emission to peak).
The situation becomes worse for less developed economies when one considers their low carbon efficiency, how much value (GDP) is created per ton of CO2 emitted.
Frank,
Did you not read my reply to Steve above? CO2 will not stabilize any time soon with a 50% cut in emissions. I ran the numbers through my model based on the IPCC implementation of the Bern CO2 impulse response model. If you froze emissions at the 2005 level, atmospheric CO2 would increase from 379ppmv in 2005 to 533 ppmv in 2100. If emissions had been frozen in 2006 to 1/2 the 2005 level, CO2 would still increase to 439ppmv. Stabilizing at the current level of 400ppmv would require an immediate cut of about 50% in 2016 and further cuts every year after that.
DeWitt: Thanks for drawing my attention to your reply to Steve and your post at the Air Vent. Please note that I qualified my statement with “as long as sinks don’t saturate”.
The Berne model you cite has 7 parameters that have been adjusted to best fit the data. I’m sure you are familiar with Neumann’s comments about fitting an elephants trunk. So I’m surprised you place any confidence in such a model simply because it fits the data well.
I can fit n+1 points perfectly with an nth degree polynomial too. The uncertainty in the data points tells whether to attach any significance to the coefficients of the higher order terms. Run a Monte Carlo simulation and they’ll disappear.
In the CO2 data from ice cores, there is significant uncertainty about when diffusion between layers stops and whether the concentration from each layer represents a five-year or fifty-year average. There are rumors that the interface with ice core and the Mauna Loa records involved some fudging. There are uncertainties associated with other sources of CO2, such as deforestation. Your graphs at the Air Vent aren’t currently visible on my browser, but your text comments on other discrepancies.
Since one can fit almost any limited set of data with a wide variety of equations, I’m interested in knowing whether any of the reservoirs and time constants have physical reality. There should be a strong relationship between the molecular diffusion of CO2, CFCs, C14 and the thermal diffusion of heat into the ocean and effective size of ocean reservoirs. We know a lot about the thermal reservoir that equilibrates rapidly with the atmosphere by turbulent mixing by surface wind. The 97/98 El Nino and 99 La Nina caused a major perturbation in the increase in CO2 in the atmosphere. In his analysis of Pinatubo, Paul_K characterized a thermal reservoir with a size similar to the mixed layer that is below the mixed layer and accessible within a year. There is an annual signal associated with the summer greening of land in the NH – or perhaps that is uptake of CO2 by the larger cold ocean in the SH. Deep-water formation involves many centuries.
Has anyone identified any of the reservoirs in the Bern Carbon cycle using anything besides curve-fitting?
AR4 WG I Chapter 10 Summary claims:
“There is unanimous agreement among the coupled climate- carbon cycle models driven by emission scenarios run so far that future climate change would reduce the efficiency of the Earth system (land and ocean) to absorb anthropogenic CO2. As a result, an increasingly large fraction of anthropogenic CO2 would stay airborne in the atmosphere under a warmer climate. For the A2 emission scenario, this positive feedback leads to additional atmospheric CO2 concentration varying between 20 and 220 ppm among the models by 2100. Atmospheric CO2 concentrations simulated by these coupled climate-carbon cycle models range between 730 and 1,020 ppm by 2100. Comparing these values with the standard value of 836 ppm (calculated beforehand by the Bern carbon cycle-climate model without an interactive carbon cycle) provides an indication of the uncertainty in global warming due to future changes in the carbon cycle. In the context of atmospheric CO2 concentration stabilisation scenarios, the positive climate-carbon cycle feedback reduces the land and ocean uptake of CO2, implying that it leads to a reduction of the compatible emissions required to achieve a given atmospheric CO2 stabilisation. The higher the stabilisation scenario, the larger the climate change, the larger the impact on the carbon cycle, and hence the larger the required emission reduction.”
So the uncertainty in the effect of saturation of sinks lies between 20 ppm and 220 ppm over the course of a century of rising CO2. So if we cut emissions by 50%, CO2 might rise from 400 ppm to 420 ppm (a rough first approximation, effectively stabilization) or rise from 400 ppm to 600 ppm due to increasing saturation of sinks. So we really don’t know. AR5, of course, swept all of this uncertainty under the rug by abandoning emission scenarios for RCPs. )^(&#^%(@*!
Which leaves my point in limbo. If developed countries are being asked for an 80% reduction in emissions – when a 50% will suffice initially, how much of the additional 30% is needed to compensate for the growing emissions from developing countries and how much is needed to deal with saturation of sinks? The numbers above suggest that saturation in the Berne model adds about 100 ppm over a century or 1 ppm per year. This leaving 3 ppm/year to accumulate instead of 2 ppm/year and a need for a 75% reduction.
In the real world, if the US had cut emissions by 80% over roughly the past decade, the increase in Chinese emissions would have offset our reductions. If the Brits had made an 80% reduction, it would have taken about a year of increasing Chinese emissions to offset their reduction.
Frank,
I’ll be nice this time rather than reply in the same patronizing tone you used.
Those seven parameters are an approximation to the real model curve, not a fit to measured data, something like a Taylor expansion rather than an arbitrary polynomial. It’s a lot easier to calculate than using the error function (erf) or the error function complement (erfc) that are in the solution to the diffusion equation for a diffusion problem that has an analytic solution. Most of the interesting problems don’t have an analytic solution and you have to use numerical methods. Hence, the use of an approximation in the IPCC report.
The coefficients and exponential time constants have nothing to do with the actual reservoirs. I may have said otherwise in my note. I’ve learned better since. Note that the time constants increase by approximately an order of magnitude for each term. For longer time scales, thousands of years for example, you would need an additional exponential term with a time constant on the order of 20,000 years in the approximation and the constant term would be smaller.
David Archer has a web version of the GEOCARB model if you want to play.
You can draw a recognizable elephant with four parameters providing those parameters are complex numbers, which makes it more like 8 actual parameters.
Seven parameters are not an issue if one is interpolating, as DeWitt seems to be saying is the case. Extrapolating is another story. So if the fit is interpolating the model results, it can be deemed a reliable representation of the model. The question then is whether the model provides a reliable extrapolation.
There are undoubtedly a number of parameters in the model itself, but they are likely determined by fitting to a number of independent data sets (CO2, concentration, isotope ratios, behavior of traces, etc.). So the total number of parameters is not really relevant. What matters is how well they are determined and the resulting accumulated error in the extrapolation. Likely considerable.
Mike M.
What extrapolation? The model is designed to calculate the amount of CO2 remaining in the atmosphere vs time for an instantaneous addition of a fixed mass of CO2. The fraction per year remaining looks like this:
1
0.874774431
0.810850811
0.773796358
0.748767683
0.729352906
0.712769869
0.697799641
0.683897154
0.670808408
0.658405688
0.646616587
0.635393417
0.624699998
0.614505922
0.604784044
0.595509363
So after sixteen years, 59.55% of the original addition is still in the atmosphere. We have estimates of CO2 emissions in gigatonnes going back to 1850, including the estimate of the effect of land use/land cover changes. So in 1850, the concentration of atmospheric CO2 is the concentration in 1849 CO2(1849) plus GtCO2(1850)/2130GtCO2/ppmv. In 1851, it’s CO2(1849) + (GtCO2(1850)*0.874774431 + GtCO2(1851))/2130, etc. Up to about 1940, the agreement with ice core data is pretty good. Then the measured CO2 flattens for a few years and starts rising again. That’s the so-called ‘missing sink’. Interestingly enough, it corresponds more or less to the beginning of mass production of nitrogen containing fertilizer. But even if you don’t adjust the emission data, the shape of the curve is still a good match. It’s just offset a few years.
By the way, anyone who thinks there’s a problem with the measured atmospheric CO2 concentration at Muana Loa and other sites like Barrow, AK and Antarctica should read Ferdinand Englebeen’s page. And the gas age vs ice age phenomenon in ice core data is also well understood. In the Vostok data, at the glacial maximums, the snow deposition rate is so low that the gas age in the trapped bubbles is thousands of years younger than the age of the ice surrounding the bubbles.
Btw, I can model the year to year change in Muana Loa data with two parameters. I calculated the fit several years ago, I forget exactly when. The difference between measured and fitted data in 2014 was 0.09ppmv.
DeWitt Payne,
You wrote: “What extrapolation?” then you described an extrapolation procedure. That extrapolation. Lacking a firm, comprehensive physical model, using data from the past to predict the future is an extrapolation. And there is no such model for CO2.
Since when is 1850 the future?
The full Bern model is a firm, comprehensive physical model of the carbon cycle including the ocean and the biosphere. The equation in the IPCC report is a very good approximation to the result produced by the model for a specific situation, an instantaneous injection of CO2 into the system. And I wasn’t using data from the past to predict the future. I was using emission data from the past to compare to the historical record of atmospheric CO2.
Since the agreement was good and I don’t have access to the actual Bern Model, I then use the approximation with future emission scenarios to estimate what might happen. That’s neither an extrapolation.or a projection because it doesn’t use current trends. And in the specific instances of freezing emissions at the 2005 level or half the 2005 level, it was completely hypothetical as that didn’t happen.
The point is still that freezing emissions at anywhere near current levels will not result in stabilizing atmospheric CO2 concentration at the present level or any time soon.
Do you disagree with that statement, and if so, on what grounds?
DeWitt,
The problem I have with the multi-pool exponential model for CO2 uptake is that it seems to me not a good description of the actual processes involved. The increase in the rate of plant uptake is to a first approximation a linear function of atmospheric CO2 concentration…. but eventually one that will stop responding (what is the average lifetime of a tree?), and nobody really knows what that trajectory will look like. A longer growing season will add to plant uptake, especially at high lattitudes, but how much? I doubt anyone knows. The ocean uptake consists of two parts: diffusional absorption and thermohaline pumping. To a first approximation, thermohaline pumping is independent of diffusional absorption, and should linearly increase in proportion to the diference in atmospheric CO2 between today and the atmospheric CO2 when water in upwelling regions last was in contact with the atmosphere…. say 1000 years ago or more. Thermohaline pumping seems to me nothing like an exponential decay function, so modeling with exponential decay could be very far from correct.
Like you, years ago I modeled historical CO2 (WUWT) with a two-parameter model: a constant multiplied by the difference between the present atmospheric concentration and the pre-industrial concentration, and a second constant multiplied by the year-on year change in ocean surface temperature to account for outgasing of CO2 from surface waters. The simple model fit the historical CO2 concentration pretty well, even though the model is clearly missing exponential saturation of some sinks. I guess the point is that I don’t put much faith in the Bern model, because I suspect that it does not accurately model the important physical processes. If I had to bet, I’d bet that in the long term the rate of uptake will be higher than the Bern model projects.
DeWitt Payne,
“The full Bern model is a firm, comprehensive physical model of the carbon cycle including the ocean and the biosphere.”
No it is not, because, as stevefitzpatrick points out, many of the processes included are not understood. Guesswork is not a firm foundation for a model or an extrapolation.
“The point is still that freezing emissions at anywhere near current levels will not result in stabilizing atmospheric CO2 concentration at the present level or any time soon.
Do you disagree with that statement, and if so, on what grounds?”
I disagree on the grounds that the statement is not what has been under discussion, since no one made that claim. Frank and Steve made a claim about the effect of a 50% reduction. If you change the statement to whether a 50% cut would stabilize atmospheric CO2, then there is the question of what “stabilize” means. If it means zero further increase, then I agree that 50% is not enough. I said so earlier and I think that others in this thread did so as well. If stabilize means “greatly slow down the increase”, then I think that it might.
But I thought the point of what was being argued was first that we don’t know how big a cut beyond that is needed and second that we don’t know how fast the subsequent increase might be, other than that it would be much slower than without such a cut. Some are advocating an 80% cut, but the case for that is iffy, even if we ignore the cost. A 50% cut may well be sufficient, even if we assume that we must not get anywhere near double CO2. And that assumption is questionable. A veritable mountain of untenable claims and assumptions.
SOD: Although I agree with Nic you haven’t dealt with dispatchability and backup, this was still one of your finest posts. Despite what I have seen about leveled costs, I never would have guessed your convincing conclusion until I read it. The world is not one size fits all.
The current cost of storing and regenerating electrical energy (through pumped storage for example) roughly doubles the cost. So you might estimate a worst case price for the non-dispatchability of wind by simply doubling the numbers you have calculated. Those who believe we can get the vast majority of our electricity from wind and solar probably should be doubling the cost to account for storage.
Pumped storage is not possible in most locations. You need a lot of water and sufficient elevation change. Doubling the cost to account for storage is a wildly optimistic estimate.
DeWitt: I tend to agree with you. Doubling the cost to account for storage costs is about the best one can expect in an optimal location with using 100% renewables. Apparently pumped storage is available on about half of the dams in the Alps to store excess German solar production in the summer. And it is being used profitably elsewhere. Improved technology for converting surplus electrical energy to storable or transportable chemical (H2, CH4) might contribute.
http://www.withouthotair.com/c26/page_191.shtml
Central planners expect to confiscate the storage capacity in my electric vehicle for grid storage, decreasing its lifetime and reliability! During the gas crisis in the 1970’s, everyone drove around with full tanks of gas, making the crisis far worse. During shortages of renewable power, I’m certainly not going to leave my fully charged car plugged into the grid.
http://www.d.umn.edu/~pfarrell/Soils/Readings/climate%20opinion.pdf
Some 356 gigatons of carbon has been emitted by people in the last century and a bit. Some half of that remains in the atmosphere? So we can remove 50% of the remainder simply by better practices that make money, conserve water and soils and produce less impact on downstream environments?
We may also address nitrous oxide and methane – most of which comes from agriculture – as well as the emissions from land degradation. Some 39% of total greenhouse gas emissions. Synergistic effects of improved agriculturqal productivity are improved education and health outcomes through richer and more resilient economies – and a reduction on black carbon from the open fores that billions of people still cook on.
The alternative seems to be hugely expensive wind and solar that has the potential to reduce climate forcing by maybe 10% in a few decades? The insanity of this seems palpable.
[…] « Renewables XI – Cost of Gas Plants vs Wind Farms […]
DeWitt: If I’ve been made what you think is a patronizing remark, you don’t need to be any more polite to me than the rules of this blog require. I appreciate that you take the time to share your expertise. I think we sparked an interesting discussion on just how bad a 50% cut in emissions would be (and corrected my naive assumption that most additional 30% was needed because of growing emissions from less developed countries). My initial remarks were overly simplistic, but still I think the answer is shrouded in uncertainty and models with poorly understood parameters. Your link to the Bern model was illuminating. I’ve also considered stabilizing emissions at 50% of today’s levels for a few decades rather than a century of more. Like it or not, there is probably a finite amount of economically recoverable fossil fuel to burn and how much will remain in the atmosphere if we burn it all.
From greentech media a quote from the CEO at NexEra (a big power company)
http://www.greentechmedia.com/articles/read/NextEra-on-Storage-Post-2020-There-May-Never-be-Another-Peaker-Built-in-t?utm_source=Daily&utm_medium=Newsletter&utm_campaign=GTMDaily
“Robo said that he and his team expect energy storage prices to experience a similar cost plunge to that of solar costs over the last seven years. If that happens, energy storage will be competitive with gas peaker plants.”
Basically, the upshot of the story is that the CEO thinks that energy storage will be competitive with gas for very short term load balancing and they are putting 100 million towards that end. The time frames they were looking at covering with storage were very short, but Robo said later in the article that they were looking at up to 4hr time frames.
Of course anyone can say anything. But 100 million is a fair bit of skin the in the game!
And if pigs had wings they could fly, or maybe not.
I’ll believe a massive drop in energy storage prices when it happens, not some CEO’s hype that looks to be mainly targeted at Wall Street stock analysts. Since there aren’t significant economies of scale for battery manufacture like there are for solar panels, the only way for battery storage cost reduction is a drastic increase in cycle life. And you still have a substantial initial capital investment. Again, I’m not holding my breath.
And that’s not to mention that at least some of the price drop in solar panels is because China has probably been selling solar panels below cost. That’s the same trick they pulled to drive everyone else out of rare earth element production.
Robo’s claims sound like hype to me.
DeWitt Payne wrote ” Since there aren’t significant economies of scale for battery manufacture like there are for solar panels, the only way for battery storage cost reduction is a drastic increase in cycle life.”
I think that’s right. Maybe there could be a factor of two drop in cost, but that won’t do the job unless lifetime gets up to maybe 10,000 cycles. That will likely require a technological breakthrough.
Even that won’t be enough to deal with the variations in wind. Those are much larger than diurnal variations in demand, in terms of percentage. And the time scale for smoothing is several days for wind. So the storage requirements are at least an order of magnitude larger for smoothing wind production than for smoothing demand. If we build as many wind turbines as the greens want, we will need more peaking plants, not fewer.
Rob MacDonald wrote: “But 100 million is a fair bit of skin the in the game!”.
Well, it is less than 1% of NextEra’s annual revenues. And it might be an expression of confidence in the availability of subsidies more than in the technology.
Storage has huge value.
Anyone who has spent some time looking at current conventional energy supply can see high value.
Anyone who has spent some time looking at wind and solar can see massive value.
I’m sure 100s or 1000s of companies will raise capital based on the potential, burn through it, and go out of business. I think I read about one in the last few days (not yet out of business but clearly heading that way).
During this process, in fact a key part of this process, is lots of hype to raise investor excitement and therefore $$$, and, in this industry, lots of hype to also get government funding.
Out of it might come a few companies with genuine breakthroughs. Such is the genius of capitalism.
We will try and look at the value of storage soon. Most stories of renewables becoming the dominant supply (including papers) usually contain some mushy sentences about “demand side improvements and smart grids” and “affordable storage”. There is a reason why.
But just because a given company has raised $X Million it doesn’t tell you anything about their product potential, only about:
1. the perceived industry potential, and
2. the salepersonship of the CEO
Buyer beware.
DeWitt: I promise never to accuse you of holding your breath.
CEO’s hyping? Yup: https://scienceofdoom.com/2015/08/30/renewables-vii-feasibility-and-reality-geothermal-example/
They key point is that in certain situations people will pay big bucks for kWh’s. How much do you pay for a 9V battery per kWh?
Assuming I was stranded on a desert island with nothing but a coconut and a high speed internet connection, let’s say I wanted to judge the plausibility of CEO X’s statement, as translated by a reporter…
It looks like you can buy a 10kWhr battery that can put out 2kW continuous for $3500. I’m talking about the power wall. If you run the numbers between a model S 60 and a model S 85 you get about the same price. We’d also need an inverter and some other fun stuff. So lets make a ROM estimate that our installed costs for a 10kWhr system is $7000, or $700000 per MWhr. Note, per name plate (if you believe the spec) we can deliver a full MW of power for 1 hr. To be safe, let’s say we really need $1000000 per MWhr installed, capable of delivering 1MW for 1 hr.
Here I find peak rates as high as $500/MWhr http://www.eia.gov/electricity/wholesale/index.cfm#history
Is that way off? I’m no expert, but let’s use it.
Then assuming that our plant gets to run 1 hr per day, 365/yr, that is less than a 5yr pay back on the cap ex.
those numbers are all just pie in the sky I pulled together on my lunch hour. But at least it doesn’t look 3 orders of magnitude off from reality. Maybe just 1 or two!
Would love to hear from someone more knowledgeable on this, but that person probably makes lots of money and had better things to do at lunch than banter about work.
It better pay back in 5 years. Assuming a full charge/discharge daily, that’s 1825 cycles. Your batteries are likely dead in five years, if you’re lucky. And before then, the capacity will be less than it was when the batteries were new. You can approximately double the battery life if you buy twice as many batteries, but you’re still in the same boat. As I said, for practical use, a large increase in the cycle life of storage batteries is needed.
The reason that the batteries in hybrids last a long time is that they only use about 10% of the total capacity in the sweet spot of the lifetime curve. Which turns out to be between 45 and 55% capacity.
Rob MacDonald,
But the high prices are a small fraction of the total and are likely bunched in space and time. So storage at any given location could only rarely take advantage of such prices. The daily price variation at any given site is likely an order of magnitude smaller, at least for any significant volume. So not 3 orders of magnitude from reality, but quite possibly 2. And a factor of ten is likely enough that it is not going to happen without a breakthrough/
[…] Renewables XI – Cost of Gas Plants vs Wind Farms […]