In a number of earlier articles we looked at onshore wind because it is currently the lowest cost method of generating renewable electricity.
The installed onshore wind capacity (nameplate) in Europe at the start of 2015 was 121 GW. By comparison the offshore wind capacity (nameplate) by comparison was 8 GW. (Both figures from EWEA).
For recap – “nameplate” means what a wind turbine will produce at full capacity. A typical onshore wind farm in Europe will produce something like 16-30% actual output over the course of the year. If you pick some great locations in Oklahoma, you might get over 40%. It all depends on the consistency and speed of the wind. The actual output as a percentage of the nameplate capacity is usually given the term “capacity factor”. This isn’t some big disadvantage of wind – ‘it “only” produces 30% of its supposed capacity‘ – on the contrary, it’s just terminology. But it is important to check what value you are seeing in press releases and articles – so when you see that Europe has 121 GW of onshore wind installed, it usually means “nameplate”. And so the actual production of electricity, depending on location, will be something like 25-50 GW averaged over the year. End of recap..
There are three big advantages of offshore wind. And these are the reasons why a lot of money is being poured into offshore wind in Europe:
- the intermittancy is lower – the wind blows more consistently
- the capacity factor is higher – you get more out of your turbine, because the offshore wind speed is higher
- they aren’t parked 300m from the houses of voters
In the last article XIV – Minimized Cost of 99.9% Renewable Study we saw an interesting point from one study – when storage costs were high (actually quite low, but higher than a “possible” super-low rental cost of storage from future owners of electric cars) the lowest cost method of building out the PJM network (eastern US) included a large portion of offshore wind.
This is the key to understanding the first major appeal of offshore. Intermittancy has a cost – something we will come back to again – that is a little difficult to quantify. You can smooth out the peaks and troughs by installing wind farms over a wide area, but you can’t eliminate the fact that at certain times in a given 10-year period there will be almost no wind for a week. Of course, it depends on the region, but so far even potential “super-grids” have a week’s down time (see XII – Windpower as Baseload and SuperGrids and also VIII – Transmission Costs And Outsourcing Renewable Generation)
Offshore gives you more consistent electricity production and less intermittancy.
The second point – more electricity on average from a given nameplate turbine – only helps when we consider the actual cost of different wind installations. Let’s say we put 1 GW of wind turbines onto land and these get a capacity factor of 25% – we get, on average, 250 MW. That is, across the year we get 2,190 GWh (0.25GW x 8760). Now we put 1 GW of nameplate offshore wind turbines into coastal water and we get a capacity factor of 40% on average – that is, 400 MW. So across the year we get 3,504 GWh (0.4 x 8760). This increased capacity factor only helps if the cost of installing the 1 GW of turbines offshore is less than 60% more expensive. Unfortunately, this is not the case (at the moment).
The third point is of great interest in Europe. Germany, Spain, the UK and Ireland have been installing a lot of onshore wind turbines. These are highly populated countries. For a later article, producing say 50% of each of these country’s electricity requires a lot of land area. Of course, the footprint on the actual land is quite small, but each turbine has to be some distance from every other turbine. This means that producing 15 GW of electricity from wind in the UK (about half of the average) would take up a lot of land area. The problem is more acute in Germany with a lower capacity factor.
So, those are the upsides. Now let’s look at the price tag. “If you have to ask, you can’t afford it..”
In an earlier article – IX – Onshore Wind Costs – we looked at the capex cost of onshore wind and (by the time we get into the comments) we find a current capital cost of about €1M per 1MW of (nameplate) capacity. There are lots of different numbers cited, but let’s use that for now. For people more familiar with the greenback, this is about US$1.2M per 1MW.
EWEA gives a current price tag for capex cost of offshore of €2.8 – €4.0M per 1MW of (nameplate) capacity. A larger proportion of the capital cost of offshore is the installation.
Remember that we have to factor in the “capacity factor”. So the capital cost of offshore is not 3-4x the onshore cost. If we calculate the cost based on the actual production of electricity then onshore costs (capex) something like €4M per 1MW of output and offshore costs (capex) something like €7-8M per 1MW – roughly double.
Now, we can be relatively sure of capital costs because there are enough datapoints and current installations. Governments publish figures when they are paying. Suppliers give out indicative pricing. Customers give out data on contracts.
But there are big questions about maintenance costs and, unlike onshore wind with a lot of data, this is still a little shrouded in mystery. I’ve consulted a lot of sources but it seems that, with only 9GW of offshore wind constructed in Europe – and much of this very recent – there is not enough public data to confirm any estimates.
One point only is clear (as you might expect) it is “quite a bit more” than the maintenance costs of onshore wind. The marine environment impacting on the equipment combined with the hazards of getting maintenance people out on the ocean.
So far it seems that offshore has some maintenance issues that are hard to cost up. It’s an industry still in its infancy.
Of course, to get more funding, many confident predictions are made: “Offshore wind will be cheaper than gas plants by 2020.”
Without confident predictions, maybe no one will fund the next 5 years of development. I don’t want to delve any deeper into spruiking. Let’s just accept that most of what passes for discussion in the general media, repeated on many blogs, is simply press releases from governments, lobby groups and big companies, mostly repeated without any fact checking.
It’s quite possible that offshore wind will be much lower in 2020 than it is today. There are a lot of installation issues that might be improved with the combination of volume of installations, time on the job and engineering improvements. It’s also quite possible that offshore wind won’t be a lot lower in 2020 than it is today. (See points made in Renewable Energy I).
Here is IRENA for just 2 years:
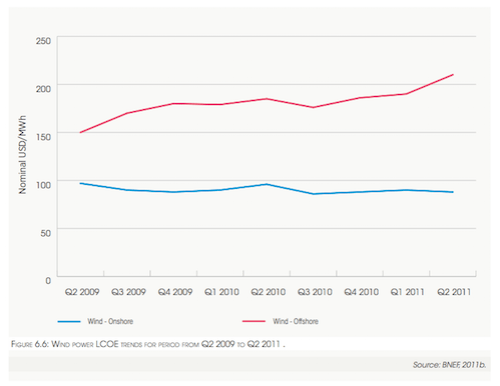
From IRENA 2012
And UKERC Offshore costs from a 2012 document:
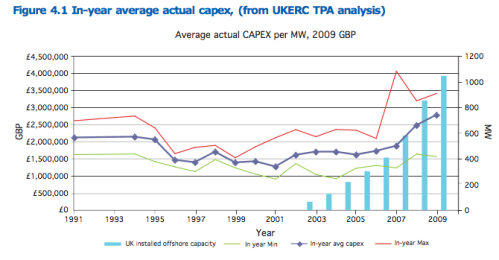
From UKERC 2012
And another from a different UKERC document, attempting to learn from experience, with reference to wind power cost projections vs how the world actually turned out:
In the short-term costs may rise before they can fall. Cost reductions from learning can be overwhelmed in the short-term by supply chain bottlenecks, build delays and ‘teething trouble’, for example lower than expected reliability at first. There is historical precedent for technologies deployed in the power sector to demonstrate cost increases during early commercialisation before supply chains and learning from experience are firmly established
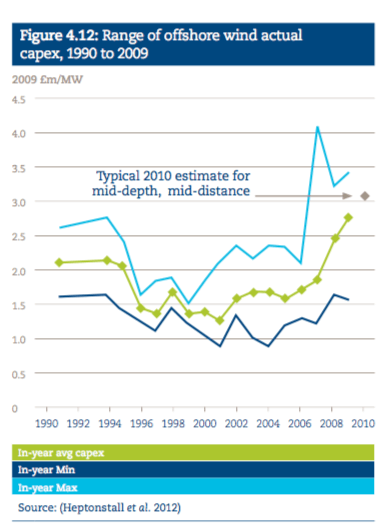
From UKERC 2013
These graphs are only presented as a reminder that predictions don’t always come true. Engineering problems are hard and optimism is easy.
I’m sure offshore wind costs will come down in the long run, but as Keynes usefully reminded us, in the long run we are all dead. So “the long run” is not so useful. Whether offshore costs will come down to onshore costs in a reasonable time frame, and whether – in this time frame – they will further come down to the cost of gas turbine electricity production is open to question. Time will tell.
I’m generally an optimist. The glass is half full. Probably it’s almost full. And lots of people don’t have much, so my glass is anyway pretty amazing. It’s only the weight of blog world articles and media (lobby groups press releases) articles on this subject that compels me to remind readers that confident predictions of the future may not be correct.
Lots of sources quote LCOE (levelized cost of electricity) – this “adds” capital cost, factored by the cost of capital (interest rates), to maintenance costs and energy costs (when we consider conventional power stations with fuel costs). As explained in previous articles, this LCOE is not so useful (i.e., it’s misleading) when we consider intermittent renewables vs dispatchable conventional electricity.
As a rule of thumb consider offshore capex wind costs to be “about double” onshore wind costs, and offshore maintenance costs to be somewhat unknown, but definitely higher than onshore costs.
These rules of thumb are as much as I have been able to establish so far.
References
Wind in Power 2014 European Statistics, published February 2015 by European Wind Energy Association (EWEA)
Renewable Energy Technologies: Cost Analysis Series, Volume 1: Power Sector, Issue 5/5, Wind Power, IRENA (International Renewable Energy Agency), June 2012
Presenting the Future: An assessment of future costs estimation methodologies in the electricity generation sector, UKERC (2013)
UKERC Technology and Policy Assessment, Cost Methodologies Project: Offshore Wind Case Study, UKERC (2012)
Articles in this Series
Renewable Energy I – Introduction
Renewables II – Solar and Free Lunches – Solar power
Renewables III – US Grid Operators’ Opinions – The grid operators’ concerns
Renewables IV – Wind, Forecast Horizon & Backups – Some more detail about wind power – what do we do when the wind goes on vacation
Renewables V – Grid Stability As Wind Power Penetration Increases
Renewables VI – Report says.. 100% Renewables by 2030 or 2050
Renewables VII – Feasibility and Reality – Geothermal example
Renewables VIII – Transmission Costs And Outsourcing Renewable Generation
Renewables IX – Onshore Wind Costs
Renewables X – Nationalism vs Inter-Nationalism
Renewables XI – Cost of Gas Plants vs Wind Farms
Renewables XII – Windpower as Baseload and SuperGrids
Renewables XIII – One of Wind’s Hidden Costs
Renewables XIV – Minimized Cost of 99.9% Renewable Study
Renewables XV – Offshore Wind Costs
Renewables XVI – JP Morgan advises
Renewables XVII – Demand Management 1
Renewables XVIII – Demand Management & Levelized Cost
Renewables XIX – Behind the Executive Summary and Reality vs Dreams


