Recap
In Part I and IV – Wind, Forecast Horizon & Backups we looked at a few basics, including capacity credit which is basically how much “credit” the grid operator gives you for being there. If you are a 1GW coal-fired power station you probably get around 850MW – 900MW capacity credit. This reflects the availability that your power generation offers. The grid operator needs to ensure the region or country can meet the demand in any given second, minute, hour, day, week, month and year.
And so the grid operator’s calculation is a statistical one – given a “fleet” (always a strange name to me for such immobile units) of generating units how can we be sure that we can meet demand in every minute of the year? Conventional generation (gas, coal, nuclear) is mostly “dispatchable” – which means that, apart from unexpected outages, you can choose to run the gas plant or nuclear power station when you want.
Wind power, on the other hand, is not dispatchable. And it turns out that its capacity credit, as a proportion of actual capacity, reduces significantly as its penetration into the network increases. Another way of saying it is that wind is less reliable than conventional generation at any given point in time and this problem gets worse the more wind power you have available.
However, this doesn’t present some insuperable obstacle to using wind. What it means at the moment in various countries is that you can use windpower when the wind is blowing, and when it’s not blowing (or not much) you can crank up a gas plant. As wind power penetration grows in a given network the variability of this ever larger power source must result in less efficiency of the conventional units operating at part load or in reserve. Everyone agrees on this point. However, in this series so far we have not reviewed any actual papers or data on the loss of efficiency – something to look forward to.
Baseload Power
On a different point – the focus of this article – the intermittency of windpower raises an important question, especially as it is the cheapest source of renewable energy (given that hydro is “tapped out” in most developed countries).
Is it possible to generate base load power from wind?
If not, then there is clearly a limit to the growth of wind power. (We have already covered some real problems of high wind power penetration in V – Grid Stability As Wind Power Penetration Increases – those problems haven’t gone away). This is related to the question of the maximum reduction in GHG emissions from electricity generation while “keeping the lights on”.
Generally we can think of increasing wind power in a region as creating a benefit and a problem:
- the benefit – more wind power usually means more geographical dispersion which averages out peaks and troughs (see IV – Wind, Forecast Horizon & Backups)
- the problem – more wind power means peaks and troughs cause more problems for the grid (a 100MW unforecast fluctuation over a few hours is easily dealt with in most countries, but a 5GW unforecast fluctuation is more problematic)
So.. on with this article..
In Czisch & Ernst (2001), the authors consider a massive area wind power network. I don’t believe this paper is a complete answer because some questions are unanswered, but the idea is instructive.
As they state:
Europe currently has by far the highest installed wind power capacity of all regions in the world. However, this is not due to Europe being the best possible place to build wind power, but rather to a favourable political climate
It is a slightly different take on the question I asked in X – Nationalism vs Inter-Nationalism – why is Germany building windfarms in Germany instead of places with lots of wind?
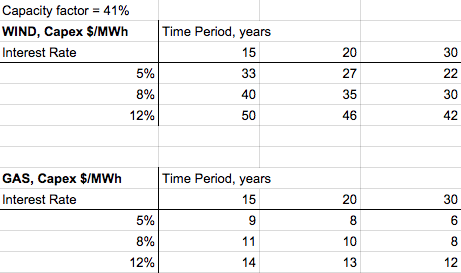
In the graph below “Full Load Hours/Year” is basically a way of showing capacity factor (not to be confused with capacity credit). Capacity factor is average output/nameplate and depends how much wind you get – across the UK capacity factor is just over 30%, in Germany it is around 18%, in Oklahoma, maybe 41%.
In this genre of papers it’s common to dispense with the crazy idea of percentages – who can understand them? Instead of percentages, let’s use the much more intuitive idea of the output expressed as if the wind farm ran at full load for x number of hours in the year. So 2100 full load hours = the old school 24% (2100/8760)..
Anyway, via color coding (which at least follows a familiar pattern), we see why Ireland and the north of the UK has a windfarm advantage, along with European and African coastal regions:
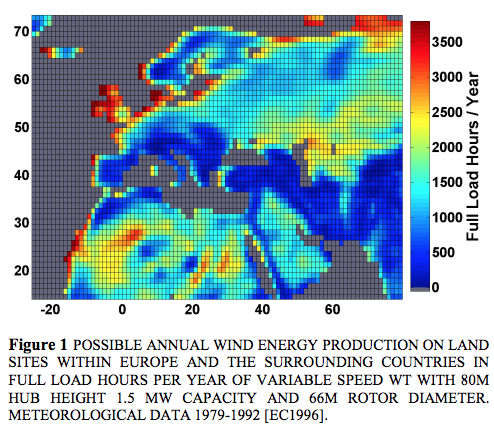
From Czisch & Ernst 2001
Figure 1
The data above is based on wind speeds taken from reanalysis data (from ECMWF). “Reanalysis” is basically a blend of data and models filling in the blanks where data doesn’t exist. (See Water Vapor Trends under the sub-heading “Filling in the Blanks”).
Then they look at the correlation between different sites, based on actual measurements.
For people new to wind power, a low correlation is good. A high correlation is bad. Why? If you have 1000x 3MW wind turbines and the correlation of output power between the turbines is high then they will be producing 3GW some of the time, 1.5GW some of the time, and 0GW some of the time – their output power rises and falls in unison. If the correlation is low then they will be producing (for example) 1GW nearly all of the time – this is clearly much better – as one turbine slows down, another speeds up.
Low correlation implies sustained output. High correlation implies big peaks and troughs.
As we might expect – as the turbines get further apart their output power correlation reduces = good. For example, the wind in London is well correlated with the wind in Reading, England (60km apart), but not well correlated with the wind in Moscow (2,500 km apart).
And for any given geographical separation the correlation is higher (=bad) as we consider longer time periods. This is also expected. There might be considerable minute to minute fluctuation between two sites due to the turbulent nature of wind, but the average across 12 hours will be more correlated because the overall weather patterns cover bigger areas:
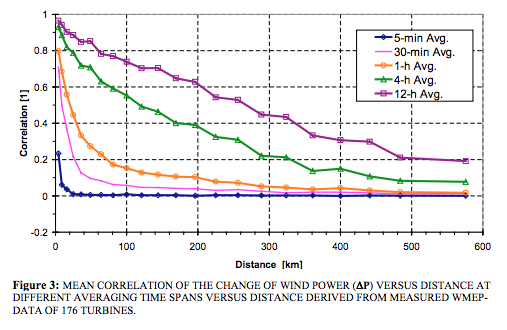
From Czisch & Ernst 2001
Figure 2
Super Grids
Now let’s look at longer time periods and longer distances (I don’t understand the dots in this graph):
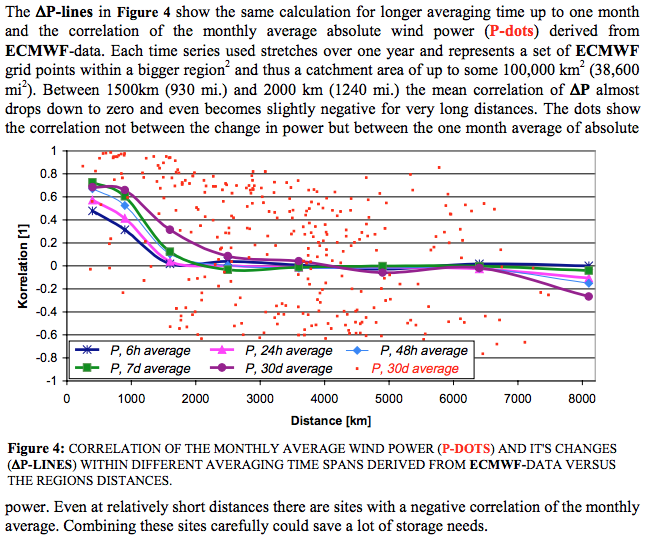
From Czisch & Ernst 2001
Figure 3
The paper goes on to select the best regions, place large hypothetical wind farms in those regions and calculate the wind farm output:
The potentials described in the above section altogether make a capacity of nearly 950 GW and close to 2800 TWh annual electricity production. This is more than the total demand of the EU countries plus Norway which was 2100 TWh in 1997. The average production exceeds 2900 full load hours.
Electricity consumption in the EU has increased a fair bit since 1997 – EU consumption in 2014 was about 2800 TWh (which for reference is about 320GW continuously) – I’m not sure if this represents economic growth, adding countries to the EU or both.
But the regions that they propose have more than sufficient wind to meet much higher output. The population density is low and wind potential is high in the regions they select. Unlike the places where most European wind power is being built at the moment (with high population density and low wind speeds).
The key lines in the graph are the red line = demand and the black line = supply for one scenario:
From Czisch & Ernst 2001
Figure 4
Discussion
To me their paper doesn’t quite complete the picture. They provide some more insights, including transmission and storage requirements, and propose providing baseload power but not peak power for the whole of the EU. Given the potential wind power in the regions they select it’s not clear what limits actually exist.
The questions seem straightforward:
- For a given scenario (nameplate per region) produce the usual graph of hourly output, not as a time-series, but in declining output order (e.g. fig 6 below), so we can see for how many hours the output drops below key values
- Calculate the actual nameplate capacity needed in the various production regions to ensure “Loss of Load Probability” (LOLP) below the standard 9 years per century (or some other metric)
Armed with this data we would be able to see the number of wind turbines required and the transmission requirements between each region. And what, if any, pumped hydro storage would be needed in addition. And what, if any, conventional backup generation would be needed.
In a scenario with wind power producing a large portion of EU energy any problems get amplified.
For example – and this is just my example – if we built a wind network to supply say 320GW it might be a nameplate capacity of 900GW (something like 450,000 wind turbines of 2MW). But if our analysis showed that individual regions at any given time would be supplying most of the load, the nameplate capacity of the whole system might need to be 3TW (1,500,000 wind turbines). If the system instead had gas power as a backup for say 10% of the time when the wind “super-system” dropped well below the demand, the fuel cost would be relatively low, but the construction cost would be very high for the power supplied – because we would have built 300GW of supply to run just 10% of the time.
Some of these ideas are taken up by other papers.
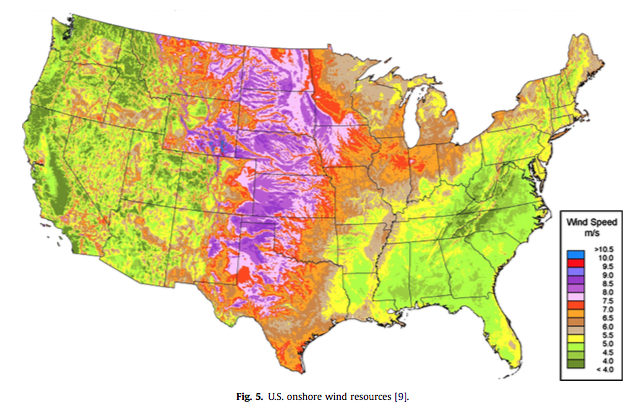
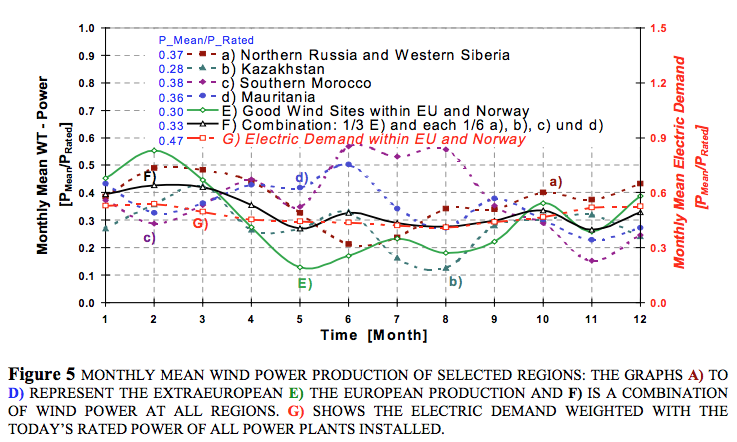
In Archer & Jacobson (2007) the authors look at the statistics of wind energy across 19 sites in the midwest of the USA:
In this study, benefits of interconnecting wind farms were evaluated for 19 sites, located in the Midwestern United States, with annual average wind speeds at 80 m above ground, the hub height of modern wind turbines, greater than 6.9 m/s (class 3 or greater). We found that an average of 33% and a maximum of 47% of yearly-averaged wind power from interconnected farms can be used as reliable, baseload electric power.

From Archer & Jacobson 2007
Figure 5
Unfortunately, their description of “reliable baseload power” indicates they are “having a laugh” – let’s hope they didn’t really mean it.
After noting the problem of intermittency of wind power they state:
On the other hand, because coal combustion can be controlled, coal energy is not considered intermittent and is often used as “baseload” energy. Nevertheless, because coal plants were shut down for scheduled maintenance 6.5% of the year and unscheduled maintenance or forced outage for another 6% of the year on average in the United States from 2000-2004, coal energy from a given plant is guaranteed only 87.5% of the year, with a typical range of 79-92% (NERC 2005, Giebel 2000).
And in their wind power analysis they are then content when their hypothetical system meets this 79% threshold, given that is the (minimum) benchmark for one coal-fired power station. Hopefully readers of this series can see the problem with this threshold. Grid operators provide baseload power by combining multiple units of dispatchable power. No one is under the illusion that one coal-fired power station is nirvana. This was probably true even 100 years ago in England. Grid operators provide some statistical inevitability of keeping the lights on by using more than one power station.
The real question we want to answer is whether combining ever more distant wind farms can actually provide baseload power to meet grid operator requirements and therefore replace a network of conventional power stations. And how many turbines in each of how many locations, what transmission capacity, and so on.
The key curves are given below, with the blue curve being the key one representing the combination of 19 sites, with output power placed in decreasing order. As we can see, moving from 1 to 7 to 19 sites increases our minimum output:

From Archer & Jacobson 2007
Figure 6
It’s a useful graph. In this example we would put up 19 wind farms in a wide area, with the furthest extremes separated by almost 900 km. And for 90% of the year we would get more than 13% of the nameplate output. And for 95% of the year we would get more than 10% of the output.
So does that mean we should build nameplate capacity at 10x our required demand, and provide gas plants to match demand for the 2½ weeks a year that the wind farms can’t keep up?
It’s half an answer, like the earlier paper we reviewed. At least it gives us the graph we need to see (figure 6, their figure 3) for this specific geographical distribution.
Conclusion
Baseload electric power is not an optional extra – unless the population decides to vote for it, which seems unlikely. It does seem possible that the right combination of wind farms across a super-grid might be a solution for most of the EU’s energy needs. It needs to be evaluated in more detail and costed.
If the statistics of wind power variability make this solution a possible contender, then the costs will be a minimum of $1-5TN plus transmission costs. Perhaps $2-10TN. Perhaps more. I’m just trying to get a broad idea of the cost.
For the EU this is not such a large amount. Germany has already spent more than €40BN just to get 10% of electricity from wind power.
If the EU is serious about decarbonizing electricity generation then putting up wind turbines in Germany and central Europe – instead of investigating a European super-grid capitalizing on the best regions – is possibly a monumental failure of policy (maybe this subject has already been discussed and discarded).
Articles in this Series
Renewable Energy I – Introduction
Renewables II – Solar and Free Lunches – Solar power
Renewables III – US Grid Operators’ Opinions – The grid operators’ concerns
Renewables IV – Wind, Forecast Horizon & Backups – Some more detail about wind power – what do we do when the wind goes on vacation
Renewables V – Grid Stability As Wind Power Penetration Increases
Renewables VI – Report says.. 100% Renewables by 2030 or 2050
Renewables VII – Feasibility and Reality – Geothermal example
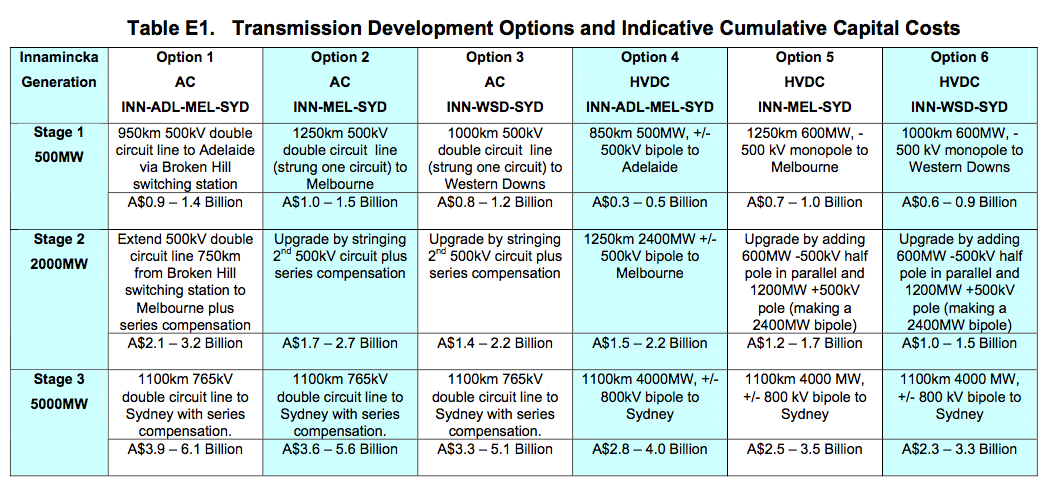
Renewables VIII – Transmission Costs And Outsourcing Renewable Generation
Renewables IX – Onshore Wind Costs
Renewables X – Nationalism vs Inter-Nationalism
Renewables XI – Cost of Gas Plants vs Wind Farms
Renewables XII – Windpower as Baseload and SuperGrids
Renewables XIII – One of Wind’s Hidden Costs
Renewables XIV – Minimized Cost of 99.9% Renewable Study
Renewables XV – Offshore Wind Costs
Renewables XVI – JP Morgan advises
Renewables XVII – Demand Management 1
Renewables XVIII – Demand Management & Levelized Cost
Renewables XIX – Behind the Executive Summary and Reality vs Dreams
References
High wind power penetration by the systematic use of smoothing effects within huge catchment areas shown in a European example, Czisch & Ernst, Windpower (AWEA), 2001
Supplying baseload power and reducing transmission requirements by interconnecting wind farms, CL Archer & MZ Jacobson, Journal of Applied Meteorology and Climatology (2007)