Feeds:
Posts
Comments

Archive for June, 2014

Over the last few years I’ve written lots of articles relating to the inappropriately-named “greenhouse” effect and covered some topics in great depth. I’ve also seen lots of comments and questions which has helped me understand common confusion and misunderstandings.

This article, with huge apologies to regular long-suffering readers, covers familiar ground in simple terms. It’s a reference article. I’ve referenced other articles and series as places to go to understand a particular topic in more detail.

One of the challenges of writing a short simple explanation is it opens you up to the criticism of having omitted important technical details that you left out in order to keep it short. Remember this is the simple version..

Preamble

First of all, the “greenhouse” effect is not AGW. In maths, physics, engineering and other hard sciences, one block is built upon another block. AGW is built upon the “greenhouse” effect. If AGW is wrong, it doesn’t invalidate the greenhouse effect. If the greenhouse effect is wrong, it does invalidate AGW.

The greenhouse effect is built on very basic physics, proven for 100 years or so, that is not in any dispute in scientific circles. Fantasy climate blogs of course do dispute it.

Second, common experience of linearity in everyday life cause many people to question how a tiny proportion of “radiatively-active” molecules can have such a profound effect. Common experience is not a useful guide. Non-linearity is the norm in real science. Since the enlightenment at least, scientists have measured things rather than just assumed consequences based on everyday experience.

The Elements of the “Greenhouse” Effect

Atmospheric Absorption

1. The “radiatively-active” gases in the atmosphere:

  • water vapor
  • CO2
  • CH4
  • N2O
  • O3
  • and others

absorb radiation from the surface and transfer this energy via collision to the local atmosphere. Oxygen and nitrogen absorb such a tiny amount of terrestrial radiation that even though they constitute an overwhelming proportion of the atmosphere their radiative influence is insignificant (note 1).

How do we know all this? It’s basic spectroscopy, as detailed in exciting journals like the Journal of Quantitative Spectroscopy and Radiative Transfer over many decades. Shine radiation of a specific wavelength through a gas and measure the absorption. Simple stuff and irrefutable.

Atmospheric Emission

2. The “radiatively-active” gases in the atmosphere also emit radiation. Gases that absorb at a wavelength also emit at that wavelength. Gases that don’t absorb at that wavelength don’t emit at that wavelength. This is a consequence of Kirchhoff’s law.

The intensity of emission of radiation from a local portion of the atmosphere is set by the atmospheric emissivity and the temperature.

Convection

3. The transfer of heat within the troposphere is mostly by convection. The sun heats the surface of the earth through the (mostly) transparent atmosphere (note 2). The temperature profile, known as the “lapse rate”, is around 6K/km in the tropics. The lapse rate is principally determined by non-radiative factors – as a parcel of air ascends it expands into the lower pressure and cools during that expansion (note 3).

The important point is that the atmosphere is cooler the higher you go (within the troposphere).

Energy Balance

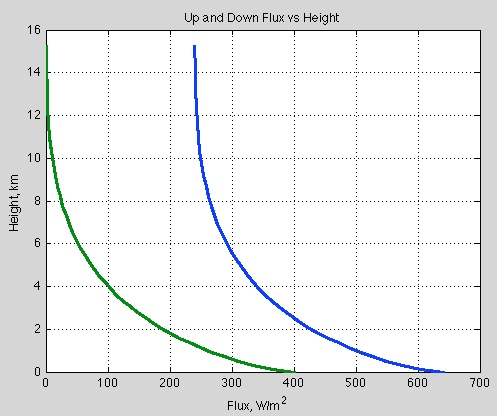
4. The overall energy in the climate system is determined by the absorbed solar radiation and the emitted radiation from the climate system. The absorbed solar radiation – globally annually averaged – is approximately 240 W/m² (note 4). Unsurprisingly, the emitted radiation from the climate system is also (globally annually averaged) approximately 240 W/m². Any change in this and the climate is cooling or warming.

Emission to Space

5. Most of the emission of radiation to space by the climate system is from the atmosphere, not from the surface of the earth. This is a key element of the “greenhouse” effect. The intensity of emission depends on the local atmosphere. So the temperature of the atmosphere from which the emission originates determines the amount of radiation.

If the place of emission of radiation – on average – moves upward for some reason then the intensity decreases. Why? Because it is cooler the higher up you go in the troposphere. Likewise, if the place of emission – on average – moves downward for some reason, then the intensity increases (note 5).

More GHGs

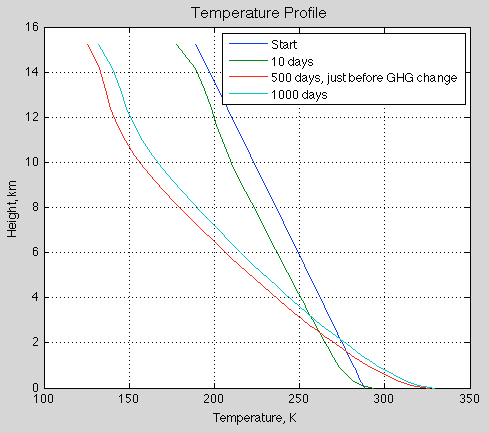
6. If we add more radiatively-active gases (like water vapor and CO2) then the atmosphere becomes more “opaque” to terrestrial radiation and the consequence is the emission to space from the atmosphere moves higher up (on average). Higher up is colder. See note 6.

So this reduces the intensity of emission of radiation, which reduces the outgoing radiation, which therefore adds energy into the climate system. And so the climate system warms (see note 7).

That’s it!

It’s as simple as that. The end.

A Few Common Questions

CO2 is Already Saturated

There are almost 315,000 individual absorption lines for CO2 recorded in the HITRAN database. Some absorption lines are stronger than others. At the strongest point of absorption – 14.98 μm (667.5 cm-1), 95% of radiation is absorbed in only 1m of the atmosphere (at standard temperature and pressure at the surface). That’s pretty impressive.

By contrast, from 570 – 600 cm-1 (16.7 – 17.5 μm) and 730 – 770 cm-1 (13.0 – 13.7 μm) the CO2 absorption through the atmosphere is nowhere near “saturated”. It’s more like 30% absorbed through a 1km path.

You can see the complexity of these results in many graphs in Atmospheric Radiation and the “Greenhouse” Effect – Part Nine – calculations of CO2 transmittance vs wavelength in the atmosphere using the 300,000 absorption lines from the HITRAN database, and see also Part Eight – interesting actual absorption values of CO2 in the atmosphere from Grant Petty’s book

The complete result combining absorption and emission is calculated in Visualizing Atmospheric Radiation – Part Seven – CO2 increases – changes to TOA in flux and spectrum as CO2 concentration is increased

CO2 Can’t Absorb Anything of Note Because it is Only .04% of the Atmosphere

See the point above. Many spectroscopy professionals have measured the absorptivity of CO2. It has a huge variability in absorption, but the most impressive is that 95% of 14.98 μm radiation is absorbed in just 1m. How can that happen? Are spectroscopy professionals charlatans? You need evidence, not incredulity. Science involves measuring things and this has definitely been done. See the HITRAN database.

Water Vapor Overwhelms CO2

This is an interesting point, although not correct when we consider energy balance for the climate. See Visualizing Atmospheric Radiation – Part Four – Water Vapor – results of surface (downward) radiation and upward radiation at TOA as water vapor is changed.

The key point behind all the detail is that the top of atmosphere radiation change (as CO2 changes) is the important one. The surface change (forcing) from increasing CO2 is not important, is definitely much weaker and is often insignificant. Surface radiation changes from CO2 will, in many cases, be overwhelmed by water vapor.

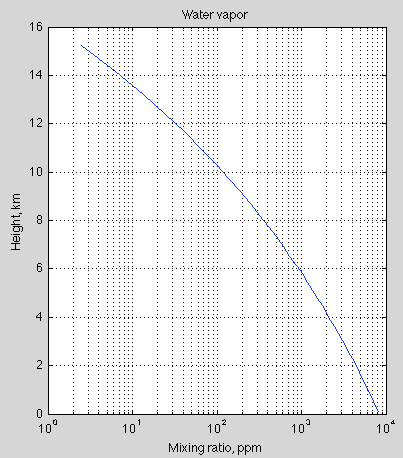
Water vapor does not overwhelm CO2 high up in the atmosphere because there is very little water vapor there – and the radiative effect of water vapor is dramatically impacted by its concentration, due to the “water vapor continuum”.

The Calculation of the “Greenhouse” Effect is based on “Average Surface Temperature” and there is No Such Thing

Simplified calculations of the “greenhouse” effect use some averages to make some points. They help to create a conceptual model.

Real calculations, using the equations of radiative transfer, don’t use an “average” surface temperature and don’t rely on a 33K “greenhouse” effect. Would the temperature decrease 33K if all of the GHGs were removed from the atmosphere? Almost certainly not. Because of feedbacks. We don’t know the effect of all of the feedbacks. But would the climate be colder? Definitely.

See The Rotational Effect – why the rotation of the earth has absolutely no effect on climate, or so a parody article explains..

The Second Law of Thermodynamics Prohibits the Greenhouse Effect, or so some Physicists Demonstrated..

See The Three Body Problem – a simple example with three bodies to demonstrate how a “with atmosphere” earth vs a “without atmosphere earth” will generate different equilibrium temperatures. Please review the entropy calculations and explain (you will be the first) where they are wrong or perhaps, or perhaps explain why entropy doesn’t matter (and revolutionize the field).

See Gerlich & Tscheuschner for the switch and bait routine by this operatic duo.

And see Kramm & Dlugi On Dodging the “Greenhouse” Bullet – Kramm & Dlugi demonstrate that the “greenhouse” effect doesn’t exist by writing a few words in a conclusion but carefully dodging the actual main point throughout their entire paper. However, they do recover Kepler’s laws and point out a few errors in a few websites. And note that one of the authors kindly showed up to comment on this article but never answered the important question asked of him. Probably just too busy.. Kramm & Dlugi also helpfully (unintentionally) explain that G&T were wrong, see Kramm & Dlugi On Illuminating the Confusion of the Unclear – Kramm & Dlugi step up as skeptics of the “greenhouse” effect, fans of Gerlich & Tscheuschner and yet clarify that colder atmospheric radiation is absorbed by the warmer earth..

And for more on that exciting subject, see Confusion over the Basics under the sub-heading The Second Law of Thermodynamics.

Feedbacks overwhelm the Greenhouse Effect

This is a totally different question. The “greenhouse” effect is the “greenhouse” effect. If the effect of more CO2 is totally countered by some feedback then that will be wonderful. But that is actually nothing to do with the “greenhouse” effect. It would be a consequence of increasing temperature.

As noted in the preamble, it is important to separate out the different building blocks in understanding climate.

Miskolczi proved that the Greenhouse Effect has no Effect

Miskolczi claimed that the greenhouse effect was true. He also claimed that more CO2 was balanced out by a corresponding decrease in water vapor. See the Miskolczi series for a tedious refutation of his paper that was based on imaginary laws of thermodynamics and questionable experimental evidence.

Once again, it is important to be able to separate out two ideas. Is the greenhouse effect false? Or is the greenhouse effect true but wiped out by a feedback?

If you don’t care, so long as you get the right result you will be in ‘good’ company (well, you will join an extremely large company of people). But this blog is about science. Not wishful thinking. Don’t mix the two up..

Convection “Short-Circuits” the Greenhouse Effect

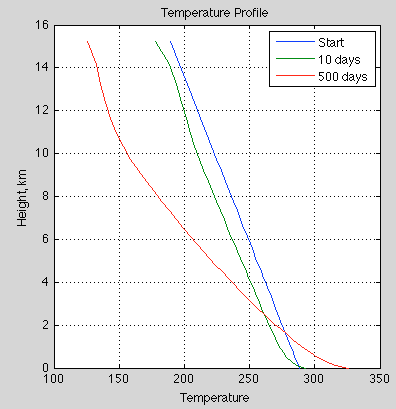
Let’s assume that regardless of the amount of energy arriving at the earth’s surface, that the lapse rate stays constant and so the more heat arriving, the more heat leaves. That is, the temperature profile stays constant. (It’s a questionable assumption that also impacts the AGW question).

It doesn’t change the fact that with more GHGs, the radiation to space will be from a higher altitude. A higher altitude will be colder. Less radiation to space and so the climate warms – even with this “short-circuit”.

In a climate without convection, the surface temperature will start off higher, and the GHG effect from doubling CO2 will be higher. See Radiative Atmospheres with no Convection.

In summary, this isn’t an argument against the greenhouse effect, this is possibly an argument about feedbacks. The issue about feedbacks is a critical question in AGW, not a critical question for the “greenhouse” effect. Who can say whether the lapse rate will be constant in a warmer world?

Notes

Note 1 – An important exception is O2 absorbing solar radiation high up above the troposphere (lower atmosphere). But O2 does not absorb significant amounts of terrestrial radiation.

Note 2 – 99% of solar radiation has a wavelength <4μm. In these wavelengths, actually about 1/3 of solar radiation is absorbed in the atmosphere. By contrast, most of the terrestrial radiation, with a wavelength >4μm, is absorbed in the atmosphere.

Note 3 – see:

Density, Stability and Motion in Fluids – some basics about instability
Potential Temperature – explaining “potential temperature” and why the “potential temperature” increases with altitude
Temperature Profile in the Atmosphere – The Lapse Rate – lots more about the temperature profile in the atmosphere

Note 4 – see Earth’s Energy Budget – a series on the basics of the energy budget

Note 5 – the “place of emission” is a useful conceptual tool but in reality the emission of radiation takes place from everywhere between the surface and the stratosphere. See Visualizing Atmospheric Radiation – Part Three – Average Height of Emission – the complex subject of where the TOA radiation originated from, what is the “Average Height of Emission” and other questions.

Also, take a look at the complete series: Visualizing Atmospheric Radiation.

Note 6 – the balance between emission and absorption are found in the equations of radiative transfer. These are derived from fundamental physics – see Atmospheric Radiation and the “Greenhouse” Effect – Part Six – The Equations – the equations of radiative transfer including the plane parallel assumption and it’s nothing to do with blackbodies. The fundamental physics is not just proven in the lab, spectral measurements at top of atmosphere and the surface match the calculated values using the radiative transfer equations – see Theory and Experiment – Atmospheric Radiation – real values of total flux and spectra compared with the theory.

Also, take a look at the complete series: Atmospheric Radiation and the “Greenhouse” Effect

Note 7 – this calculation is under the assumption of “all other things being equal”. Of course, in the real climate system, all other things are not equal. However, to understand an effect “pre-feedback” we need to separate it from the responses to the system.

Read Full Post »

If we open an introductory atmospheric physics textbook, we find that the temperature profile in the troposphere (lower atmosphere) is mostly explained by convection. (See for example, Things Climate Science has Totally Missed? – Convection)

We also find that the temperature profile in the stratosphere is mostly determined by radiation. And that the overall energy balance of the climate system is determined by radiation.

Many textbooks introduce the subject of convection in this way:

  • what would the temperature profile be like if there was no convection, only radiation for heat transfer
  • why is the temperature profile actually different
  • how does pressure reduce with height
  • what happens to air when it rises and expands in the lower pressure environment
  • derivation of the “adiabatic lapse rate”, which in layman’s terms is the temperature change when we have relatively rapid movements of air
  • how the real world temperature profile (lapse rate) compares with the calculated adiabatic lapse rate and why

We looked at the last four points in some detail in a few articles:

Density, Stability and Motion in Fluids – some basics about instability
Potential Temperature – explaining “potential temperature” and why the “potential temperature” increases with altitude
Temperature Profile in the Atmosphere – The Lapse Rate – lots more about the temperature profile in the atmosphere

In this article we will look at the first point.

All of the atmospheric physics textbooks I have seen use a very simple model for explaining the temperature profile in a fictitious “radiation only” environment. The simple model is great for giving insight into how radiation travels.

Physics textbooks, good ones anyway, try and use the simplest models to explain a phenomenon.

The simple model, in brief, is the “semi-gray approximation”. This says the atmosphere is completely transparent to solar radiation, but opaque to terrestrial radiation. Its main simplification is having a constant absorption with wavelength. This makes the problem nice and simple analytically – which means we can rewrite the starting equations and plot a nice graph of the result.

However, atmospheric absorption is the total opposite of constant. Here is an example of the absorption vs wavelength of a minor “greenhouse” gas:

From Vardavas & Taylor (2007)

From Vardavas & Taylor (2007)

Figure 1

So from time to time I’ve wondered what the “no convection” atmosphere would look like with real GHG absorption lines. I also thought it would be especially interesting to see the effect of doubling CO2 in this fictitious environment.

This article is for curiosity value only, and for helping people understand radiative transfer a little better.

We will use the Matlab program seen in the series Visualizing Atmospheric Radiation. This does a line by line calculation of radiative transfer for all of the GHGs, pulling the absorption data out of the HITRAN database.

I updated the program in a few subtle ways. Mainly the different treatment of the stratosphere – the place where convection stops – was removed. Because, in this fictitious world there is no convection in the lower atmosphere either.

Here is a simulation based on 380 ppm CO2, 1775 ppb CH4, 319 ppb N2O and 50% relative humidity all through the atmosphere. Top of atmosphere was 100 mbar and the atmosphere was divided into 40 layers of equal pressure. Absorbed solar radiation was set to 240 W/m² with no solar absorption in the atmosphere. That is (unlike in the real world), the atmosphere has been made totally transparent to solar radiation.

The starting point was a surface temperature of 288K (15ºC) and a lapse rate of 6.5K/km – with no special treatment of the stratosphere. The final surface temperature was 326K (53ºC), an increase of 38ºC:

Temp-profile-no-convection-current-GHGs-40-levels-50%RH

Figure 2

The ocean depth was only 5m. This just helps get to a new equilibrium faster. If we change the heat capacity of a system like this the end result is the same, the only difference is the time taken.

Water vapor was set at a relative humidity of 50%. For these first results I didn’t get the simulation to update the absolute humidity as the temperature changed. So the starting temperature was used to calculate absolute humidity and that mixing ratio was kept constant:

wv-conc-no-convection-current-GHGs-40-levels-50%RH

Figure 3

The lapse rate, or temperature drop per km of altitude:

LapseRate-noconvection-current-GHGs-40-levels-50%RH

Figure 4

The flux down and flux up vs altitude:

Flux-noconvection-current-GHGs-40-levels-50%RH

Figure 5

The top of atmosphere upward flux is 240 W/m² (actually at the 500 day point it was 239.5 W/m²) – the same as the absorbed solar radiation (note 1). The simulation doesn’t “force” the TOA flux to be this value. Instead, any imbalance in flux in each layer causes a temperature change, moving the surface and each part of the atmosphere into a new equilibrium.

A bit more technically for interested readers.. For a given layer we sum:

  • upward flux at the bottom of a layer minus upward flux at the top of a layer
  • downward flux at the top of a layer minus downward flux at the bottom of a layer

This sum equates to the “heating rate” of the layer. We then use the heat capacity and time to work out the temperature change. Then the next iteration of the simulation redoes the calculation.

And even more technically:

  • the upwards flux at the top of a layer = the upwards flux at the bottom of the layer x transmissivity of the layer plus the emission of that layer
  • the downwards flux at the bottom of a layer = the downwards flux at the top of the layer x transmissivity of the layer plus the emission of that layer

End of “more technically”..

Anyway, the main result is the surface is much hotter and the temperature drop per km of altitude is much greater than the real atmosphere. This is because it is “harder” for heat to travel through the atmosphere when radiation is the only mechanism. As the atmosphere thins out, which means less GHGs, radiation becomes progressively more effective at transferring heat. This is why the lapse rate is lower higher up in the atmosphere.

Now let’s have a look at what happens when we double CO2 from its current value (380ppm -> 760 ppm):

Temp-profile-no-convection-doubled-GHGs-40-levels-50%RH

Figure 6 – with CO2 doubled instantaneously from 380ppm at 500 days

The final surface temperature is 329.4, increased from 326.2K. This is an increase (no feedback of 3.2K).

The “pseudo-radiative forcing” = 18.9 W/m² (which doesn’t include any change to solar absorption). This radiative forcing is the immediate change in the TOA forcing. (It isn’t directly comparable to the IPCC standard definition which is at the tropopause and after the stratosphere has come back into equilibrium – none of these have much meaning in a world without convection).

Let’s also look at the “standard case” of an increase from pre-industrial CO2 of 280 ppm to a doubling of 560 ppm. I ran this one for longer – 1000 days before doubling CO2 and 2000 days in total- because the starting point was less in balance. At the start, the TOA flux (outgoing longwave radiation) = 248 W/m². This means the climate was cooling quite a bit with the starting point we gave it.

At 180 ppm CO2, 1775 ppb CH4, 319 ppb N2O and 50% relative humidity (set at the starting point of 288K and 6.5K/km lapse rate), the surface temperature after 1,000 days = 323.9 K. At this point the TOA flux was 240.0 W/m². So overall the climate has cooled from its initial starting point but the surface is hotter.

This might seem surprising at first sight – the climate cools but the surface heats up? It’s simply that the “radiation-only” atmosphere has made it much harder for heat to get out. So the temperature drop per km of height is now much greater than it is in a convection atmosphere. Remember that we started with a temperature profile of 6.5K/km – a typical convection atmosphere.

After CO2 doubles to 560 ppm (and all other factors stay the same, including absolute humidity), the immediate effect is the TOA flux drops to 221 W/m² (once again a radiative forcing of about 19 W/m²). This is because the atmosphere is now even more “resistant” to the escape of heat by radiation. The atmosphere is more opaque and so the average emission of radiation of space moves to a higher and colder part of the atmosphere. Colder parts of the atmosphere emit less radiation than warmer parts of the atmosphere.

After the climate moves back into balance – a TOA flux of 240 W/m² – the surface temperature = 327.0 K – an increase (pre-feedback) of 3.1 K.

Compare this with the standard IPCC “with convection” no-feedback forcing of 3.7 W/m² and a “no feedback” temperature rise of about 1.2 K.

Temp-profile-no-convection-280-560ppm-CO2-40-levels-50%RH

Figure 7 – with CO2 doubled instantaneously from 280ppm at 1000 days

Then I introduced a more realistic model with solar absorption by water vapor in the atmosphere (changed parameter ‘solaratm’ in the Matlab program from ‘false’ to ‘true’). Unfortunately this part of the radiative transfer program is not done by radiative transfer, only by a very crude parameterization, just to get roughly the right amount of heating by solar radiation in roughly the right parts of the atmosphere.

The equilibrium surface temperature at 280 ppm CO2 was now “only” 302.7 K (almost 30ºC). Doubling CO2 to 560 ppm created a radiative forcing of 11 W/m², and a final surface temperature of 305.5K – that is, an increase of 2.8K.

Why is the surface temperature lower? Because in the “no solar absorption in the atmosphere” model, all of the solar radiation is absorbed by the ground and has to “fight its way out” from the surface up. Once you absorb solar radiation higher up than the surface, it’s easier for this heat to get out.

Conclusion

One of the common themes of fantasy climate blogs is that the results of radiative physics are invalidated by convection, which “short-circuits” radiation in the troposphere. No one in climate science is confused about the fact that convection dominates heat transfer in the lower atmosphere.

We can see in this set of calculations that when we have a radiation-only atmosphere the surface temperature is a lot higher than any current climate – at least when we consider a “one-dimensional” climate.

Of course, the whole world would be different and there are many questions about the amount of water vapor and the effect of circulation (or lack of it) on moving heat around the surface of the planet via the atmosphere and the ocean.

When we double CO2 from its pre-industrial value the radiative forcing is much greater in a “radiation-only atmosphere” than in a “radiative-convective atmosphere”, with the pre-feedback temperature rise 3ºC vs 1ºC.

So it is definitely true that convection short-circuits radiation in the troposphere. But the whole climate system can only gain and lose energy by radiation and this radiation balance still has to be calculated. That’s what current climate models do.

It’s often stated as a kind of major simplification (a “teaching model”) that with increases in GHGs the “average height of emission” moves up, and therefore the emission is from a colder part of the atmosphere. This idea is explained in more detail and less simplifications in Visualizing Atmospheric Radiation – Part Three – Average Height of Emission – the complex subject of where the TOA radiation originated from, what is the “Average Height of Emission” and other questions.

A legitimate criticism of current atmospheric physics is that convection is poorly understood in contrast to subjects like radiation. This is true. And everyone knows it. But it’s not true to say that convection is ignored. And it’s not true to say that because “convection short-circuits radiation” in the troposphere that somehow more GHGs will have no effect.

On the other hand I don’t want to suggest that because more GHGs in the atmosphere mean that there is a “pre-feedback” temperature rise of about 1K, that somehow the problem is all nicely solved. On the contrary, climate is very complicated. Radiation is very simple by comparison.

All the standard radiative-convective calculation says is: “all other things being equal, an doubling of CO2 from pre-industrial levels, would lead to a 1K increase in surface temperature”

All other things are not equal. But the complication is not that somehow atmospheric physics has just missed out convection. Hilarious. Of course, I realize most people learn their criticisms of climate science from people who have never read a textbook on the subject. Surprisingly, this doesn’t lead to quality criticism..

On more complexity  – I was also interested to see what happens if we readjust absolute humidity due to the significant temperature changes, i.e. we keep relative humidity constant. This led to some surprising results, so I will post them in a followup article.

Notes

Note 1 – The boundary conditions are important if you want to understand radiative heat transfer in the atmosphere.

First of all, the downward longwave radiation at TOA (top of atmosphere) = 0. Why? Because there is no “longwave”, i.e., terrestrial radiation, from outside the climate system. So at the top of the atmosphere the downward flux = 0. As we move down through the atmosphere the flux gradually increases. This is because the atmosphere emits radiation. We can divide up the atmosphere into fictitious “layers”. This is how all numerical (finite element analysis) programs actually work. Each layer emits and each layer also absorbs. The balance depends on the temperature of the source radiation vs the temperature of the layer of the atmosphere we are considering.

At the bottom of the atmosphere, i.e., at the surface, the upwards longwave radiation is the surface emission. This emission is given by the Stefan-Boltzmann equation with an emissivity of 1.0 if we consider the surface as a blackbody which is a reasonable approximation for most surface types – for more on this, see Visualizing Atmospheric Radiation – Part Thirteen – Surface Emissivity – what happens when the earth’s surface is not a black body – useful to understand seeing as it isn’t..

At TOA, the upwards emission needs to equal the absorbed solar radiation, otherwise the climate system has an imbalance – either cooling or warming.

Read Full Post »

As a friend of mine in Florida says:

You can’t kill stupid, but you can dull it with a 4×2

Some ideas are so comically stupid that I thought there was no point writing about them. And yet, one after another, people who can type are putting forward these ideas on this blog.. At first I wondered if I was the object of a practical joke. Some kind of parody. Perhaps the joke is on me. But, just in case I was wrong about the practical joke..


If you pick up a textbook on heat transfer that includes a treatment of radiative heat transfer you find no mention of Arrhenius.

If you pick up a textbook on atmospheric physics none of the equations come from Arrhenius.

Yet there is a steady stream of entertaining “papers” which describe “where Arrhenius went wrong”, “Arrhenius and his debates with Fourier”. Who cares?

Likewise, if you study equations of motion in a rotating frame there is no discussion of where Newton went wrong, or where he got it right, or debates he got right or wrong with contemporaries. Who knows? Who cares?

History is fascinating. But if you want to study physics you can study it pretty well without reading about obscure debates between people who were in the formulation stages of the field.

Here are the building blocks of atmospheric radiation:

  • The emission of radiation – described by Nobel prize winner Max Planck’s equation and modified by the material property called emissivity (this is wavelength dependent)
  • The absorption of radiation by a surface – described by the material property called absorptivity (this is wavelength dependent and equal at the same wavelength and direction to emissivity)
  • The Beer-Lambert law of absorption of radiation by a gas
  • The spectral absorption characteristics of gases – currently contained in the HITRAN database – and based on work carried out over many decades and written up in journals like Journal of Quantitative Spectroscopy and Radiative Transfer
  • The theory of radiative transfer – the Schwarzschild equation – which was well documented by Nobel prize winner Subrahmanyan Chandrasekhar in his 1952 book Radiative Transfer (and by many physicists since)

The steady stream of stupidity will undoubtedly continue, but if you are interested in learning about science then you can rule out blogs that promote papers which earnestly explain “where Arrhenius went wrong”.

Hit them with a 4 by 2.

Or, ask the writer where Subrahmanyan Chandrasekhar went wrong in his 1952 work Radiative Transfer. Ask the writer where Richard M. Goody went wrong. He wrote the seminal Atmospheric Radiation: Theoretical Basis in 1964.

They won’t even know these books exist and will have never read them. These books contain equations that are thoroughly proven over the last 100 years. There is no debate about them in the world of physics. In the world of fantasy blogs, maybe.

There is also a steady stream of people who believe an idea yet more amazing. Somehow basic atmospheric physics is proven wrong because of the last 15 years of temperature history.

The idea seems to be:

More CO2 is believed to have some radiative effect in the climate because of the last 100 years of temperature history, climate scientists saw some link and tried to explain it using CO2, but now there has been no significant temperature increase for the last x years this obviously demonstrates the original idea was false..

If you think this, please go and find a piece of 4×2 and ask a friend to hit you across the forehead with it. Repeat. I can’t account for this level of stupidity but I have seen that it exists.

An alternative idea, that I will put forward, one that has evidence, is that scientists discovered that they can reliably predict:

  • emission of radiation from a surface
  • emission of radiation from a gas
  • absorption of radiation by a surface
  • absorption of radiation by a gas
  • how to add up, subtract, divide and multiply, raise numbers to the power of, and other ninja mathematics

The question I have for the people with these comical ideas:

Do you think that decades of spectroscopy professionals have just failed to measure absorption? Their experiments were some kind of farce? No one noticed they made up all the results?

Do you think Max Planck was wrong?

It is possible that climate is slightly complicated and temperature history relies upon more than one variable?

Did someone teach you that the absorption and emission of radiation was only “developed” by someone analyzing temperature vs CO2 since 1970 and not a single scientist thought to do any other measurements? Why did you believe them?

Bring out the 4×2.

Note – this article is a placeholder so I don’t have to bother typing out a subset of these points for the next entertaining commenter..

Update July 10th with the story of Fred the Charlatan

Let’s take the analogy of a small boat crossing the Atlantic.

Analogies don’t prove anything, they are for illustration. For proof, please review Theory and Experiment – Atmospheric Radiation.

We’ve done a few crossings and it’s taken 45 days, 42 days and 46 days (I have no idea what the right time is, I’m not a nautical person).

We measure the engine output – the torque of the propellors. We want to get across quicker. So Fred the engine guy makes a few adjustments and we remeasure the torque at 5% higher. We also do Fred’s standardized test, which is to zip across a local sheltered bay with no currents, no waves and no wind – the time taken for Fred’s standarized test is 4% faster. Nice.

So we all set out on our journey across the Atlantic. Winds, rain, waves, ocean currents. We have our books to read, Belgian beer and red wine and the time flies. Oh no, when we get to our final destination, it’s actually taken 47 days.

Clearly Fred is some kind of charlatan! No need to check his measurements or review the time across the bay. We didn’t make it across the Atlantic in less time and clearly the ONLY variable involved in that expedition was the output of the propellor.

Well, there’s no point trying to use more powerful engines to get across the Atlantic (or any ocean) faster. Torque has no relationship to speed. Case closed.

Analogy over.


Read Full Post »