Budischak et al (2013) is a very interesting paper (and free). Here is the question they pose:
What would the electric system look like if based primarily on renewable energy sources whose output varies with weather and sunlight? Today’s electric system strives to meet three requirements: very high reliability, low cost, and, increasingly since the 1970s, reduced environmental impacts. Due to the design constraints of both climate mitigation and fossil fuel depletion, the possibility of an electric system based primarily on renewable energy is drawing increased attention from analysts.
Several studies (reviewed below) have shown that the solar resource, and the wind resource, are each alone sufficient to power all humankind’s energy needs. Renewable energy will not be limited by resources; on the contrary, the below-cited resource studies show that a shift to renewable power will increase the energy available to humanity.
But how reliable, and how costly, will be an electric system reliant on renewable energy? The common view is that a high fraction of renewable power generation would be costly, and would either often leave us in the dark or would require massive electrical storage.
Good question.
We do not find the answers to the questions posed above in the prior literature. Several studies have shown that global energy demand, roughly 12.5 TW increasing to 17 TW in 2030, can be met with just 2.5% of accessible wind and solar resources, using current technologies [refs below]. Specifically, Delucci and Jacobson pick one mix of eight renewable generation technologies, increased transmission, and storage in grid integrated vehicles (GIV), and show this one mix is sufficient to provide world electricity and fuels. However, these global studies do not assess the ability of variable generation to meet real hourly demand within a single transmission region, nor do they calculate the lowest cost mix of technologies.
Emphasis added.
[Refs: M.A. Delucchi, M.Z. Jacobson, Energy Policy, Dec. 2010; M.Z. Jacobson, M.A. Delucchi, Energy Policy, Dec. 2010; L. Brown, Plan B 4.0: Mobilizing to Save Civilization, Earth Policy Institute, 2009]
This is also what I have found – I’ve read a number of “there’s no barrier to doing this” papers including Delucchi & Jacobson – so I was glad to find this paper. (As an aside, I question some points and assumptions in this paper, but that’s less important and brief comments on those points towards the end).
The key is investigating time series based on real demand for a region and real supply based on the actual wind and sun available.
Before we look at what they did and what they found, here are some comments that are relevant for some of our recent discussions:
In a real grid, we must satisfy varying load, and with high-penetration renewables, charging and discharging storage will at times be limited by power limits not just by stored energy. More typical studies combining wind and solar do not seek any economic analysis and/or do not look at hourly match of generation to load..
Hart and Jacobson determined the least cost mix for California of wind, solar, geothermal and hydro generation. Because their mix includes dispatchable hydro, pumped hydro, geothermal, and solar thermal with storage, their variable generation (wind and photovoltaic solar) never goes above 60% of generation. Because of these existing dispatchable resources, California poses a less challenging problem than most areas elsewhere, most or all practical renewable energy sources are variable generation, and dedicated storage must be purchased for leveling power output. We cannot draw general conclusions from the California case’s results..
The ability to reliably meet load will still be required of systems in the future, despite the variability inherent in most renewable resources. However, a review of existing literature does not find a satisfactory analysis of how to do this with variable generation, nor on a regional grid-operator scale, nor at the least cost. We need to solve for all three.
What does the paper do?
- Use the demand load from PJM (East Coast grid operator) for 4 years as a basis for assessing the cost-minimized solution – with the average load being 31.5 GW
- Assign a cost (unsubsidized) to each type of renewable resource: onshore wind, offshore wind, solar based on 2008 costs and forecasts for 2030 costs (roughly 50% of 2008 capex costs with similar O&M costs)
- Assign a cost to 3 different storage types: centralized hydrogen, centralized batteries, and grid integrated vehicles (GIV)
- And then run through nearly 2 billion or so combinations to first ensure demand is met, then secondly calculate the cost of each combination
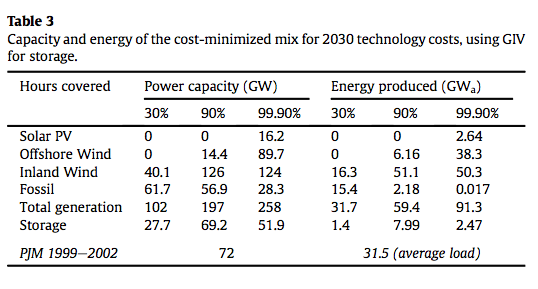
From Budischak et al 2013
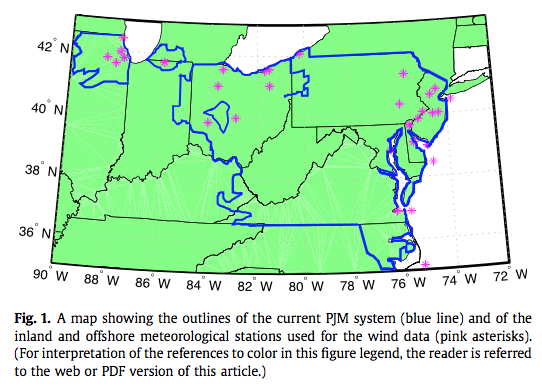
Figure 1
An most important note for me, something we will review in future articles, rather than here, is the very low cost assigned to storage using vehicle batteries – at $32/kWh, whereas centralized storage is $318/kWh. It’s clear, as we will see, that storage costs skew the analysis strongly.
Here was their lowest cost solution for 30%, 90% and 99.9% renewables. The results are probably not so surprising to people who’ve followed the series so far. Energy Produced GWa is basically the average power over the year (so 8760 GWh, which is a constant 1GW all year = 1 GWa):
From Budischak et al 2013
Figure 2
So we can see that the lowest cost method of matching demand is to produce almost 3 times the required demand. That is, the energy produced across the year averages at 91.3 GW (and appears to have peaks around 200GW). This is because storage costs so much – and because supply is intermittent. Here is the time series – click to expand:
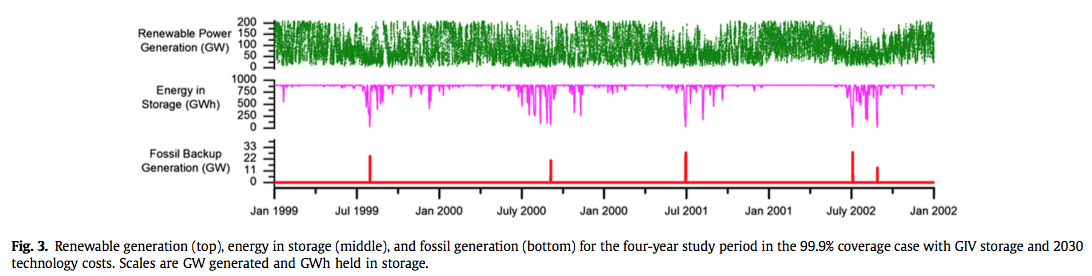
From Budischak et al 2013
Figure 3 – Click to Expand
We see that the energy in storage (middle row) is pulled down in summer, which the paper explains as due to less supply in summer (generally less wind).
Here is a challenging week in detail, the top graph shows the gaps that need to be filled in with storage, the bottom graphs with the gaps filled by storage and also how much supply is “spilled“:
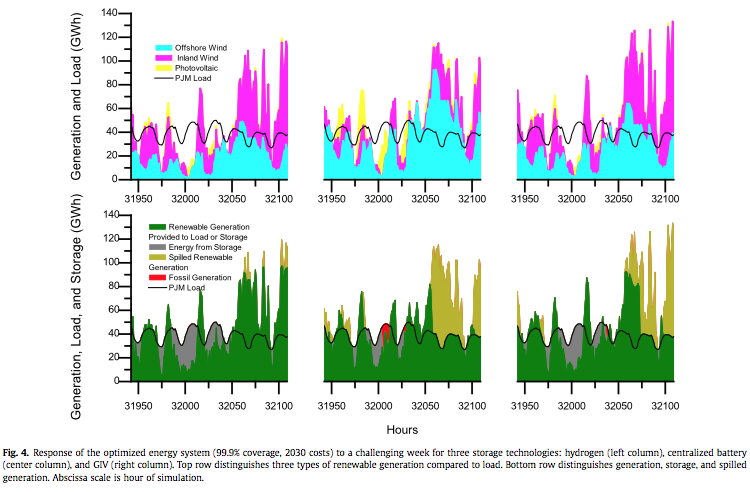
From Budischak et al 2013
Figure 4 – Click to Expand
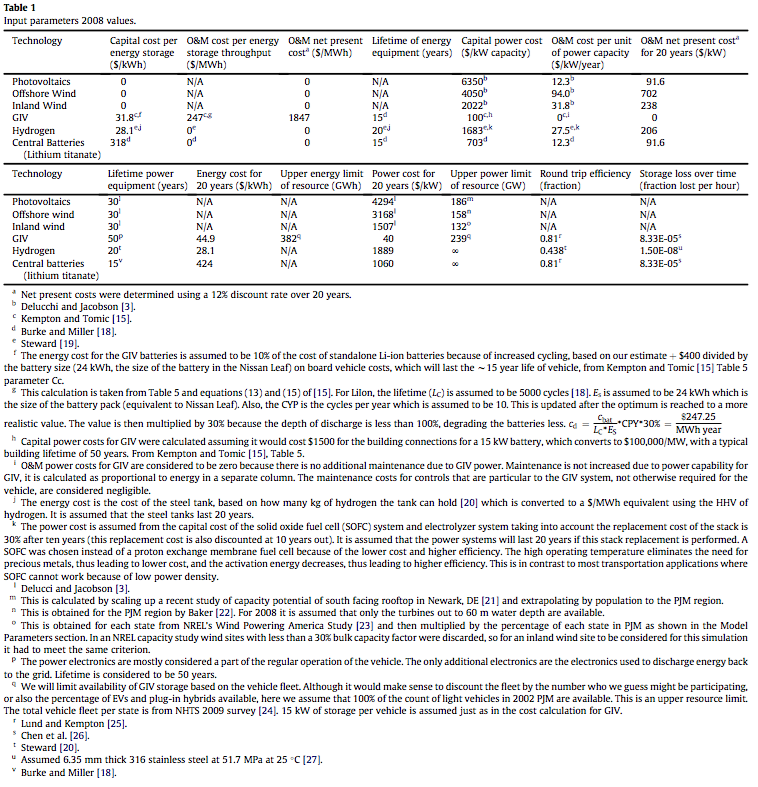
Here is the mix of generation and storage for each of the 30%, 90%, 99.9% each under the two cost assumptions of 2008 and 2030:
From Budischak et al 2013
Figure 5 – Click to Expand
Looking at the 99.9% cases we see that the projected solar PV cost in 2030 means it has a bigger share compared with wind but that wind is still the dominant power source by a long way. (We will investigate offshore wind costs and reliability in a future article).
Costs
The paper assesses that generating 30% of power from renewables today is already cheaper than conventional generation, and producing 90% in 2030 will be cheaper than conventional generation, with 99.9% at parity.
The key point I would like to draw readers attention to, is that unlike conventional generation, the higher the penetration of renewables the more expensive the solution (because the intermittency is then a bigger problem and so requires a more costly solution).
I’m not clear how they get to the result of renewables already being cheaper than conventional (for a 30% penetration). Their wind power cost from 2008 is roughly double what we found from a variety of sources (see IX – Onshore Wind Costs & XI – Cost of Gas Plants vs Wind Farms) and we found – depending on the gas price and the discount rate – that wind at that price was generally somewhat more expensive than gas. Using current US gas prices this is definitely the case. The authors comment that there are significant subsidies for conventional generation – I have not dug into that as yet.
The cost of storage seems low. If we take instead their cost of centralized storage – $318/kWh – and look at the lowest-cost solution to meet demand we find quite a different result. First, there is a lot less storage – 360 vs 891 GWh. That’s because it’s so pricey.
Second, although the final cost per kWh of energy is not given, we can see that whereas in the GIV storage case we build 16GW solar, 90GW offshore wind, 124GW inland wind = 230GW peak, with centralized storage we build 50, 129, 61 = 240GW peak and probably need the expensive offshore wind as a more reliable (less intermittent) source than onshore wind.
My basic calculation from his data is that the capital cost of the best case central storage solution is 45% more than the GIV storage solution. And more offshore wind will definitely require additional transmission cost (which was not included in the study).
I like their approach. What is clear is that finding the best cost solution depends heavily on the cost of storage, and the mix is radically different for different storage costs. Again, it is the intermittent nature of renewables for the region in question that shapes the result.
Questions on the Analysis
We simplify our grid model by assuming perfect transmission within PJM (sometimes called a “copper plate” assumption), and no transmission to adjacent grids. We also simplify by ignoring reserve requirements, within-hourly fluctuations and ramp rates; these would be easily covered with the amount of fast storage contemplated here. In addition, we assume no preloading of storage from fossil (based on forecasting) and no demand-side management. Adding transmission would raise the costs of the renewable systems calculated here, whereas using adjacent grids, demand management, and forecasting all would lower costs. We judge the latter factors substantially larger, and thus assert (without calculation) that the net effect of adding all these factors together would not raise the costs per kWh above those we calculate below.
Their analysis consumed a lot of computing resources. Adding transmission costs would add another level of complexity. However, I don’t agree with the conclusion that the transmission costs would be offset by adjacent grids, demand management and forecasting.
In brief:
- Adjacent grids have the exact same problem – the wind and solar are moving approximately in sync – meaning supply in adjacent regions is quite highly correlated; and hot and cold temperatures are likewise in sync so air-conditioning and heating demand is similar in adjacent regions – therefore another region will be drawing on their storage at the same times as the PJM region. Also, “using adjacent grids” means adding even longer transmission lines of very high capacity. That has a cost.
- “Demand management” is possibly a mythical creation to solve the problem of demand being at the “wrong time”. Apart from paying big industrials to turn off power during peak demand, which is already in play for most grid operators, it apparently equates to people not turning on the heating in the cold weather – or to people buying expensive storage. I will be looking for research with some data that puts “demand management” into some reality-based focus.
- Forecasting doesn’t exactly help, unless you have demand management. Better wind forecasting currently helps grid operators because it allows them to buy reserve (conventional generation) at the right time, making a more efficient use of conventional generation. I can’t see how it helps a mostly renewable scenario to be more cost-effective. Perhaps someone can explain to me what I am missing.
And I will dig into storage costs in a future article.
Conclusion
The paper is very good overall – their approach is the important aspect. There are a great many papers which all confidently state that there is no technical barrier to 100% renewables. This is true. But maybe two or three papers is enough.
If you add “enough” wind farms and “enough” solar and “enough” storage – along with “enough” transmission – you can make the grid work. But what is the cost and how exactly are you going to solve the problems? After the first few papers to consider this question, any subsequent ones that don’t actually cover the critical problem of electricity grids with intermittent renewables are basically a waste of time.
What is the critical problem? Given that storage is extremely expensive, and given the intermittent nature of renewables with the worst week of low sun and low wind in a given region – how do you actually make it work? Because yes, there is a barrier to making a 100% renewable network operate reliably. It’s not technical, as such, not if you have infinite money..
It should be crystal clear that if you need 500GW of average supply to run the US you can’t just build 500GW of “nameplate” renewable capacity. And you can’t just build 500GW / capacity factor of renewable capacity (e.g. if we required 500GW just from wind we would build something like 1.2-1.5TW due to the 30-40% capacity factor of wind) and just add “affordable storage”.
So, there is no technical barrier to powering the entire US from a renewable grid with lots of storage. Probably $50TR will be enough for the storage. Or forget the storage and just build 10x the nameplate of wind farms and have a transmission grid of 500GW around the entire country. Probably the 5TW of wind farms will only cost $5TR and the redundant transmission grid will only cost $20TR – so that’s only $25TR.
Hopefully, the point is clear. It’s a different story from dispatchable conventional generation. Adding up the possible total energy from wind and solar is step 1 and that’s been done multiple times. The critical item, missing from many papers, is to actually analyze the demand and supply options with respect to a time series and find out what is missing. And find some sensible mix of generation and storage (and transmission, although that was not analyzed in this paper) that matches supply and demand.
So this paper has a lot of merit.
It shows with their storage costs (which seem very low), that the lowest cost solution to building a 99.9% renewable network in one (reasonable sized) region is to build nearly 3 times the actual supply needed (this is not a “capacity factor” issue – see note 2).
In future articles we will look at storage costs, as I have questions about their costing. But the main points from this paper are more than enough for one article.
Articles in this Series
Renewable Energy I – Introduction
Renewables II – Solar and Free Lunches – Solar power
Renewables III – US Grid Operators’ Opinions – The grid operators’ concerns
Renewables IV – Wind, Forecast Horizon & Backups – Some more detail about wind power – what do we do when the wind goes on vacation
Renewables V – Grid Stability As Wind Power Penetration Increases
Renewables VI – Report says.. 100% Renewables by 2030 or 2050
Renewables VII – Feasibility and Reality – Geothermal example
Renewables VIII – Transmission Costs And Outsourcing Renewable Generation
Renewables IX – Onshore Wind Costs
Renewables X – Nationalism vs Inter-Nationalism
Renewables XI – Cost of Gas Plants vs Wind Farms
Renewables XII – Windpower as Baseload and SuperGrids
Renewables XIII – One of Wind’s Hidden Costs
Renewables XIV – Minimized Cost of 99.9% Renewable Study
Renewables XV – Offshore Wind Costs
Renewables XVI – JP Morgan advises
Renewables XVII – Demand Management 1
Renewables XVIII – Demand Management & Levelized Cost
Renewables XIX – Behind the Executive Summary and Reality vs Dreams
References
Cost-minimized combinations of wind power, solar power and electrochemical storage, powering the grid up to 99.9% of the time, Cory Budischak, DeAnna Sewell, Heather Thomson, Leon Mach, Dana E. Veron & Willett Kempton, Journal of Power Sources (2013) – free paper
Notes
Note 1: Tables 1 & 2 of cost estimates with notes from Budischak et al 2013 – click to expand
Note 2: The 2-3 overbuilding is not the nameplate vs capacity factor question. Let me explain. Imagine we are only talking about wind. If we build 3GW of wind farms we might get 1GW of average output across a year. This is a 33% capacity factor. The % depends on the wind turbines and where they are located.
Now if we need to get 1GW average across the year and meet demand 99.9% of the time, the lowest cost solution won’t be to build 3GW of nameplate (=1GW of average output) and add lots of storage, instead it will be to build 9GW of nameplate and some storage.


