Regular readers are probably used to the lack of clear direction as we progress through a series (and switch to a new series, and back to an old series). Better series would have a theme, an outline, an overall direction, basically some kind of plan. Instead, we have part VI.
As I was reading the comments in The Conversation – Australia’s 2030 climate target puts us in the race, but at the back I saw that getting to 100% renewables in Australia was perfectly achievable:
The AEMO and UNSW studies showed that 100% renewables is viable and affordable. There are no problems with 50%.
– and so I thought I would take a look. It’s quite appealing to be able to convert all of a country’s electricity supply to renewables. And Australia has a couple of big benefits – lots of sunshine, and lots of land compared with the population. Probably most countries in the developed world have commissioned a report on how to get to 40% and 100% renewables by year x and Australia is no different.
As a positive the study considered two different cases and two time horizons:
The modelling undertaken presents results for four selected cases, two scenarios at two years, 2030 and 2050. The first scenario is based on rapid technology transformation and moderate economic growth while the second scenario is based on moderate technology transformation and high economic growth. The modelling includes the generation mix, transmission requirements, and hypothetical costs for each.
The major difference to 2050 is more population and economic growth, so we’ll focus on 2030 – especially as sooner is obviously better (and perhaps more difficult). And the first scenario basically assumes lots of new stuff that doesn’t exist yet, so we’ll focus on the second scenario.
As always with papers and studies, I recommend readers to review the whole document, not rely on my extracts.
The modelling suggests that considerable bioenergy could be required in all four cases modelled, however this may present some challenges. Much of the included biomass has competing uses, and this study assumes that this resource can be managed to provide the energy required. In addition, while CSIRO believe that biomass is a feasible renewable fuel, expert opinion on this issue is divided.
The costs presented are hypothetical; they are based on technology costs projected well into the future, and do not consider transitional factors to arrive at the anticipated cost reductions. Under the assumptions modelled, and recognising the limitations of the modelling, the hypothetical cost of a 100 per cent renewable power system is estimated to be at least $219 to $332 billion, depending on scenario. In practice, the final figure would be higher, as transition to a renewable power system would occur gradually, with the system being constructed progressively. It would not be entirely built using costs which assume the full learning technology curves, but at the costs applicable at the time.
The 2030 “no great technology breakthrough” scenario is given as $252 BN – “Capital costs are based on DCCEE scope assumptions which include: assumed system build in 2030 or 2050 without consideration of the transition path; and no allowance for distribution network costs, financing costs, stranded assets, land acquisition costs or R&D expenditure.”
These figures are in Australian dollars and in 2013-2014 government spending was around A$400BN. Over 15 years the estimated cost of going to 100% renewables is about $17 BN per year or roughly 4% of government spending per year. What governments euphemistically call “defence” is costed at $20BN in the Australian budget so it’s not impossible. Swords into ploughshares, and F-35A Lightning II’s into Vestas V112 wind turbines..
However, assuming that achieving 100% renewables starting in 2030 requires building stuff today (not starting on Jan 1st, 2030) we should look at what it costs to build renewables today. I’ve taken their numbers as a given. The same calculations come out as 50% – 100% higher (using their estimate of today’s costs rather than 2030 cost projections), so maybe $370-$500BN.
Given there is as yet no detailed project plan (and no budget) the best case is to start building close to 2020, so more like $30-$50BN per year. Let’s call it 10% of government spending. (The study looked at increasing electricity prices to pay the bill).
What was encouraging in the study – for the 2030 scenario 2 study – was:
- no obvious assumption of “game changer” technology that would magically appear
- some costing associated with upgrading the transmission network (critical requirement)
- the current (estimated) capital costs were given, as well as the future estimated capital costs
Of course, many caveats come with a feasibility study:
It is important to note that the cost estimates provided in this study do not include any analysis of costs associated with the following:
- Land acquisition requirements. The processes for the acquisition of up to 5,000 square kilometres of land could prove challenging and expensive.
- Distribution network augmentation. The growth in rooftop PV and demand side participation (DSP) would require upgrades to the existing distribution networks.
- Stranded assets. While this study has not considered the transition path, there are likely to be stranded assets both in generation and transmission as a result of the move to a 100 per cent renewable future.
Costs for each of these elements are likely to be significant.
This report is not to be considered as AEMO’s view of a likely future, nor does it express AEMO’s opinion of the viability of achieving 100 per cent renewable electricity supply.
Buying 5,000 km² of land could be cheap if it is out in the desert or $10BN if in the country.
Transmission lines might be the the wild card – you need transmission lines to get power from the new supply locations to the load centers – i.e., people. People are in cities. Land in cities and close to cities is expensive. Building the transmission lines and connecting generation was estimated at $27BN but it’s not clear if it includes the land acquisition costs. Here is the map of the added infrastructure:
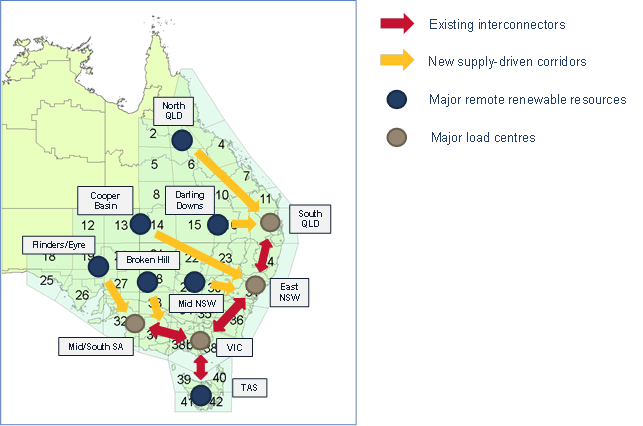
Figure 1
Where the Energy Will Come From
It was a surprise to find that solar was not the biggest by far. All that sun – and yet solar is still outclassed by wind:
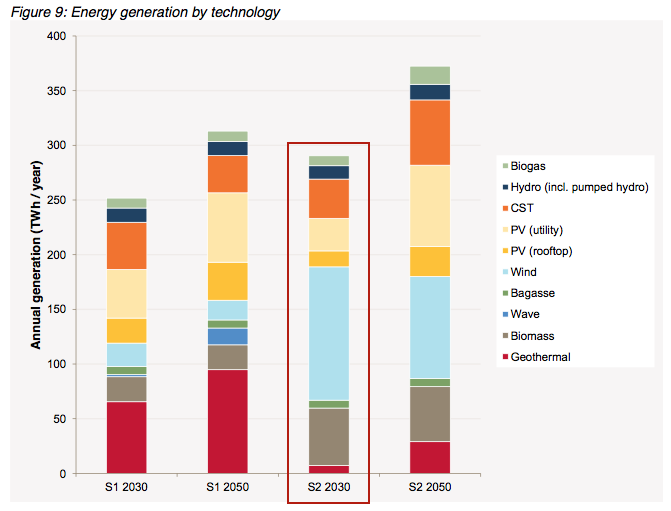
Figure 2
CST = Concentrating Solar Thermal, in this case it comes with storage. The yellows and oranges are solar of various types, while blue is wind.
Focusing on scenario 2 for 2030:
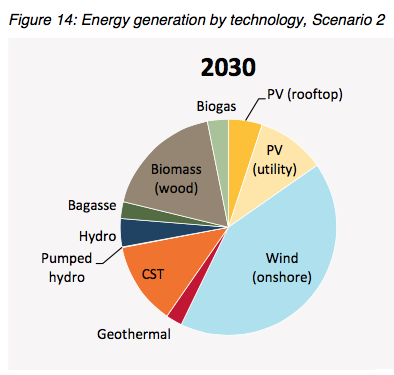
Figure 3
Capital costs per unit energy, by type. Note the difference between “today” i.e., the first column, and the estimated future costs for the scenario in question:
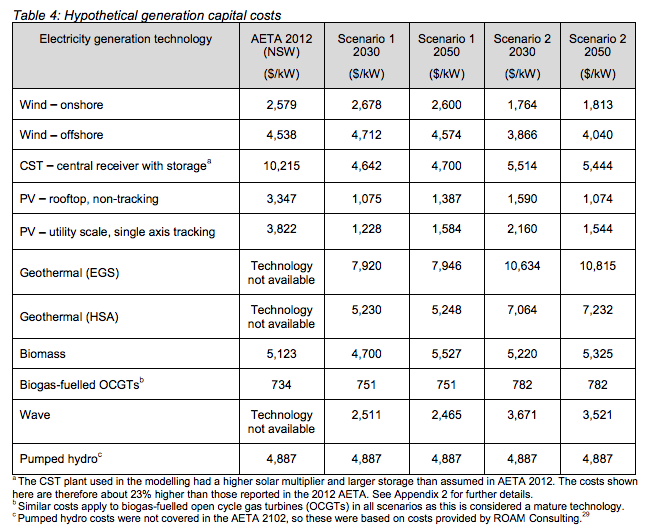
Figure 4
The estimated capital costs, with the assumption that all the costs are incurred in the final year:
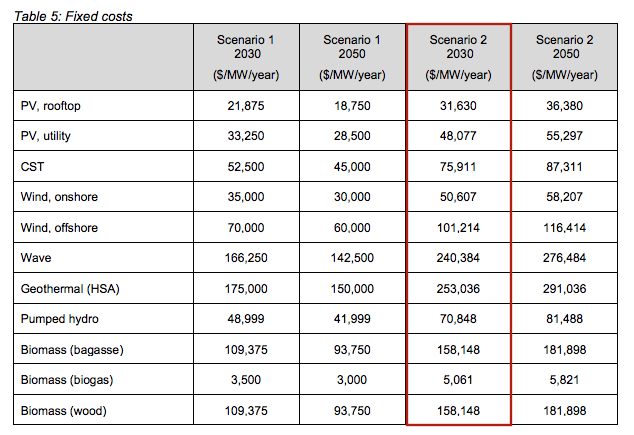
Figure 5
I noted that geothermal is very expensive in that 2030 scenario, and is currently unproven technology (there are lots of practical difficulties once the geothermal source is not close to the surface), so it’s not really clear why they didn’t go for biomass instead of limited geothermal. It seems that there is believed to be some limited, easier to access, geothermal supply close to population centers.
Common to all scenarios is the need to change the timing of demand load.
The most challenging power system design issue, or ‘critical period’, that emerged from the modelling was meeting the evening demand when PV generation decreases to zero on a daily basis.
To manage demand at this time, the modelling shifts the available flexible demand from evening to midday, to take advantage of the surplus of PV generation that typically occurs.
Even so, the majority of dispatchable generation and the largest ramps in dispatchable generation occur in the evening in all four cases. With EV [electric vehicle] recharging possibly being more efficient during the day rather than overnight (when a fossil fuelled system would have surplus generation), installing EV recharging infrastructure at workplaces and shopping centres may need to be considered.
This figure below is using scenario 1 (new technologies), but the changes in demand are in all scenarios:
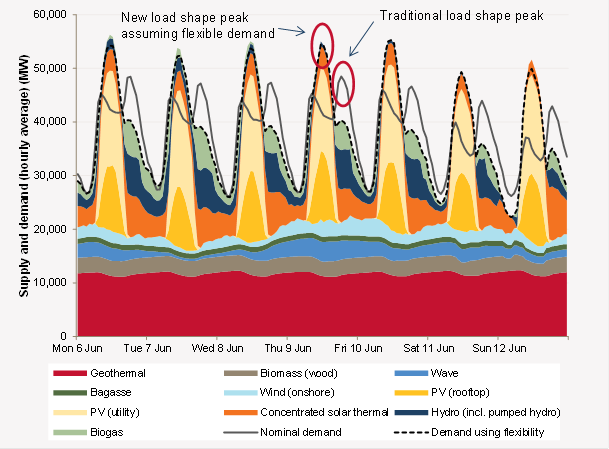
Figure 6
However, the scenario we are looking closest at seems to have the least requirement for demand shifting, but it’s still there:
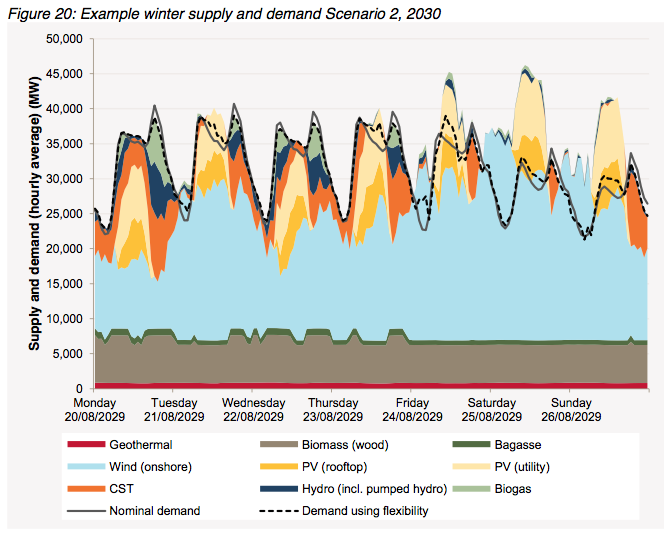
Figure 7
Expected DSP increases result from appropriate incentives being implemented to enable consumers to alter the quantity and timing of their energy consumption to reduce costs. This drives a shift in consumption patterns that responds to market needs and takes advantage of high renewable generation availability (usually when PV is peaking) to reduce energy spills.
Scenario 1 assumes up to 10% of demand is available for DSP and Scenario 2 assumes up to 5%. For each case modelled, half of the DSP is assumed to be curtailable load (that is, demand which can be reduced at a given cost) and half is modelled as ‘movable demand’ which can be consumed at an alternative time that day.
Both components of DSP represent voluntary customer behaviour. These are separate to unserved energy (USE), which is involuntary curtailment of customer demand. The reliability standard discussed in Section 5.2 refers to USE only, not DSP.
[Emphasis added].
Key Technical Points
There are four important points that we can see in this report:
- a requirement for baseload – you can’t generate 100% of electricity from wind and solar, you need some “dispatchable” power source as a backup, either conventional power stations, or, in this case, biomass, and some solar which has the critical addition of (expensive) storage
- new transmission – when you create a lot of new power generation you need to move it from the new supply locations to the demand centers (mostly cities) – this requires new transmission lines
- demand management to improve the time of day matching of supply and demand – when you have significant solar there is a problem: peak power is often generated at a different time from peak demand
- no new hydro – in most developed countries this renewable energy source is “tapped out”
We will look into the transmission issues and costs in future articles.
I’d like to highlight the 3rd point here – in many countries solar PV has been taken up by the population because of “feed-in tariffs” that give the (affluent) PV solar purchaser a kWh buy price many times the wholesale price. And this generous price is for electricity at a time when the grid demand is often low.
However, once solar PV moves from a hobby to a grid necessity, given that there is no conventional baseload, it is a necessity to move demand to the time of maximum sunshine. As a result, demand management seems to have two components:
- price signals to move demand to times of maximum supply (perhaps new technology, aka smart metering, in each home, perhaps a news report?)
- storage capacity to allow consumers to purchase at times of low demand or solar PV owners to supply at times of high demand
How does this transition happen? If I had purchased solar PV with a very favorable feed-in tariff for 20 years why would I double or treble my investment to add sufficient storage? (The answer is I wouldn’t). If I am a consumer without solar PV (or with solar PV but no feed-in tariff) what kind of punitive prices do I need to see on my electricity bill before I go out and purchase my very expensive battery pack? And/or what kind of subsidies from the government will be necessary?
It would be interesting to see where these costs of demand management appear – perhaps they are missing from the estimated price tag. If consumers demonstrate impressive resistance it’s not clear whether the 2030 scenario 2 works. That is, demand management may be a project plan dependency and therefore would need to be resolved first.
The Bill
I was surprised by the low price.
However, I was involved as a minor supplier in a commercial energy project (not a renewable) that was fully costed, with a detailed project plan, that had a cost estimate in many $BNs, yet increased by >50% during the life cycle of the project (a few years). Many factors increased the cost: the complexity of the project, escalating contractor costs, technical difficulties that had been underestimated – along with project delays due to land issues and environmental compliance. Some initial assumptions that seemed reasonable turned out to be wrong – and as anyone involved in big projects will affirm – small changes to scope, specification and timing can lead to very large unintended consequences.
Feasibility studies are a great starting point. Lots of projects pass feasibility but actual costs and risks – even before detailed design – turn out to be much higher than anticipated and the project never starts. One way to resolve the problem is to use an EPC (engineering, procurement and construction company) and get a fixed price proposal. The EPC takes the risk – and prices the risk into the job. They also write a specification with assumptions that ensure all variations (like project delays due to land acquisition) are extras. Running very large projects is difficult.
I’m sure no government has obtained an EPC price for a national 100% renewable project. Actually writing the specification would take a couple of years, and getting bids and negotiating the contract probably another year or two. If the price came out at $750BN instead of $250BN I wouldn’t be surprised. Of course, in any kind of competitive bid, intelligent bidders calculate the “missing elements” in the specification written by the client or their engineer, subtract that from their estimate of the final price and bid the difference. So the bid price is the minimum and doesn’t tell you the final bill – but it would have a lot more realism than a feasibility study.
As a counter, “big bang projects” have a huge risk, but changes that can take place incrementally, even ones that radically change the landscape over decades, have much lower inherent risk. If you told someone in England in 1880 that within 70 years virtually the entire country would have an affordable yet amazing new power source called “electricity” for lights, heating, cooking, industry – and a network of roads for motor vehicles that ran on “petrol” (= “gasoline” in America) – they would probably have laughed. “Who will pay for this?” “Where will all this infrastructure come from?”
But all of this did happen. In England the electricity supply was initially from wealthy landowners, private enterprises and municipal projects. Later, the CEGB was formed and took over all the little supply projects, linking them together. Somehow, an entire new industry was formed out of basically nothing. No overall project plan to be seen. Of course, the benefits of creating this system were huge and contributed to economic miracles by way of productivity. It’s a little different when you are displacing an existing system for a new system with the same output.
Of course, another point with the cost comparison is that over the next 35 years much of the current power generation will need to be replaced anyway – at what cost? So the real comparison cannot be “cost of 100% renewable electricity” vs zero, instead it must be “cost of 100% renewable electricity” vs “deferred cost of replacing conventional generation” – with the appropriate discount rates for deferred cost.
Overall, I found it an interesting document – with plenty of good explanations around assumptions. But as well as saying “The AEMO and UNSW studies showed that 100% renewables is viable and affordable..” we could equally say “The AEMO and UNSW studies showed that 100% renewables may be very expensive, with some critical elements that first need to be resolved..” That’s the great thing about feasibility studies, something for everyone.
For example:
However, to fully understand the operational issues that such a system might pose, it would be necessary to undertake a full set of dynamic power system studies, which is beyond the scope of this report.
In a 100 per cent renewable NEM, there are likely to be instances when non-synchronous technologies would contribute the majority of generation. Many of these non-synchronous generation sources are subject to the inherent weather variations and forecast-uncertainty of the wind, sunshine or waves.
The resulting power system is likely to be one that is at or beyond the limits of known capability and experience anywhere in the world to date, and would be subject to a number of important technical and operational challenges. Many of the issues identified would require highly detailed technical investigations that are beyond the scope of this study.
Transitioning to a very high renewable energy NEM over time would allow more scope for learning and evolution of these challenges. Further refinement of the generation mix or geographical locations could also be applied to overcome particularly onerous operational issues. International collaboration and learning will also be helpful.
Now, just to be clear, none of this relies on new ground-breaking technology. I’m sure it is all solvable. But these kinds of issues are why I think a 2030 scenario is not one that has any relationship with reality.
2030 is “possible”, but there’s a lot of building to do and you can’t start building until you know what you are building, how it will be connected together and how it will be managed and controlled.
If you ask a competent team to work out an actual delivery plan there will be several years of work (at least) just in resolving the technical questions. Your front-end engineering design should be where all the hard work is done. Trying to redesign around new core assumptions once you are in detailed design will cost many times more. Trying to redesign around core assumptions once you are in implementation and commissioning will cost 10x more.
As a pithy summary, a software engineer I once worked with had this pinned above his desk: “Remember, you can save hours of design with just a few weeks of coding.”
Readers enthusiastic about renewable energy and frustrated by the slow pace of government action might think I am being unnecessarily pessimistic. Exactly the kind of attitude that the world cannot afford! Surely, there are upsides! Unfortunately, the world of large complex projects is a world that suggests caution. How many large complex projects finish early and cost only 80% of original budget? How many finish years late and cost 3x the original budget? How many apparently simple projects finish years late and cost 3x the original budget?
Articles in this Series
Renewable Energy I – Introduction
Renewables II – Solar and Free Lunches – Solar power
Renewables III – US Grid Operators’ Opinions – The grid operators’ concerns
Renewables IV – Wind, Forecast Horizon & Backups – Some more detail about wind power – what do we do when the wind goes on vacation
Renewables V – Grid Stability As Wind Power Penetration Increases
Renewables VI – Report says.. 100% Renewables by 2030 or 2050
Renewables VII – Feasibility and Reality – Geothermal example
Renewables VIII – Transmission Costs And Outsourcing Renewable Generation
Renewables IX – Onshore Wind Costs
Renewables X – Nationalism vs Inter-Nationalism
Renewables XI – Cost of Gas Plants vs Wind Farms
Renewables XII – Windpower as Baseload and SuperGrids
Renewables XIII – One of Wind’s Hidden Costs
Renewables XIV – Minimized Cost of 99.9% Renewable Study
Renewables XV – Offshore Wind Costs
Renewables XVI – JP Morgan advises
Renewables XVII – Demand Management 1
Renewables XVIII – Demand Management & Levelized Cost
Renewables XIX – Behind the Executive Summary and Reality vs Dreams
References
100 percent Renewables Study – Modelling Outcomes, Australian Energy Market Operator Limited (2013)


SoD,
“Readers enthusiastic about renewable energy and frustrated by the slow pace of government action might think I am being unnecessarily pessimistic. Exactly the kind of attitude that the world cannot afford! Surely, there are upsides! Unfortunately, the world of large complex projects is a world that suggests caution.”
Very commendable. But it sounds like the report replaces caution with wishful thinking. The $250 billion number does not seem plausible. From Figure 2 (the boxed case), it looks like about 150 TWh from wind and 100 TWh from solar. With typical capacity factors (33%, 22%) that would be about 50 GW of capacity for each. Looking at Figure 3, that seems to be about $130 BN for wind (assuming all onshore) and $150 BN for solar (assuming half concentrated and half PV). So it is already over $250 BN, without considering the biomass and geothermal (both questionable), or transmission, or grid stabilization without the “capacitance” of conventional generators.
But it is worse than that. The capacity factors above are surely too high. With 100 GW of wind and solar and 30 GW average consumption, there will surely be extensive curtailment due to not having anywhere to send the power. That will cut the actual capacity factors way down, unless there is extensive storage. And as you point out, the required load shift will require extensive storage. So unless they find a supplier of really cheap batteries made out of unobtainium, my guess is that your $750 BN guess is more realistic, maybe even low.
So say $750 BN for 50 GW peak load; that is $15 per peak watt. Nuclear is cheap by comparison.
Mike,
In scenario 2, 2030, wind nameplate capacity is 34.5 GW.
Capital cost in 2030 is $1,760 per nameplate kW.
So capital cost should be (assuming as they do, building everything during 2030) $1,760 x 34.5×106 = $61BN
Wind power annual output from their figure 9 (my fig 2) looks to be 125 TWh (eyeballing as 190 – 65 off the graph) which is annual 14.3 GW or 41% of nameplate capacity.
This looks very unrealistic. In their introduction they say:
So that doesn’t match up. Scenario 2, 2030 requires 3,450 km2 of land just for wind.
If we pick 30% instead of 41%, given that 3,450 km2 won’t be “the best sites” – to get 14.3 GW annually we require 48 GW nameplate capacity at $84BN – an increase of $23BN as well as 4,800 km2 of land.
I don’t know the annual output of windfarms in Australia vs nameplate.
SoD,
“In scenario 2, 2030, wind nameplate capacity is 34.5 GW.”
Did I miss that in your article? Do you have the assumed nameplate capacity for the solar power?
“Wind power annual output … 41% of nameplate capacity … This looks very unrealistic. ”
That’s not the only thing that looks unrealistic. They have Biogas OGCT’s being built for half the capital cost of GTCC plants. Geothermal goes from “technology not available” to significant contributions in 15 years. The production variability ranges in Figure 6 and 7 are almost surely much less than the full ranges that might be experienced. That raises yet another issue with large amounts of non-dispatchable power: Daytime usage varies considerably between weekdays and weekends/holidays but wind and sun don’t care.
Thanks for putting this together.
Mike,
No, it’s in the report. Here is the table from p38, which also gives you the solar nameplate capacity:
The large geothermal 2050 contribution and “not available today” note come from the proven reserves in central Australia (Innamincka, amazing night life apparently). There has been a lot of work on a pilot project but not a lot of success. This is due to the depth of the geothermal energy.
My understanding of what this report is saying is that there are small geothermal reserves close to population centers and easier to access.
I’ll write more on geothermal soon. It is a good lesson in feasibility studies, optimism, exciting press releases and reality. Unfortunately, it seems that reality won the last couple of rounds.
I’d believe they could build the solar and wind before I believe they could implement that much bio- whatever in 15 years. And I don’t believe the solar and wind estimates. Magical thinking.
.. and at current prices at that capacity factor (30%) the capital cost of the wind power = $124 BN.
SoD,
Thanks for the table above. If I’m reading these right. then for scenario 2 we have ($5.5/W)*(18 GW) = $99 BN for CST, ($1.6/W)*(27.5 GW) = $44 BN for utility PV, ($2.2/W)*(20.4 GW) = $45 BN for rooftop PV for a total of $199 BN for solar. Plus $124 BN for wind, plus a bunch of other smaller contributions, all adding up to $250 BN. Hmm.
SOD and Mike: One of the things that makes MacKay’s book unusually useful is that he converts everything into units per person: cost per person per year, electricity consumption in kWh/d per person, land area per person. Billions of dollars and TWh of power mean little too many readers.
One kWh/d is roughly the amount of power that a human produces. The developed world uses about 100-200 kWh/d/person of power, the equivalent of 100-200 servants or slaves. It’s an simple demonstration of how rich cheap fossil fuel energy has made our societies.
MacKay is has two technical degrees (theoretical physics and information theory) and moved from professor to chief scientific advisor for Britain’s Department of Energy and Climate Change.
What I think is this: You underestimate the power of human ingenuity in the face of an economic/technological challenge. I have been tangentially involved in battery development for many decades; I understand why energy storage is such a difficult project. And I also understand why the (direct, metered) delivery of electrical energy to consumers is THE most important miracle of the (early) 20th century. However, my guess — and it is merely an informed guess — is that we humans will find a way to lower the costs of delivered energy through a combination of battery storage and load management. Many parts of the load can be postponed or accelerated; there is no reason to think our current management model of supply-demand matching is the only way to go. In the not-too-distant future, we will see
Serioso,
Human ingenuity is amazing, along with human optimism.
There are many examples of great advances in technology in short periods of time, and there are many examples of great advances that have taken many decades longer than originally hoped for.
What this renewables section of the blog is about (my intention) is to separate facts from wishful thinking.
If – and this is the key point that I want readers and commenters to focus on – if the renewables revolution requires a specific technology like low cost (define $/kWh) storage technology, that point needs to be articulated and highlighted. Then we can attempt to determine whether it will be ready in time at the cost required.
The AEMO report we looked at appeared quite realistic on storage costs:
What I observe in discussions about renewable energy is lots of wishful thinking and glossing over inconvenient “facts”. It is what inspired me to write about renewables.
Serioso,
You wrote: “You underestimate the power of human ingenuity in the face of an economic/technological challenge … my guess — and it is merely an informed guess — is that we humans will find a way to lower the costs of delivered energy through a combination of battery storage and load management.”
If I were to go into cryogenic storage for a century, I would expect to emerge into a world that no longer relies heavily on fossil fuels. But I refuse to guess what they will be using instead; to do so would be to underestimate the power of human ingenuity. The transition will not occur until technological breakthroughs enable it to be done in a reliable, economical manner. When that happens, the transition will occur rapidly and on its own, provided that we still have a capitalist system.
To commit to a crash program based on immature technology, as in Germany or this Aussie report, would be to head down what might well turn out to be a box canyon. The journey would likely stop at a point where fossil fuels are still heavily used and the massive sunk investment would make it difficult to move to a more promising path. The result could even be to delay the introduction of of truly effective technologies and so might increase the integrated CO2 emissions.
Serioso and SOD: Technological progress is often uneven. Air travel improved dramatically for a half-century until jets capable of crossing oceans and continents became available. Then the SSTs struggled and progress began evolutionary, not revolutionary. Computers had a modest impact until semiconductor CPUs were developed. Manned space flight reached the moon for a few years, but is restricted to low earth orbit these days. In these cases, fundamental limitations in technology slowed progress. One can anticipate some evolutionary improvement, but revolutionary change doesn’t follow a schedule.
Technology break-throughs will happen, but the hard part is predicting what those break-throughs will be. A few decades ago I was convinced that miniature fuel cells would be available by now that would take the place of batteries. So cordless power tools would have the power of plug-in tools, Laptop batteries would last on the order of months or a year before refueling or fuel cell replacement. Well, needless to say, that hasn’t happened.
I don’t think you can predict breakthroughs. The thermodynamics of the lithium ion battery, for example, are such that it shouldn’t be possible to make one. No electrolyte should be stable over such a wide potential range. But it was possible to find a system that reacted slowly enough to make batteries practicable: the triumph of kinetics over thermodynamics.
That being said, I find it very hard to believe that there will be breakthroughs in battery technology that would make electric vehicles more than a niche market, which only exists now because of large subsidies. Multi-hour charge cycles for a fairly short range do not a practical vehicle make, at least not in a country the size of the US.
There may be some hope for drastically extending cycle life. Then the capital expense could be amortized over a much longer period, making storage for intermittent sources less expensive.
Also, as far as I know, there are no significant economies of scale for battery manufacture. Batteries from a big plant will cost about as much to manufacture as batteries from a smaller plant.
That should be, I don’t think you can predict specific breakthroughs.
Odd there is no consideration of nuclear power… which should be far cheaper than many of the projected renewable power sources.
“Odd there is no consideration of nuclear power”
Not odd at all. Start with ideology and the rest follows.
Mike,
Yes, well, I know that from visiting Australia several times. I was trying to say the same thing a little more gently. The entire exercise of estimating the cost is based on political premises, which suggests, at least to one slightly jaded old engineer, that those preparing the report may not be completely unbiased.
stevefitzpatrick,
Those preparing the report had a clear mandate:
SoD,
Thanks for that added information about scope. I revise my earlier comment: Those commissioning the study may be a bit biased. But that aside, 70% of French power is nuclear. I have to doubt the seriousness of any study which excludes a demonstrated, long term, operational no-fossil fuel option before getting underway.
Good point about mega-projects. The actual final costs will be multiples of the apparent sum of the costs of the pieces of the total project. This is especially true when a mega-project includes new technologies.
Much of my career included painful experiences with mega-project cost and schedule growth. An important tool needed for success is a robust risk management program. Get all the experts together and detail out all of the possible bad things that can happen that will stretch out the schedule and increase the costs. Get the experts to quantify as best they can what the consequence and probability of each risk will be and then determine the total cost contingencies needed based on what confidence level you want on how much time and money will be required. Usually, the best way is to use a simulation tool like monte-carlo to run a 1000 or so simulations risk events given the probability and costs of various bad things happening or assumptions turning out to not be true, etc. The number for a reasonable confidence level, like say 80% confidence that “we can do this project for $x and have it completed in y years”, will always be shocking and will be unbelievable, and so typically, the project initially will NOT be funded at that level. So the project goes ahead with no contingencies. Not surprisingly, the final costs are always 2x, or 3x greater than the original optimistic estimates with little or no contingencies.
And then there is the problem on mega-projects of cost tracking vs planned costs. The project is so big, with components being designed and fabricated world-wide, that its non-trivial to understand even how the project is doing cost and schedule wise against planned costs and schedule. Lesson learned. For mega-projects, a rigorous Earned Value Management System is required to even have a chance of projecting as time goes on what the final costs will be.
And lots of other mega-project lessons learned tools are needed. Like technology readiness assessments, alternate contingency technology development, technology demonstration miniprojects, Periodic in-process project technical expert reviews, and risk tracking and mitigation.
Feasibility is one thing. Practicability is quite another thing. Many things that are feasible are not practicable. Geosynchronous orbit solar power stations using low density microwave transmission to the surface is, as far as I know, feasible. I don’t expect to see any built in my lifetime.
[…] « Renewables VI – Report says.. 100% Renewables by 2030 or 2050 […]
[…] reviewing the AEMO report for Renewables VI – Report says.. 100% Renewables by 2030 or 2050 – I found a link to a transmission costing report – Network Extensions to Remote Areas […]
[…] Renewables VI – Report says.. 100% Renewables by 2030 or 2050 […]
[…] Renewables VI – Report says.. 100% Renewables by 2030 or 2050 […]
[…] Renewables VI – Report says.. 100% Renewables by 2030 or 2050 […]
[…] Renewables VI – Report says.. 100% Renewables by 2030 or 2050 […]