For some countries – cold, windy ones like England – wind power appears to offer the best opportunity for displacing GHG-emitting electricity generation. In most developed countries renewable electricity generation from hydro is “tapped out” – i.e., there is no opportunity for developing further hydroelectric power.
There’s a lot of confusion about wind power. Some of this we looked at briefly in earlier articles.
Nameplate & Actual
The nameplate is not what anyone (involved in the project) is expecting to get out of it.
So if you buy “10GW” of wind farms you aren’t expecting 10 GW x 8,760 (thanks to DeWitt Payne for updating me on how many hours there are in a year) = 87.6 TWh of annual electricity generation. Depending on the country, the location, the turbines and turbine height you will get an “average utilization”. In the UK that might be something like 30%, or even a little higher. So for 10GW of wind farms – everyone (involved in the project) is expecting something like 26 TWh of annual electricity generation (10 x 8760 x 0.3 / 1000).
We could say, on average the wind farm will produce 3GW of power. That’s just another way of writing 26 TWh annually. So 10GW of nameplate wind power does not need “10 GW of backup” or “7 GW of backup”. Does it need “3GW of backup”? Let’s look at capacity credit.
Just before we do, if you are new to renewables, whenever you see statements, press releases and discussions about “X MW of wind power being added” check whether it is nameplate power or actual expected power. Often it is secondarily described in terms of TWh or GWh – this is the actual energy expected over the year from the wind farm or project.
Capacity Credit
The capacity credit is the “credit” the operator gives you for providing “capacity” when it is in most demand. Operators have peaks and troughs in demand. There are lots of ways of looking at this, here is one example from Gross et al 2006, showing the time of day variation of demand for different seasons in the UK. We can see winter is the time of peak demand:
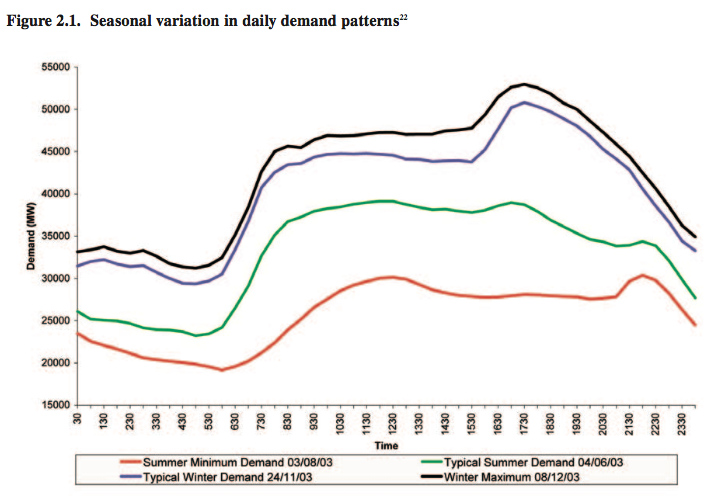
From Gross et al 2006
Figure 1
If you have a nuclear power station it probably runs 90% of the time. Some of the off-line time is planned outages for maintenance, upgrades, replacement of various items. Some of the off-line time is unplanned outages, where the grid operator gets 10 minutes notice that “sorry Sizewell B is going off line, can’t chat now, have a great day”, taking out over 1GW of capacity. So the capacity credit for nuclear reflects the availability and also the fact that the plant is “dispatchable” – apart from unplanned outages it will run when you want it to run.
The grid of each country (or region within a country) is a system. Because all of the generation within most of the UK is connected together, Sizewell B doesn’t need to be backed up with its own 1GW of coal-fired power stations. All you need is to have sufficient excess capacity to cope with peak demand given the likelihood of any given plant(s) going off line.
It’s a pool of resources to cope with:
- a varying level of demand, and
- a certain amount of outage from any given resource
Wind is “intermittent” (likewise for solar). So you can’t dispatch it when you need it. Everyone (involved in producing power, planning power, running the grid) knows this. Everyone (“”) knows that sometimes the wind turns off.
If you add lots of wind power – let’s say a realistic 3GW of wind, from 10GW of nameplate capacity – the capacity credit isn’t 90% of 3GW like you get for a nuclear power station. It is a lot smaller. This reflects the fact that at times of peak demand there might be no wind power (or almost no wind power). However, wind does have some capacity credit.
This is a statistical calculation – for the UK, the winter quarter is used to calculate capacity credit (because it is the time of maximum demand). The value depends on the wind penetration, that is, how much energy is expected from the wind from that period. For low penetrations of wind, say 500 MW, you get full capacity credit (capacity credit = 500MW). For higher penetrations it changes. Let’s say wind power provides 20% of total demand. Total demand averages about 40GW in the UK so wind power would be producing an average 8GW. For significant penetrations of wind power you get a low percentage of the output as capacity credit. The value is calculated from the geographical spread and statistical considerations, and it might be 10-20% of the expected wind power. Let’s say 8GW of output power (averaged over the year) gets 0.8GW – 1.6GW of “capacity credit”.
This means that when calculating how much aggregate supply is available windpower gets a tick in the box for 0.8GW – 1.6GW (depending on the calculation of credit). This is true even though there are times when the wind power is zero. How can it get capacity credit above zero when sometimes its power is zero? Because it is a statistical availability calculation. How can Sizewell B get a capacity credit when sometimes it has an unplanned outage? We can’t rely on it either.
The point is, hopefully it is clear, sorry for laboring it – when the wind is zero, Sizewell B and another 60GW of capacity are probably available. (If it’s not clear, please ask, I’m sure I can paint a picture with an appropriate graph or something).
Low Capacity Credit Doesn’t Mean Low Benefit – And What We Do About Low Capacity Credit
Let’s say the capacity credit for wind was zero, just for sake of argument. Even then, wind still has a benefit (it has a cost as well). Its benefit comes from the fact that the marginal cost of energy is zero (neglecting O&M costs). And the GHG emissions are zero from all the energy produced. It has displaced GHG-emitting electricity generation.
What we do about the low capacity credit is we add – or retain – GHG-emitting conventional backup. The grid operator, or the market (depends on the country in question), has the responsibility/motivation to provide backup. Running a conventional station less often, and keeping a station part running, but not at full load – these reduce efficiency.
Let’s say we produce 70 TWh of electricity from wind (20% of UK electricity requirement of 350 TWh). Wonderful. We have displaced 70 TWh of GHG emitting power. But we haven’t. We have kept some GHG emitting power stations “warmed up” or “operational at part load” and so we might have displaced 65 TWh or 60 TWh (or some value) of GHG emitting power stations because we ran the conventional generators less efficiently than before.
We will look at the numbers in a later article.
So wind has benefit even though it is not “dispatchable”, even though sometimes at peak demand it produces zero energy.
Statistics of Wind and Forecast Time Horizons
Let’s suppose that even though wind is not “dispatchable” we had a perfect forecast of wind speeds around the region for the next 12 months. This would mean we could predict the power from the wind turbines for every hour of the day for the next 365 days.
In this imaginary case, power plant could be easily scheduled to be running at the right times to cover the lack of wind power. We could make sure that major plants did not have outages in the periods of prolonged low wind speeds. The efficiency of our “backup” generation would be almost as perfect as before wind power was introduced. So if we produced 70 TWh of wind energy we would displace just about 70 TWh of conventional GHG emitting generation. We would also probably need less excess capacity in the system because one area of uncertainty had been removed.
Of course we don’t have that. But at the same time, our forecast horizon is not zero.
The unexpected variability of wind changes with the time horizon we are concerned about. Let’s put it another way, if we are getting 1.5 GW from all of our wind farms right now, the chance of it dropping to 0 GW 10 minutes from now is very small. The chance of it being 0 GW 1 hour from now is quite small. But the chance of it being 0 GW in 4 hours might be quite a bit higher.
I hope readers are impressed with the definitive precision with which I nailed the actual probabilities there..
There are many dependencies – the location of the wind farms (the geographical spread), the actual country in question and the season and time of day under consideration.
We’ve all experienced the wind in a location dropping to nothing in an instant. But as you install more turbines over a wider area the output variance over a given time period reduces. A few graphs from Boyle (2007) should illuminate the subject.
Here is a comparison of 1 hour changes between a single wind farm and half of Denmark:
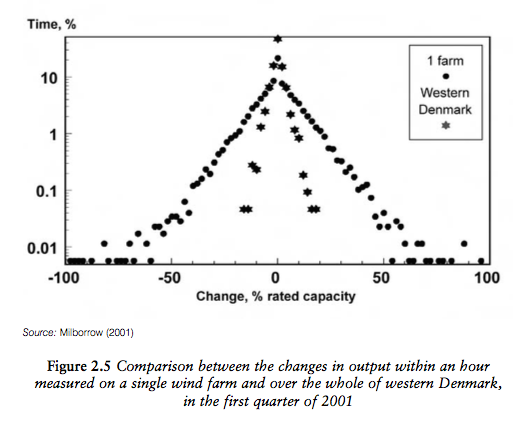
Figure 2
Here is a time-series simulation of a given 1000MW capacity in one location (single farm) vs that same capacity spread across the UK:
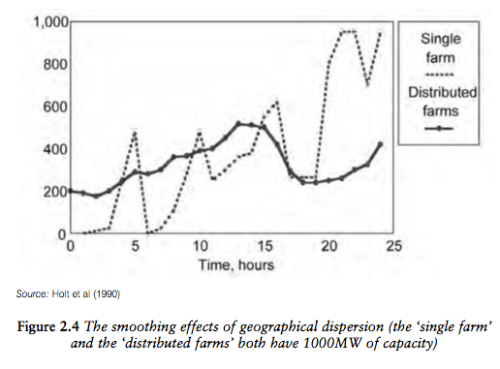
Figure 3
Here is an example from the actual output of the wind power network in Germany:
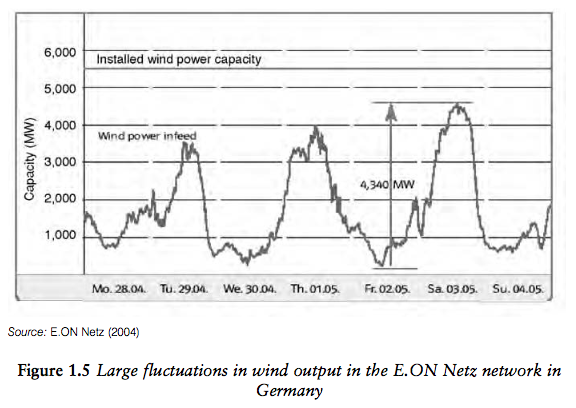
Figure 4
At some stage I will dig out some more recent actuals. The author of that chapter comments:
Care should be taken in drawing parallels, however, between experiences in Germany and Denmark and the situation elsewhere, such as in the UK. Wind conditions over the whole British electricity supply system should be assumed to be different unless proved otherwise. Differences in latitude and longitude, the presence of oceans, as well as the area covered by the wind power generation industry make comparisons difficult. The British wind industry, for example, has a longer north–south footprint than in Denmark, while in Germany the wind farms have a strong east–west configuration.
Here is an example from Gross et al (2006) of variations across 1, 2 and 4 hours:
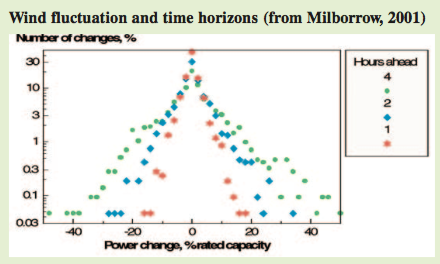
From Gross et al 2006
Figure 5
Here’s another breakdown of how the UK wind output varies, this time as a probability distribution:
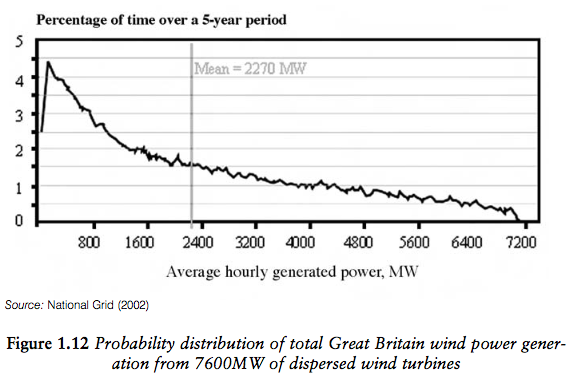
Figure 6
In another paper on the UK, Strbac et al 2007:
Standard deviations of the change in wind output over 0.5hr and 4hr time horizons were found to be 1.4% and 9.3% of the total installed wind capacity, respectively. If, for example, the installed capacity of wind generation is 10 GW (given likely locations of wind generation), standard deviations of the change in wind generation outputs were estimated to be 140 MW and 930 MW over the 0.5-h and 4-h time horizons, respectively.
What this means for a grid operator is that predictability changes with the time horizon. This matters because their job is to match supply and demand and if the wind is going to be high, less conventional stations are needed to be “warmed up”. If the wind is going to be low, more conventional stations are needed. But if we didn’t know anything in advance – that is, if we could get anything between 0GW to 10GW with just 30 minutes notice – it would present a much bigger problem.
Closing the Gate, Spinning Reserves and Frequency
The grid operator has to match supply and demand (see note for an extended extract on how this works).
Demand varies, but must be met – except for some (typically) larger industrial customers who have agreed contracts to turn off their plant under certain conditions, such as when demand is high.
The grid operator has a demand forecast based on things like “reviewing the past” and as a result enters into contracts for the hour ahead for supply. This is the case in the UK. Other countries have different rules and time periods, but the same principles apply: the grid operator “closes the gate”. To me this is not an intuitive term because he/she has contracts for flexible supply and reserves – in case demand is above what is expected or contracted plant goes offline. So gate closure means the contract position is fixed for the next time period.
However, the actual problem is to meet demand and to do this flexible plant is up and running and part loaded. Some load matching is done automatically. This happens via frequency. If you increase the load on the system the frequency starts to fall. Reserve plant increases its output automatically as the frequency falls (and the converse). This is how the very short term supply-demand matching takes place.
So the uncertainty about the wind output over the next hour is the key for the UK grid operator. It is a key factor in changing the cost of reserves as wind power penetration increases. If the gate closure was for the next 12 hours it should be clear that the cost to the grid operator of matching supply and demand would increase – given that the uncertainty about wind is higher the longer the time period in question.
Whether one hour or 12 hours gate closure makes a huge difference in overall cost of supply is likely a very complicated one, and not one I expect we can uncover easily, or at all. The market mechanism in the UK is around the 1 hour gate closure and so suppliers have all creating pricing models based on this.
Grid Stability – SNSP and Fault Ride-Through
System Non-Synchronous Penetration (SNSP) and fault ride-through capability are important for wind power. Basically wind power has different characteristics from existing conventional plant and has the potential to bring the grid down. We will look at the important question of what wind power does to the stability of the grid in a subsequent article.
Articles in this Series
Renewable Energy I – Introduction
Renewables II – Solar and Free Lunches – Solar power
Renewables III – US Grid Operators’ Opinions – The grid operators’ concerns
Renewables IV – Wind, Forecast Horizon & Backups – Some more detail about wind power – what do we do when the wind goes on vacation
Renewables V – Grid Stability As Wind Power Penetration Increases – Brief simplified discussion of Fault ride-through and System Non-Synchronous Penetration (SNSP)
Renewables VI – Report says.. 100% Renewables by 2030 or 2050
Renewables VII – Feasibility and Reality – Geothermal example
Renewables VIII – Transmission Costs And Outsourcing Renewable Generation
Renewables IX – Onshore Wind Costs
Renewables X – Nationalism vs Inter-Nationalism
Renewables XI – Cost of Gas Plants vs Wind Farms
Renewables XII – Windpower as Baseload and SuperGrids
Renewables XIII – One of Wind’s Hidden Costs
Renewables XIV – Minimized Cost of 99.9% Renewable Study
Renewables XV – Offshore Wind Costs
Renewables XVI – JP Morgan advises
Renewables XVII – Demand Management 1
Renewables XVIII – Demand Management & Levelized Cost
Renewables XIX – Behind the Executive Summary and Reality vs Dreams
References
Renewable Electricity and the Grid : The Challenge of Variability, Godfrey Boyle, Earthscan (2007) – textbook
The Costs and Impacts of Intermittency: An assessment of the evidence on the costs and impacts of intermittent generation on the British electricity network, Gross et al, UK Energy Research Centre (2006) – free research paper
Impact of wind generation on the operation and development of the UK electricity systems, Goran Strbac, Anser Shakoor, Mary Black, Danny Pudjianto & Thomas Bopp, Electric Power Systems Research (2007)
Notes
Extract from Gross et al 2006 explaining the UK balancing in a little detail – the whole document is free and well-worth spending the time to read:
The supply of electricity is unlike the supply of other goods. Electricity cannot be readily stored in large amounts and so the supply system relies on exact second-by-second matching of the power generation to the power consumption. Some demand falls into a special category and can be manipulated by being reduced or moved in time.
Most demand, and virtually all domestic demand, expects to be met at all times.
It is the supply that is adjusted to maintain the balance between supply and demand in a process known as system balancing.
There are several aspects of system balancing. In the UK system, contracts will be placed between suppliers and customers (with the electricity wholesalers buying for small customers on the basis of predicted demand) for selling half hour blocks of generation to matching blocks of consumption. These contracts can be long standing or spot contracts.
An hour ahead of time these contract positions must be notified to the system operator which in Great Britain is National Grid Electricity Transmission Limited. This hour-ahead point (some countries use as much as twenty-four hour ahead) is known as gate closure.
At gate closure the two-sided market of suppliers and consumers ceases. (National Grid becomes the only purchaser of generation capability after gate closure and its purpose in doing so is to ensure secure operation of the system.) What actually happens when the time comes to supply the contracted power will be somewhat different to the contracted positions declared at gate closure. Generators that over or under supply will be obliged to make good the difference at the end of the half hour period by selling or buying at the system sell price or system buy price. Similar rules apply to customers who under or over consume.
This is known as the balancing mechanism and the charges as balancing system charges. This resolves the contractual issues of being out-of- balance but not the technical problems.
If more power is consumed than generated then all of the generators (which are synchronised such that they all spin at the same speed) will begin to slow down. Similarly, if the generated power exceeds consumption then the speed will increase. The generator speeds are related to the system frequency. Although the system is described as operating at 50 Hz, in reality it operates in a narrow range of frequency centred on 50 Hz. It is National Grid’s responsibility to maintain this frequency using “primary response” plant (defined below). This plant will increase or decrease its power output so that supply follows demand and the frequency remains in its allowed band. The cost of running the primary response plant can be recovered from the balancing charges levied on those demand or supply customers who did not exactly meet their contracted positions. It is possible that a generator or load meets its contract position by consuming the right amount of energy over the half hour period but within that period its power varied about the correct average value. Thus the contract is satisfied but the technical issue of second-by-second system balancing remains..
..Operating reserve is generation capability that is put in place following gate closure to ensure that differences in generation and consumption can be corrected. The task falls first to primary response.
This is largely made up of generating plant that is able to run at much less than its rated power and is able to very quickly increase or decrease its power generation in response to changes in system frequency. Small differences between predicted and actual demand are presently the main factor that requires the provision of primary response. There can also be very large but infrequent factors that need primary response such as a fault at a large power station suddenly removing some generation or an unpredicted event on TV changing domestic consumption patterns.
The primary response plant will respond to these large events but will not then be in a position to respond to another event unless the secondary response plant comes in to deal with the first problem and allow the primary response plant to resume its normal condition of readiness. Primary response is a mixture of measures. Some generating plant can be configured to automatically respond to changes in frequency. In addition some loads naturally respond to frequency and other loads can be disconnected (shed) according to prior agreement with the customers concerned in response to frequency changes.
Secondary response is normally instructed in what actions to take by the system operator and will have been contracted ahead by the system operator. The secondary reserve might be formed of open-cycle gas-turbine power stations that can start and synchronise to the system in minutes. In the past in the UK and presently in other parts of the world, the term spinning reserve has been used to describe a generator that is spinning and ready at very short notice to contribute power to the system. Spinning reserve is one example of what in this report is called primary response. Primary response also includes the demand side actions noted in discussing system frequency..


Delurking …
I’m just an observer here and thought some may find the data from the BPA in the NW US to be of interest. Numerous links to different aspects of their system including several years of 5 minute data for wind forecast/production along with thermal and hydro data. Current wind installed is 4782 MW.
http://transmission.bpa.gov/business/operations/Wind/default.aspx
Relurking …
SOD
In your first para you state that in many cold and windy countries such as England wind power seems to be the best way of displacing GHG emitting electricity generation. I note you did not mention nuclear power – was this an oversight?
Yes, it was a “caveat-minimization” oversight.
SoD,
Very nice article.
I am still slogging through Gross et al., finding it informative but dry and wordy. It strikes me that there are some important crossover points as wind penetration increases. As you point out, any system needs a reserve to allow for plant going suddenly off line. As long as capacity credit is below that reserve, a widespread drop in wind is not much different from a sudden shut down of a conventional plant (maybe even easier to cope with). But I find it hard to see how capacity credit can be much larger than the reserve, at least not without a major change in how the system operates.
Similarly, short term fluctuations in wind output are really no different from short term fluctuations in demand. If the fluctuations are uncorrelated, they add in quadrature and the combined fluctuation is dominated by the larger of the two contributions. So again there is a crossover point where the fluctuation in wind power exceeds the demand fluctuation and forces a change in how the fluctuations are managed.
So then two key questions would be: (1) At what levels of penetration do these crossovers occur? and (2) What are the consequences of exceeding those levels?
Sounds like you have something like that in mind for future articles. I look forward to them.
Mike,
I’m not sure I understand your questions.
By “capacity credit” you mean the capacity credit for the total windpower installed base? What do you mean by “reserve” here?
Possibly the question is not relevant is practice given that capacity credit is a lot less than typical reserves.
Let me run some numbers and you can tell me what scenario you are considering..
Let’s say typical power in the UK = 40 GW. Let’s say peak power expectation = 60 GW, based on so many years of data & recent demand trends.
Let’s say with no wind power, total capacity (i.e. when all plants are online) = 80 GW.
Now we install 20 GW of average wind power (ie about 60GW of nameplate) but due to issues as discussed above the capacity credit = 3 GW. So the total non-wind installation capacity is wound back and = 77 GW.
If I did understand your question then this example would show that even with 50% of average and 33% of peak, wind capacity credit is a long way off the reserve.
Basically the calculation of capacity credit itself, based on statistical considerations, ensures that there will always be sufficient capacity in the system. That is, even if wind is away on vacation for the week, at the time of peak demand, there will be capacity from conventional backup generation.
Caveat: remember that the calculation is not for “never ever any outage”, but instead a LOLP of 9% (in the UK). No system gets 100% availability number in planning, which is why communications networks are planned around numbers like 99.999% for core transmission, and numbers like 99.9% for less critical branches.
SoD,
“By “capacity credit” you mean the capacity credit for the total windpower installed base?”
Yes. I am trying to use the terminology in Gross et al.
“What do you mean by “reserve” here?”
Quoting Gross: “Reserve is a capability to change output to meet system operator requests within a few minutes.”
“Possibly the question is not relevant is practice given that capacity credit is a lot less than typical reserves.”
As long as capacity credit is a lot less than typical reserves, there is no issue. But if that if capacity credit is not less than typical reserves, it would seem that a change in the way things are done would be required.
“Let’s say typical power in the UK = 40 GW. Let’s say peak power expectation = 60 GW, … Let’s say with no wind power, total capacity (i.e. when all plants are online) = 80 GW.”
Gross seems to call the difference between total capacity (80 GW) and expectation (60 GW at peak) the “system margin”. But that is not all available on short notice. Is the system margin in the UK really so large? My impression is that in North America, system margin is usually much smaller.
I am still struggling with a lot of details.
Another nice post! One comment – I don’t believe nuclear power is generally considered “dispatchable”, though it depends on the specific type of reactor. Some notes in this wikipedia article for example: https://en.wikipedia.org/wiki/Load_following_power_plant – ramp up times for nuclear power plants can be hours or days. Also given their cost situation is a little like renewables in that capital costs are large, running them at close to full capacity as much as possible is also economically advantageous. So they are rarely used in the load-following or peaking modes associated with dispatchability.
This publication suggest (more or less) otherwise on nucleair load following:
http://www.world-nuclear.org/info/Country-Profiles/Countries-A-F/France/
Arthur,
I’m not attempting to figure out the formal definition of “dispatchable”, more painting a picture.
On nuclear, it’s economic vs technical. Yes – economics – you want to run certain plants as baseload because that’s the economic way, but yes – technical – you can also wind them up or down. Obviously there is a different timescale & flexibility profile for different plants. Coal and nuclear can’t be started up quickly. Some gas plants can come in on minutes and are designed as peakers to take advantage of market conditions.
Arthur,
So far as I can tell, “dispatchable” sometimes means power that can be scheduled, in which case nuclear is dispatchable, and sometimes means power that can be ramped, in which case nuclear is not.
There seems to be a lot of jargon, often meaning different things in different countries.
In theory, the maximum amount of power that can be extracted from wind varies with the cube of the wind speed. This means that wind speed 10% below forecast should produce about 72% of forecast electricity output and wind speed 20% below forecast should produce about 50% of forecast electricity. So the utility of wind power probably depends to a surprising extent on how accurately wind can be forecast, how quickly backup generation can be brought online, and flexibility in demand. In Britain, National Grid is required by law to maintain a system capable meeting demand 99.7% of the time (364/365 days of the year), so they need to consider the 99.7% confidence interval of their forecasting skill. I’ve seen – but can no longer find – documents from National Grid online suggesting that they can currently forecast with 99.7% reliability the amount of electricity produced by wind within +/- 50% 4 hours ahead of time.
The potential forecasting problem is best illustrated by imagining the day when Britain reaches its target of 30% of electricity from wind, meaning that nameplate capacity of wind will be roughly the same size as demand. On windy days, therefore, essentially all electricity could be obtained from wind. If the 99.7% confidence interval for forecasting wind speed is +/-20%, the amount of wind power the grid can count on receiving is only +/-50% of the country’s needs! So a reserve of 50% of demand could be needed if it takes 4 hours to bring reserve power online.
In eastern Denmark, backup power is provided by hydroelectric dams in Scandinavia. Such backup power probably can be brought online within a few minutes, so the ability to forecast wind output should only be critical when water reservoirs are low. In Britain, the backup supply will probably come from fossil fuel generating plants emitting CO2.
Frank,
It’s probably better and worse than that. The cube curve isn’t from zero speeds to gale force winds. Here’s an example of a turbine that may be outdated, but the same principles apply:
So at some speeds being inaccurate by 10% will have little change, at other speeds 10% inaccuracy results in a big change.
Here are two results from Boyle 2007 that demonstrate the reality of forecasting, at least in Germany:
Another article disussing the topic, using real-life data from the Midwest and Texas grid operators:
What day-ahead reserves are needed in electric grids with high levels of wind power?
http://iopscience.iop.org/1748-9326/8/3/034013/article
SOD and Fuchs: Theory is nice, but real data is better. Thanks.
Notice that the forecast error on the vertical axis of all three graphs is reported as a percentage of INSTALLED CAPACITY, not as a percentage of forecast output. Reporting the forecast error as a percentage of installed capacity is a useless for calculating the size of the reserve needed to back up wind power. Average output is 30% of nameplate capacity, so the average forecast error should be about three times bigger – approaching the +/-50% error mentioned above for ERCOT. (Perhaps there is something I am missing here.)
The academic IOP paper Fuchs linked discusses forecasts of dispatchable power (made 24 hours ahead) with 95% reliability – a level of reliability which seems unreasonably low to me. If grid operators are allowed to deliver power with this low reliability, they won’t need to spend so much money backing up wind power with reserve.
If power becomes less reliable, however, customers (especially businesses) will incur higher costs (productivity, backup systems). Utilities can partially solve the reliability problem by offering discounts to customers who volunteer to be disconnected from the grid during power shortages, but other customers will pay higher prices for power as a consequence. And the more frequent the interruptions, the bigger that discount will need to be. IMO, the sainted “smart grid” is simply an expensive means for reducing demand (by raising prices) when intermittent power generation fails to deliver.
[…] Renewables IV – Wind, Forecast Horizon & Backups […]
Very nice article. Just wanted to bring everyone’s attention to a journal of the IEEE, Transactions on Smart Grid. The sense I have of the articles there from people who know a bit about power engineering is that they think of these ideas as pie-in-the-sky. However, there was a once-upon-a-time when Edison, and Westinghouse, and Tesla were pie-in-the-sky. Moreover, the controls in the existing power grid are pretty antiquated, not only from the perspective of hardware and style, but also in terms of software. The IEEE also publishes Transactions on Power Systems, and Transactions on Automatic Control. Both the latter two journals offer papers addressing some of these issues, e.g.:
Kawabe, K. ; Graduate School of Science and Engineering, University of Toyama, Toyama, Japan ; Tanaka, K., “Impact of Dynamic Behavior of Photovoltaic Power Generation Systems on Short-Term Voltage Stability”, from Power Systems, and
Meyn, S.
Sean Meyn is with the Dept. ECE at the University of Florida, Gainesville.
Barooah, P. ; Busic, A. ; Chen, Y. ; Ehren, J., “Ancillary Service to the Grid Using Intelligent Deferrable Loads”, from Automatic Control.
SoD,
Very nice article. Clear and informative.
In an environment where wind represents a substantial fraction of total generation, I suspect it would be very advantageous to have fast responding fossil fuel power which can operate efficiently over a wide load range. The best match where natural gas is available at a low cost appears to be large size (eg 10 megawatt) spark ignited, natural gas fired piston engines, with an exhaust gas driven steam turbine for a ‘bottoming cycle’. The production plant consists of banks of many of these engines, and the engines can be brought on line in as little as 10-15 minutes. The plant can run at >50% peak thermal efficiency, and can operate at very reasonable efficiency (>45%) over a huge power range, since individual engines can be started, stopped, and throttled. Claimed lifetime availability per engine is >93%, and most downtime is scheduled. Since there are many such engines in a production plant, the possibility of a complete outage, or even a substantial fractional drop in capacity, is extremely low. Engine lifetime before a major overhaul is claimed to be >30,000 hours, and >60,000 hours before replacement.
Total plant capital investment per KW capacity comparable to gas turbine plants (about US$1,000), and net production cost (including capital, maintenance, fuel and engine replacements) under US$0.05 at US natural gas prices. For the UK, this may not be an option because of gas prices.
I assume you mean an exhaust gas driven turbine like a turbocharger without the charger part. Steam seems unnecessary. Formula 1 has gone in that direction, sort of. In addition to a motor/generator attached to the drive line that can be used to add power or for regenerative braking, there’s also a motor/generator on the turbocharger which can increase boost or recover energy rather than dumping excess out a waste gate. Needless to say, it’s very complex, particularly controlling the regenerative braking, and some engine manufacturers, notably Mercedes, are doing a better job than others.
No DeWitt, a down stream heat exchanger to generate steam. The engines are definitely not naturally aspirated, but my guess is a mechanical blower that is used. There is some information here: http://s7d2.scene7.com/is/content/Caterpillar/C10015265
This is advertising, but there are lots of other resources available. It is my understanding that quite a few plants based on spark ignited natural gas have been built.
SoD,
I have a question about capacity credit. You wrote “For significant penetrations of wind power you get a low percentage of the output as capacity credit. The value is calculated from the geographical spread and statistical considerations, and it might be 10-20% of the expected wind power. Let’s say 8GW of output power (averaged over the year) gets 0.8GW – 1.6GW of “capacity credit”.”
In reading Chapter 2 of Gross et al., I got the impression that capacity credit was typically 15% to 25% of nameplate capacity. Your example uses a percentage of production. In Chapter 3 of Gross, I found it hard to tell if he was using % of nameplate or % of production. One of the operators quoted by Sovacool said that you need 6 GW of wind capacity to replace 1 GW of conventional capacity; that sounds like he is saying that the capacity credit is 1/6 of nameplate capacity.
The question is not the specific numbers, which vary from system to system, but what they are a percentage of.
Mike,
I have no help to add on definition conventions regarding capacity credit.
My example is.. an example to illustrate. If a paper or website gives a value as % I expect to have to dig into the detail to find out what it means.
SoD,
I have managed to wade through Gross et al and I am not favorably impressed. It is a very long and excessively wordy document; that, by itself, is only annoying. It also is very short on details of how they obtain their numbers; that is more than annoying. The combination makes me think “snow job”.
Annex 2 seems the only place where they actually provide numbers that let one examine their assumptions. The average conventional generation load factor of 85% is clearly too high and the fixed costs used seem much too low. So the estimated cost of intermittency is much too low.
In contrast, there is a very clear, more recent document at http://www.atinstitute.org/wp-content/uploads/2012/12/Hidden-Cost.pdf.
It seems obvious that the peoples paying for it have an agenda, but the document itself seems to be a decent attempt at making a fair estimate of the true costs of wind power. Indeed, in places I think they are making low estimates.
Some people have a tendency to trust documents from public agencies more than ones from private sources. I suppose they do that on the grounds that public agencies work for the public. But anyone who pays attention to politics and government ought to realize that “public servants” often have agendas that differ considerably from the best interests of the public. So I like to judge documents by their content, not their authors.
Another comment on hydro power – on basic physical principles it could be far larger than it is now. Earth’s water cycle absorbs a significant fraction of total incoming solar energy. Capturing more of that could in principle be done by building structures that catch falling rain at a high altitude and run the collected water through turbines on the way down. Hydro power right now relies on doing this with natural features of the landscape, and likely doing it with a completely artificial structure would be prohibitively expensive. But in principle there is a lot more power available from that source.
[…] « Renewables IV – Wind, Forecast Horizon & Backups […]
Lee M. Miller, Nathaniel A. Brunsell, David B. Mechem, Fabian Gansa, Andrew J. Monaghan, Robert Vautard,
David W. Keith, and Axel Kleidon
Two methods for estimating limits to large-scale wind power generation
Click to access 1408251112.full.pdf
“Significance
Wind turbines generate electricity by removing kinetic energy from the atmosphere. We show that the limited replenishment of kinetic energy from aloft limits wind power generation rates at scales sufficiently large that horizontal fluxes of kinetic energy can be ignored. We evaluate these factors with regionalatmospheric model simulations and find that generation limits can be estimated from the ‟preturbine” climatology by comparatively simple means, working best when the atmosphere between the surface and hub height is naturally well-mixed during the day. Our results show that the reduction of wind speeds and limited downward fluxes determine the limits in large-scale wind power generation to less than 1 W·m−2.”
David MacKay’s book (Sustainable Energy without the Hot Air, available for free online) helps place numbers like 1 W/m2 of electricity production in perspective. Great Britain (which has the greatest potential wind power in Europe) has 250 people per km^2 or 4000 m2 per person. If the entire country were carpeted with wind turbines, they would produce 4 kW per person (96 kWh/d/person in Mackay’s preferred units). The British currently consume about 5 kW/person (125 kWh/d/person) according to official government figures. MacKay thinks 8 kW/person (196 kWh/d/person is a more realistic. MacKay cites 2 W/m2 as the typical output from current wind farms on land, which tend to be in the windiest locations.
Electric vehicles get about 8 km/KWh (counting charging efficiency) and the average car is driven about 50 km/d. So electric vehicles consume about 6 kWh/d or 0.25 kW. So 5% (2 W/m2) to more than 10% (less than 1 W/m2) of British land will need to be devoted to wind farms simply to support electric vehicles.
Though MacKay never explicitly says so, his book gives me the impression that sustainable energy (excluding nuclear) will require significantly reducing consumption – “energy poverty” to those on the right or “conservation” to those on the left.
http://www.withouthotair.com/sewthacontents.shtml
Boels & Frank,
Energy density of renewables is another major issue that needs discussing. It’s clear that small countries with large populations will have major challenges getting renewables to produce most of their electricity.
Massive interconnects from Texas & Arizona to the UK maybe.
Besides the consequences to the bird and bat population of covering the UK with wind turbines, there’s also subsonic noise pollution. Whether this is a real health problem is still controversial.
SoD,
An Atlantic interconnector may sound fanciful, but a UK Norway link is a live project, and an Iceland project is under feasibility.
Norway is 700km, Iceland 1000km. Both are of the order of a GW.
Perhaps Iceland gives geothermal capacity and Norway pumped – storage?
http://www2.nationalgrid.com/About-us/European-business-development/Interconnectors/Iceland/
http://www2.nationalgrid.com/About-us/European-business-development/Interconnectors/norway/
Per Frank, “Without Hot Air” is an excellent resource, albeit perhaps a bit dated now and also UK centric.
verytallguy,
“An Atlantic interconnector may sound fanciful, but a UK Norway link is a live project”
At a cost of 2 billion euros for 1.4 GW: https://en.wikipedia.org/wiki/NSN_Link
That is maybe 2% of the UK’s peak demand.
verytallguy,
It doesn’t sound “fanciful”, it sounds expensive. If you built a 30GW interconnect from Texas to London, what would it cost?
$1bn? No, a lot more.
$10bn? Not even close.
$100bn? Now I’m not sure but at this stage I’ll guess still an underestimate
You could buy a whole lot of sodium/sulfur battery modules for that kind of money.
Chapter 25 of MacKay’s book discusses the possibility of the UK or other countries importing solar and wind power from countries with a low population density and high solar irradiance. Libya, Algeria, Saudi Arabia and Kazakhstan are high on his list. There is an organization that exists for the purpose of converting this vision to reality.
http://www.desertec.org
Iceland exports excess electrical energy in the form of aluminum – about 1 ton per person. With its low population, however, current renewable electric generation is minuscule compared with the needs of Great Britain.
[…] Renewables IV – Wind, Forecast Horizon & Backups – Some more detail about wind power – what do we do when the wind goes on vacation […]
[…] Renewables IV – Wind, Forecast Horizon & Backups – Some more detail about wind power – what do we do when the wind goes on vacation […]
[…] So we need baseload supply for times when intermittent renewable supply is not available (at the moment this requires a conventional power plant, as we saw in earlier sections, e.g. Part IV) […]
An interesting paper, looking at the 2020 plans for wind in Great Britain – Impact of a large penetration of wind generation on the GB gas network
Meysam Qadrdan, Modassar Chaudry, Jianzhong Wu, Nick Jenkins & Janaka Ekanayake, Energy Policy (2010).
They look at the impacts on the gas power stations due to increased ramp down / ramp up as wind cuts in / cuts out. Obviously this problem gets worse as the wind penetration in the electricity supply network increases.
“Linepack” is the gas stored in the pipeline, a very important metric for running gas systems both for consumption and for supply – i.e., from wells into LNG plants. Gas is compressible but because it is a gas and takes up a lot of volume you can’t just “stack it” on a loading bay, like you can coal.
So there is a dynamic component to gas supply in any network.
Their conclusion:
[Emphasis added].
[…] to provide power when the wind is not blowing, or not blowing much – we looked at this in IV – Wind, Forecast Horizon & Backups and in Renewable Energy […]
[…] Renewables IV – Wind, Forecast Horizon & Backups – Some more detail about wind power – what do we do when the wind goes on vacation […]
[…] Part I and IV – Wind, Forecast Horizon & Backups we looked at a few basics, including capacity credit which is basically how much […]
[…] Renewables IV – Wind, Forecast Horizon & Backups – Some more detail about wind power – what do we do when the wind goes on vacation […]