Budischak et al (2013) is a very interesting paper (and free). Here is the question they pose:
What would the electric system look like if based primarily on renewable energy sources whose output varies with weather and sunlight? Today’s electric system strives to meet three requirements: very high reliability, low cost, and, increasingly since the 1970s, reduced environmental impacts. Due to the design constraints of both climate mitigation and fossil fuel depletion, the possibility of an electric system based primarily on renewable energy is drawing increased attention from analysts.
Several studies (reviewed below) have shown that the solar resource, and the wind resource, are each alone sufficient to power all humankind’s energy needs. Renewable energy will not be limited by resources; on the contrary, the below-cited resource studies show that a shift to renewable power will increase the energy available to humanity.
But how reliable, and how costly, will be an electric system reliant on renewable energy? The common view is that a high fraction of renewable power generation would be costly, and would either often leave us in the dark or would require massive electrical storage.
Good question.
We do not find the answers to the questions posed above in the prior literature. Several studies have shown that global energy demand, roughly 12.5 TW increasing to 17 TW in 2030, can be met with just 2.5% of accessible wind and solar resources, using current technologies [refs below]. Specifically, Delucci and Jacobson pick one mix of eight renewable generation technologies, increased transmission, and storage in grid integrated vehicles (GIV), and show this one mix is sufficient to provide world electricity and fuels. However, these global studies do not assess the ability of variable generation to meet real hourly demand within a single transmission region, nor do they calculate the lowest cost mix of technologies.
Emphasis added.
[Refs: M.A. Delucchi, M.Z. Jacobson, Energy Policy, Dec. 2010; M.Z. Jacobson, M.A. Delucchi, Energy Policy, Dec. 2010; L. Brown, Plan B 4.0: Mobilizing to Save Civilization, Earth Policy Institute, 2009]
This is also what I have found – I’ve read a number of “there’s no barrier to doing this” papers including Delucchi & Jacobson – so I was glad to find this paper. (As an aside, I question some points and assumptions in this paper, but that’s less important and brief comments on those points towards the end).
The key is investigating time series based on real demand for a region and real supply based on the actual wind and sun available.
Before we look at what they did and what they found, here are some comments that are relevant for some of our recent discussions:
In a real grid, we must satisfy varying load, and with high-penetration renewables, charging and discharging storage will at times be limited by power limits not just by stored energy. More typical studies combining wind and solar do not seek any economic analysis and/or do not look at hourly match of generation to load..
Hart and Jacobson determined the least cost mix for California of wind, solar, geothermal and hydro generation. Because their mix includes dispatchable hydro, pumped hydro, geothermal, and solar thermal with storage, their variable generation (wind and photovoltaic solar) never goes above 60% of generation. Because of these existing dispatchable resources, California poses a less challenging problem than most areas elsewhere, most or all practical renewable energy sources are variable generation, and dedicated storage must be purchased for leveling power output. We cannot draw general conclusions from the California case’s results..
The ability to reliably meet load will still be required of systems in the future, despite the variability inherent in most renewable resources. However, a review of existing literature does not find a satisfactory analysis of how to do this with variable generation, nor on a regional grid-operator scale, nor at the least cost. We need to solve for all three.
What does the paper do?
- Use the demand load from PJM (East Coast grid operator) for 4 years as a basis for assessing the cost-minimized solution – with the average load being 31.5 GW
- Assign a cost (unsubsidized) to each type of renewable resource: onshore wind, offshore wind, solar based on 2008 costs and forecasts for 2030 costs (roughly 50% of 2008 capex costs with similar O&M costs)
- Assign a cost to 3 different storage types: centralized hydrogen, centralized batteries, and grid integrated vehicles (GIV)
- And then run through nearly 2 billion or so combinations to first ensure demand is met, then secondly calculate the cost of each combination
From Budischak et al 2013
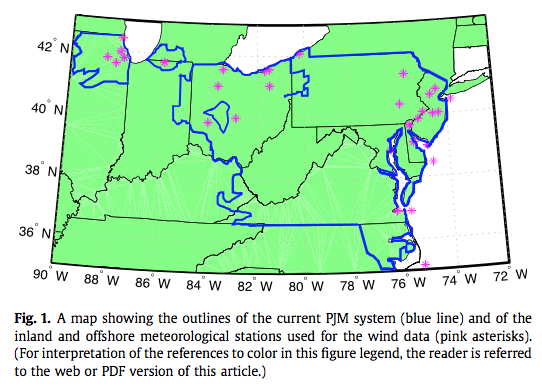
Figure 1
An most important note for me, something we will review in future articles, rather than here, is the very low cost assigned to storage using vehicle batteries – at $32/kWh, whereas centralized storage is $318/kWh. It’s clear, as we will see, that storage costs skew the analysis strongly.
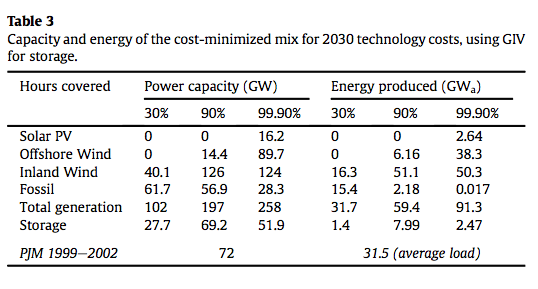
Here was their lowest cost solution for 30%, 90% and 99.9% renewables. The results are probably not so surprising to people who’ve followed the series so far. Energy Produced GWa is basically the average power over the year (so 8760 GWh, which is a constant 1GW all year = 1 GWa):
From Budischak et al 2013
Figure 2
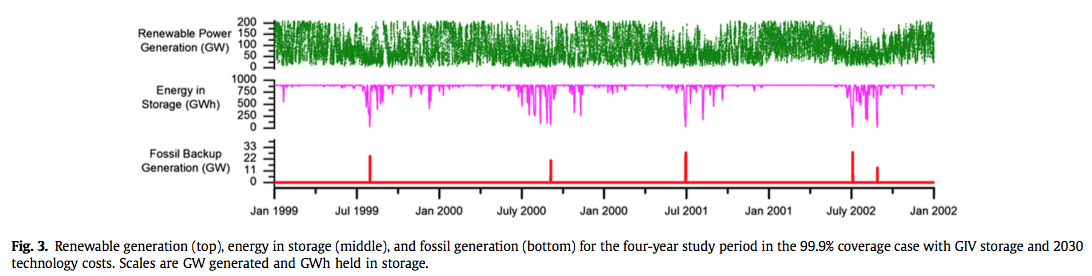
So we can see that the lowest cost method of matching demand is to produce almost 3 times the required demand. That is, the energy produced across the year averages at 91.3 GW (and appears to have peaks around 200GW). This is because storage costs so much – and because supply is intermittent. Here is the time series – click to expand:
From Budischak et al 2013
Figure 3 – Click to Expand
We see that the energy in storage (middle row) is pulled down in summer, which the paper explains as due to less supply in summer (generally less wind).
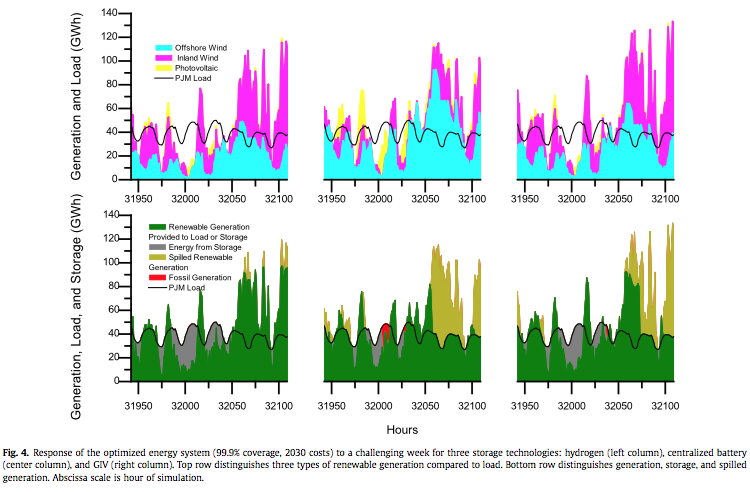
Here is a challenging week in detail, the top graph shows the gaps that need to be filled in with storage, the bottom graphs with the gaps filled by storage and also how much supply is “spilled“:
From Budischak et al 2013
Figure 4 – Click to Expand
Here is the mix of generation and storage for each of the 30%, 90%, 99.9% each under the two cost assumptions of 2008 and 2030:
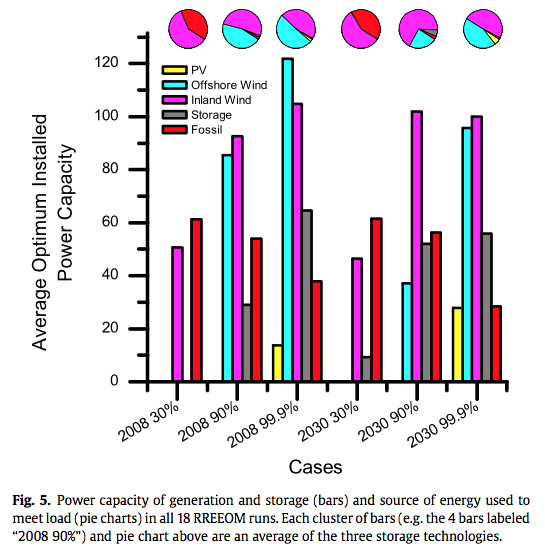
From Budischak et al 2013
Figure 5 – Click to Expand
Looking at the 99.9% cases we see that the projected solar PV cost in 2030 means it has a bigger share compared with wind but that wind is still the dominant power source by a long way. (We will investigate offshore wind costs and reliability in a future article).
Costs
The paper assesses that generating 30% of power from renewables today is already cheaper than conventional generation, and producing 90% in 2030 will be cheaper than conventional generation, with 99.9% at parity.
The key point I would like to draw readers attention to, is that unlike conventional generation, the higher the penetration of renewables the more expensive the solution (because the intermittency is then a bigger problem and so requires a more costly solution).
I’m not clear how they get to the result of renewables already being cheaper than conventional (for a 30% penetration). Their wind power cost from 2008 is roughly double what we found from a variety of sources (see IX – Onshore Wind Costs & XI – Cost of Gas Plants vs Wind Farms) and we found – depending on the gas price and the discount rate – that wind at that price was generally somewhat more expensive than gas. Using current US gas prices this is definitely the case. The authors comment that there are significant subsidies for conventional generation – I have not dug into that as yet.
The cost of storage seems low. If we take instead their cost of centralized storage – $318/kWh – and look at the lowest-cost solution to meet demand we find quite a different result. First, there is a lot less storage – 360 vs 891 GWh. That’s because it’s so pricey.
Second, although the final cost per kWh of energy is not given, we can see that whereas in the GIV storage case we build 16GW solar, 90GW offshore wind, 124GW inland wind = 230GW peak, with centralized storage we build 50, 129, 61 = 240GW peak and probably need the expensive offshore wind as a more reliable (less intermittent) source than onshore wind.
My basic calculation from his data is that the capital cost of the best case central storage solution is 45% more than the GIV storage solution. And more offshore wind will definitely require additional transmission cost (which was not included in the study).
I like their approach. What is clear is that finding the best cost solution depends heavily on the cost of storage, and the mix is radically different for different storage costs. Again, it is the intermittent nature of renewables for the region in question that shapes the result.
Questions on the Analysis
We simplify our grid model by assuming perfect transmission within PJM (sometimes called a “copper plate” assumption), and no transmission to adjacent grids. We also simplify by ignoring reserve requirements, within-hourly fluctuations and ramp rates; these would be easily covered with the amount of fast storage contemplated here. In addition, we assume no preloading of storage from fossil (based on forecasting) and no demand-side management. Adding transmission would raise the costs of the renewable systems calculated here, whereas using adjacent grids, demand management, and forecasting all would lower costs. We judge the latter factors substantially larger, and thus assert (without calculation) that the net effect of adding all these factors together would not raise the costs per kWh above those we calculate below.
Their analysis consumed a lot of computing resources. Adding transmission costs would add another level of complexity. However, I don’t agree with the conclusion that the transmission costs would be offset by adjacent grids, demand management and forecasting.
In brief:
- Adjacent grids have the exact same problem – the wind and solar are moving approximately in sync – meaning supply in adjacent regions is quite highly correlated; and hot and cold temperatures are likewise in sync so air-conditioning and heating demand is similar in adjacent regions – therefore another region will be drawing on their storage at the same times as the PJM region. Also, “using adjacent grids” means adding even longer transmission lines of very high capacity. That has a cost.
- “Demand management” is possibly a mythical creation to solve the problem of demand being at the “wrong time”. Apart from paying big industrials to turn off power during peak demand, which is already in play for most grid operators, it apparently equates to people not turning on the heating in the cold weather – or to people buying expensive storage. I will be looking for research with some data that puts “demand management” into some reality-based focus.
- Forecasting doesn’t exactly help, unless you have demand management. Better wind forecasting currently helps grid operators because it allows them to buy reserve (conventional generation) at the right time, making a more efficient use of conventional generation. I can’t see how it helps a mostly renewable scenario to be more cost-effective. Perhaps someone can explain to me what I am missing.
And I will dig into storage costs in a future article.
Conclusion
The paper is very good overall – their approach is the important aspect. There are a great many papers which all confidently state that there is no technical barrier to 100% renewables. This is true. But maybe two or three papers is enough.
If you add “enough” wind farms and “enough” solar and “enough” storage – along with “enough” transmission – you can make the grid work. But what is the cost and how exactly are you going to solve the problems? After the first few papers to consider this question, any subsequent ones that don’t actually cover the critical problem of electricity grids with intermittent renewables are basically a waste of time.
What is the critical problem? Given that storage is extremely expensive, and given the intermittent nature of renewables with the worst week of low sun and low wind in a given region – how do you actually make it work? Because yes, there is a barrier to making a 100% renewable network operate reliably. It’s not technical, as such, not if you have infinite money..
It should be crystal clear that if you need 500GW of average supply to run the US you can’t just build 500GW of “nameplate” renewable capacity. And you can’t just build 500GW / capacity factor of renewable capacity (e.g. if we required 500GW just from wind we would build something like 1.2-1.5TW due to the 30-40% capacity factor of wind) and just add “affordable storage”.
So, there is no technical barrier to powering the entire US from a renewable grid with lots of storage. Probably $50TR will be enough for the storage. Or forget the storage and just build 10x the nameplate of wind farms and have a transmission grid of 500GW around the entire country. Probably the 5TW of wind farms will only cost $5TR and the redundant transmission grid will only cost $20TR – so that’s only $25TR.
Hopefully, the point is clear. It’s a different story from dispatchable conventional generation. Adding up the possible total energy from wind and solar is step 1 and that’s been done multiple times. The critical item, missing from many papers, is to actually analyze the demand and supply options with respect to a time series and find out what is missing. And find some sensible mix of generation and storage (and transmission, although that was not analyzed in this paper) that matches supply and demand.
So this paper has a lot of merit.
It shows with their storage costs (which seem very low), that the lowest cost solution to building a 99.9% renewable network in one (reasonable sized) region is to build nearly 3 times the actual supply needed (this is not a “capacity factor” issue – see note 2).
In future articles we will look at storage costs, as I have questions about their costing. But the main points from this paper are more than enough for one article.
Articles in this Series
Renewable Energy I – Introduction
Renewables II – Solar and Free Lunches – Solar power
Renewables III – US Grid Operators’ Opinions – The grid operators’ concerns
Renewables IV – Wind, Forecast Horizon & Backups – Some more detail about wind power – what do we do when the wind goes on vacation
Renewables V – Grid Stability As Wind Power Penetration Increases
Renewables VI – Report says.. 100% Renewables by 2030 or 2050
Renewables VII – Feasibility and Reality – Geothermal example
Renewables VIII – Transmission Costs And Outsourcing Renewable Generation
Renewables IX – Onshore Wind Costs
Renewables X – Nationalism vs Inter-Nationalism
Renewables XI – Cost of Gas Plants vs Wind Farms
Renewables XII – Windpower as Baseload and SuperGrids
Renewables XIII – One of Wind’s Hidden Costs
Renewables XIV – Minimized Cost of 99.9% Renewable Study
Renewables XV – Offshore Wind Costs
Renewables XVI – JP Morgan advises
Renewables XVII – Demand Management 1
Renewables XVIII – Demand Management & Levelized Cost
Renewables XIX – Behind the Executive Summary and Reality vs Dreams
References
Cost-minimized combinations of wind power, solar power and electrochemical storage, powering the grid up to 99.9% of the time, Cory Budischak, DeAnna Sewell, Heather Thomson, Leon Mach, Dana E. Veron & Willett Kempton, Journal of Power Sources (2013) – free paper
Notes
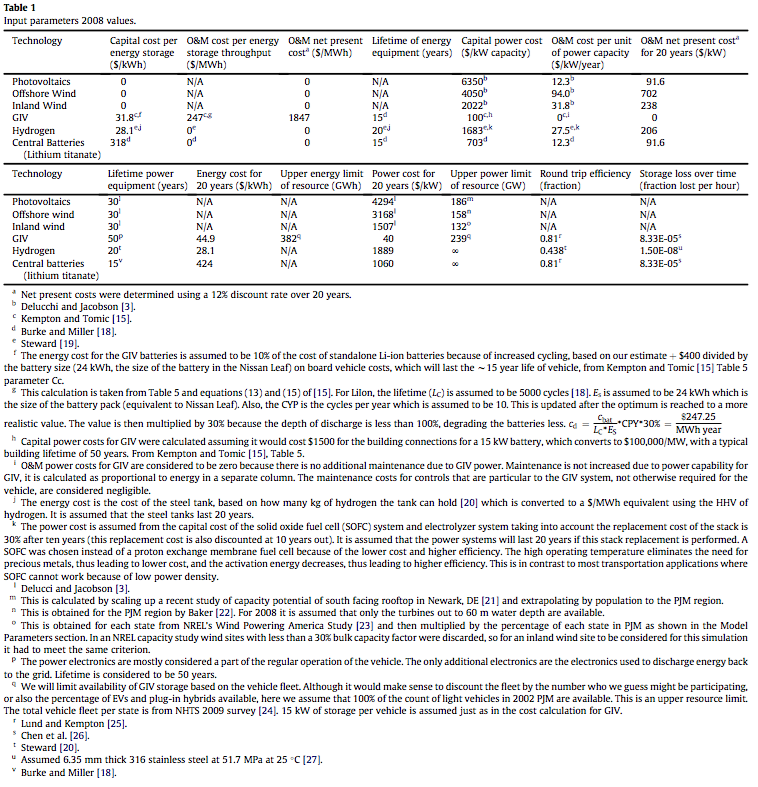
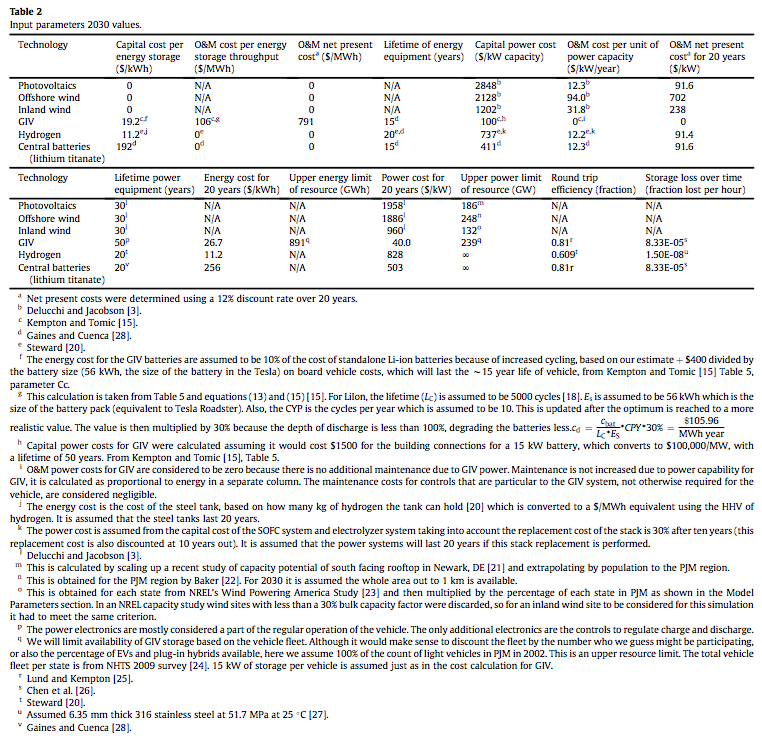
Note 1: Tables 1 & 2 of cost estimates with notes from Budischak et al 2013 – click to expand
Note 2: The 2-3 overbuilding is not the nameplate vs capacity factor question. Let me explain. Imagine we are only talking about wind. If we build 3GW of wind farms we might get 1GW of average output across a year. This is a 33% capacity factor. The % depends on the wind turbines and where they are located.
Now if we need to get 1GW average across the year and meet demand 99.9% of the time, the lowest cost solution won’t be to build 3GW of nameplate (=1GW of average output) and add lots of storage, instead it will be to build 9GW of nameplate and some storage.


Their reference for the GIV 2008 cost is:
Vehicle-to-grid power fundamentals: Calculating capacity and net revenue, W Kempton & J Tomić, Journal of power sources (2005) – free paper.
Basing electricity storage on GIV looks rather problematic to me. Firstly the cost for electricity storage is simply hidden in the consumer price for electric cars. These currently cost over 50% more than petrol cars. Each car battery will also need replacing every 5-6 years.
Second problem is the assumption that the grid can suck energy out of the vehicle batteries to cover quasi-random shortfalls in wind/solar output. This would cause chaos in the morning if all car batteries were flat after a night of no wind.
So far all energy storage schemes make renewables uneconomic, once you factor in the Energy costs of building the storage, and include the losses incurred by cycling electrical energy through storage and back again.
This has been studied recently by Weissbach et al. : Energy intensities, EROIs, and energy payback times of electricity
generating power plants
Click to access Weissbach_EROI_preprint.pdf
During the 1970s oil crisis, the shortage of gas and the gas lines were made much worse by the fact that everyone filled up when their tank was 3/4 or 1/2 full. 3X the usual numer of visits to gas stations; twice as much gas in riding around in tanks – making the problem far worse. Nevertheless, advocates of renewable power believe that sheep (citizens) will leave their EVs plugged into the grid when the weather forecast calls for low wind (and a shortage of electricity) and that this “reserve” will make renewable energy practical.
Electric vehicle storage is a non-starter for obvious reasons. Nobody will strand themselves to support the grid. The plausible alternative is residential storage to allow continued “normal” use of a residence even when renewable energy is not available.
A reasonable current cost for storage is on the order of US$0.10 per KWH stored in direct battery destruction. (This may go down a bit if battery technology, lifetime delivered KWHs relative to replacement cost, improves.)
Average residential usage in the USA is near 930 KWH per month…. or 30 KWH per day. If the annually averaged daily amount of energy stored is 50% of daily usage, then the marginal increase in electricity cost from battery burn rate would be on the order of US$0.05 per KWH plus CAPEX. CAPEX will depend on the size of the storage system. If we assume 60 KWH total capacity (two days of independence from the grid) and assume 8% interest and $500 cost per KWH of capacity, then CAPEX comes to about US$200 per month. So total residential cost would be the purchase price for grid power (~US$0.12) plus battery burn (about $0.05 per KWH) plus $200/930 = US$0.215, or about US$0.385 per KWH….. even higher than electricity rates in sunny Germany. A typical residence would see an increase of about US$245 per month!
If you assume smaller installed capacity (say 30 KWH) and proportionally lower CAPEX, then the cost per KWH might drop to US$0.27 per KWH. Improvements in battery technology might drop that by a few cents… maybe $0.24 per KWH. That means about US$110 per month higher cost for the average residence compared to now.
Of course, in response to high electricity costs, there would certainly be some drop in usage; how much is not clear, but any reduction in usage would come with higher CAPEX for more efficiency (better insulation, more efficient appliances, LED lights, etc).
There are no panaceas for “CO2 free” electricity… unless you are willing to use nuclear power.
SoD,
You wrote “I’m not clear how they get to the result of renewables already being cheaper than conventional (for a 30% penetration)”
So far I have only glanced at the paper, but I think the answer is in Table 7 and the corresponding discussion on page 13 of the paper. They claim that the present cost of electricity (not clear if it is wholesale or retail) for PJM is $0.175 per kWh. They get that by adding a bunch of externalities to the actual cost. I have not yet looked, but I bet they ignore the externalities of wind power.
They claim in the abstract that “the electric system can be powered 90%-99.9% of hours entirely on renewable electricity, at costs comparable to today’s”. I wondered how that can be, when they need to overbuild expensive capacity by a factor of three. Part of the answer is by inflating current costs (as per above) and the another part might be by deflating the future cost of wind. They assume a factor of two drop in price for both onshore and offshore wind. But that seems questionable to me; wind turbines are pretty much mature technology and there are indications that the price has stopped dropping. In future, wind turbine prices might even go up if a massive build up causes shortages in the rare earths used.
In their conclusions they say “So much excess generation of renewables is a new idea, but it is not problematic or inefficient, any more than it is problematic to build a thermal power plant requiring fuel input at 250% of the electrical output, as we do today”
In principle that is true, and constitutes an important point.
Then they add “Over-generation is cost-effective at 2030 technology costs even when all excess is spilled”.
I think this is only true if the capital cost of the excess wind capacity is not significantly higher than the capital cost of excess capacity in the form of gas peaker plants. And that would have to take into account not only the capital cost per kW but also the fact that more excess capacity will be needed for wind than for gas.
The problem with studies like this is that the authors know what result they want and adjust assumptions accordingly. That said, the Budischak et al paper is a big improvement on what I’ve seen from the Jacobsen group.
It would be interesting to see the analysis produced by Budischak et al (2013) repeated for the UK, where the energy consumption pattern is very different from that in NE USA.
The main differences I can identify are:
1. The maximum demand in the UK is early evening in January, so no solar input and possibly very little solar energy in storage.
2. The maximum demand often corresponds with periods of high pressure, so wind output is also low.
3. As the UK maximum demand is in the winter, heating demand is high when solar and possibly wind are at low output, so no surplus energy to supplant natural gas as the primary source of domestic heating.
4. The UK is constrained by the combination of high population density, high energy demand and relatively small area available.
The assumption that electric vehicles, whether purely battery or PHEV (using fuel cells rather than IC engines), will dominate road transport by 3020 will significantly increase the electrical demand – using UK 2009 values energy consumption of conventional road vehicles was about 430 TW.h, converting that to electrical energy and assuming an efficiency improvement from 25% to 50%, the additional electrical energy required would be about 215 TW.h a 60% increase in annual electricity consumption. This can be provided during periods of low demand (early morning) but it will increase the average load on the grid and may affect the energy available for storage.
Would car users allow their vehicle batteries to be used as storage would largely depend on the advantages they gained from their electricity tariff and their car usage. As someone who is retired, I don’t use my car several days each week so, providing the battery is full when I need it, I would not be inconvenienced. As electricity demand in the early hours is low, any battery drain could be recharged overnight for those requiring their car during the day. Obviously, the tariff would have to permit users to decline the use of their car when it would be inconvenient.
The value of the external costs of conventional power was assessed in an EU study (‘External costs – Research results on socio-environmental damages due to electricity and transport’, published – 2003), which put this cost at between 0.04 and 0.07€ per kW.h for UK electricity at 2003 prices. I’m not sure what the present day costs would be but, judging by the air quality in major cities, probably significantly higher.
SOD wrote: “So this paper has a lot of merit. It shows with their storage costs (which seem very low), that the lowest cost solution to building a 99.9% renewable network in one (reasonable sized) region is to build nearly 3 times the actual supply needed (this is not a “capacity factor” issue).
I think you give the authors too much credit. Their novel approach to intermittency probably got them funding for their work. Since they didn’t report their results with candor and completeness, the result is just another round of propaganda enabled by GIGO. The press release associated with this paper is even worse:
http://www.udel.edu/udaily/2013/dec/renewable-energy-121012.html
1) How can a paper entitled: “Cost-minimized combinations …” not report the total cost of these combinations?
2) How can they discuss the cost of current power generation without making it clear that they added negative externalities of $0.095/kWh to the cost of current power generation of $0.08/kWh? (hidden in Table 7.) When they say costs “competitive with today”, they mean customers paying TWICE as much on their electric bill and hoping that someone, somewhere (anywhere in the world?), sometime saves the difference.
3) The abstract says: “We find that the least cost solutions yield seemingly-excessive generation capacity—at times, almost three times the electricity needed to meet electrical load.”
“Generation capacity” sure sounds like nameplate capacity to me. As you noted (but relegated to a footnote), they project a nameplate renewable capacity about 9X higher than average consumption. (See Table 8)
4) The capacity factor (hidden in the Appendix) for inland wind was predicted to be 40% with no discussion of the typical capacity factor for wind farms in the PJM area. The assumed capacity factor for off-shore wind isn’t even mentioned.
5) The GIV storage option is unrealistic. (GIV or grid in vehicles means energy stored in batteries in cars is used when renewables aren’t available. They assume that 15 kW (presumably they mean kWh) of storage will be available from EVERY light duty vehicle in the study area. (Their note q.) For cost, they reference the 24 kWh battery in the Nissan Leaf and charge 10% of the capital cost of that battery for the right to use its stored energy – presumably whenever needed to meet demand. Even with this assumption, storage is only 22 hours of average consumption; not enough to fully meet the demand for stored power.
6) The cost of central battery storage is 10X higher than GIV storage, so only 9 hours of storage is planned for that system. So how do they get 99.9% reliability with a smaller reserve? (Apparently swapping some cheaper wind generation for PV reduces the need to tap stored power on summer days.)
7) I can’t figure out why the cost of storing energy as hydrogen is so low. The main reference (#19 and #20) is to the NREL presentation linked below, which I interpret to say that hydrogen storage is more expensive than pumped hydro and compressed air, but competitive with sodium/sulfur batteries. If so, the cost of hydrogen storage should be comparable to central battery storage.
Click to access 45873.pdf
8) That leaves as the only realistic option the central batteries with about 400 GWh (9 h) of battery storage.
9) The authors say about Figure 4: “We selected the week of Fig. 4 because it was one of the most challenging. During this week, fossil was dispatched to meet load in all three storage cases. In the hydrogen case load was not met because of the power limitation from storage (lower left figure, barely perceptible red tick near the peak of day three), whereas in the centralized battery and GIV cases it is not met because of the energy limit of storage, that is, storage was empty”
However, Figure 3 shows the key information: How much demand must be met by fossil fuel plants or by leaving demand unmet or reduced by incentives? Figure 3 shows that the shortage was about 10 GW of power (about 1/3 of average demand) and that the other four shortages would have been 2-3 fold bigger. These would not be minor rolling brownouts or blackouts. Most of the current fossil fuel generating infrastructure would need to be maintained if it were used to meet these four shortages. The cost of doing so would be astronomical in terms of $/GW. A Figure 3 for the only realistic scenario (central batteries) would be interesting to see – the reserve for this option is only 9 h (vs 22 h).
Doesn’t it bother you that ALL of the above factors downplay the difficulty and cost of meeting demand with a high penetrance of renewable energy?
Frank,
You are absolutely correct that the paper downplays the difficulty and cost of meeting demand with renewable energy.
One correction. You ask: “How can a paper entitled: “Cost-minimized combinations …” not report the total cost of these combinations?”
They do report the costs in Table 4. For 99.9% penetration with central battery storage, they get $0.25/kWh using their assumed 2030 costs and $0.45/kWh using the more realistic current costs. With a more realistic wind capacity factor of 30%, the latter would be more like $0.60/kWh.
Mike M: Thank you very much for the important correction.
The 2008 80% and 99.9% plans call for 124 GW in inland wind. Given average production of 2 W/m2 (MacKay) from land devoted to wind farms, that would require 6.2*10^10 m2 or 6.2*10^4 km2 – half the size of the state of Pennsylvania. So perhaps 5-10% of the PJM surface area would need to be devoted to wind farms.
If we look at the 90% renewable option (which costs about half as much today), we need a reserve capacity of about 30 GW (average load, perhaps half of today’s capacity) that produces an average output of 2 GW. How much does it cost to run a fossil fuel plant 7% of the time? Capital expense, not fuel cost, will dominate. I suspect they haven’t included this problem in their analysis (since they don’t discuss the fixed and variable costs non-renewable sources). And nuclear, which is almost all fixed cost, is the worst.
Of course, generating most power from nuclear is the cheapest option by far. The Swiss supply all of their baseload demand using nuclear power with hydro to meet variable demand. They buy cheap excess power from Germany during summer days, pump water back up into their dams, and sell power to the Germans during their peak demand in the winter. There are other options that reduce CO2 emissions besides overbuilding wind and solar.
Some general comments in response to questions from a few people..
I have questions about the paper, and questions about their numbers. But the numbers are out in the open.
Whether or not 50% reduction in wind power by 2030 is reasonable or not, is not the point. The value will be lower than today. If the cost is only 25% lower then the result will be different. We can see their numbers.
The external costs / subsidy costs of conventional energy may be wrong, but I have not investigated so far, so can have no comment on whether these values are correct. They might be completely reasonable. I don’t know.
The key point for me – why I like the paper – is that it demonstrates the high volume of “100% renewable is achievable” papers are worthless. And it shows why. And it demonstrates that without a careful analysis of the time-series, the storage issues and the storage costs, building out the “wrong renewables” may fatally flaw the future grid.
Perhaps their highlights and conclusion are poor.
Here would be my conclusion from their paper:
Now that I’ve rewritten the conclusion that obviously arrived from the paper, I do accept the criticism that I’ve should have been more critical of this paper.
In my defence, I’ve read lots of “100% renewable papers” which all avoid the main problem, or just add a throwaway comment on (the miracle of) demand management / affordable storage to solve the “minor problems” arising from the actual problem at hand.
..and also.. re Frank’s earlier comment about the cost of the conventional backup..
The extras that are missing are:
– the transmission costs
– the cost of maintaining fossil fuel plants for the few days a year they are needed
The authors did note that the main constraint of their analysis was the computing power required to work through the 1.7BN combinations.
The second point could have been easily included – not with inclusion in the cost-minimized solution, but just added as an extra cost. However, it’s reasonable to say existing generation has already been paid for and can be used. If we fast forward to 2050 this has to rebuilt, and at some point the cost has to be incurred and it is definitely an “extra”.
On the first point, if we run the same scenarios to find the cost minimized solution including transmission costs it would be a massive undertaking.
I think it needs to be done. I expect the answer will be surprising (high cost), but it would be good to see. And if additionally a few scenarios with different % reductions in 2030 are run, and different costs of storage – we will see a map of a landscape.
This multi-dimensional landscape might contain smooth contours that enable planners to see that – for example/illustration – onshore wind will be between 30-50% of total output for any reasonable cost of storage and transmission – and so at least some planning be done independently of this final answer.
Alternatively, this multi-dimensional landscape might contain very sharp contours that enable planners to see that without knowing future storage costs it is possible to waste vast sums of money on the wrong generation capacity.
This last point seems so obvious to me that perhaps I have not highlighted it enough.
Dispatchable generation has maybe lulled everyone into a false sense of security. You run the plants when you need them. You place the generation source next to the city that needs them most (minimal transmission cost) and add some transmission capacity to remote cities for extreme conditions (outages).
With intermittent sources the story is completely different.
Without major planning the story does not have a happy ending.
The potential for a very unhappy ending is real enough, but I suspect that ‘experiments’ which are being conducted by countries like the UK and Germany will provide useful guidance on what not to do, if not on what should be done. Eye-watering residential electricity costs in those places, due in part from shielding industry from much of the cost of renewables, will get the attention of voters (and so politicians) elsewhere.
SOD summary included: We demonstrate that with a storage cost of 10% of centralized grid storage – by “renting” storage from consumers’ future electric vehicles (predicted for the purposes of this study to be every vehicle in the region) – that we “only” need to build out 3x the generation capacity that would be expected. This is due to the intermittency of wind and solar.”
More clearly: “that we “only” need to build out 3x the average expected output, which is typically 20-40% of nameplate capacity. Both factors are due to the intermittency of wind and solar.”
SOD: You are correct that these authors deserve credit for research that invalidates previous work on the practicality of getting most of our electricity from renewable sources – though they chose not to say so. Were they actually appalled at the implications of their work, but obligated to publish something after significant investment in computation?
Some of the authors belong to the “Center For Carbon Free Power Integration” in the College of Earth Ocean and Environment at the University of Delaware. If the work had been done in an Engineering Department, it might have been reported differently.
http://www.ceoe.udel.edu/research/research-centers
However, the authors didn’t publish this work in a journal read by environmentalists or policy-makers. It was published in a journal containing articles on technical aspects of batteries and fuel cells.
“Journal of Power Sources is the journal for researchers and technologists interested in all aspects of the science, technology and applications of sources of electrochemical power. Journal of Power Sources publishes original research and reviews about the science and applications of primary and secondary batteries, fuel cells, supercapacitors and photo-electrochemical cells.
Topics considered include the research, development and applications of nanomaterials and novel componentry for these devices.
Examples of applications of these electrochemical power sources include:
• Portable Electronics
• Electric and Hybrid Electric Vehicles
• Uninterruptible Power Supply (UPS) Systems
• Storage of renewable energy
• Satellites and deep space probes
• Boats and ships
http://www.journals.elsevier.com/journal-of-power-sources
SOD discourages speculation about motivation (a sensible policy IMO).
Any study that shows that 100% renewable (or close enough) requires total energy generation of 3x the total demand is nonsense. Take a look at the report on achieving 100% renewable in Australia produced by AEMO (the market operator) in 2013. The “spilled” energy was perhaps 15% of the total demand, a very long way from 200%…
This sort of scenario has been analysed multiple times over the last decade. I have never before seen any estimates that required such a high level of spilled energy – it is just not credible.
Stuart,
Where is their mistake? Their methodology is different, but in some ways more complete.
Have you read their paper? They point out that correct you don’t need to generate 3x total demand. But this works out to be the least cost solution (for this region) because of the high cost of storage.
1. The AEMO study (see VI – Report says.. 100% Renewables by 2030 or 2050) uses a significant amount of CST (solar with storage). This is forecast to be over 3x the cost of PV solar. They also have quite a lot of biomass burning. This is “dispatchable” – i.e., it can function as baseload power. They require 5000km2 of land to be acquired (uncosted).
From AEMO study
2. I note again that every region is different.
The problem is minimal wind and sun for a period of many days. The longer the time period you study the more likely you will have an extended outage.
But it depends on the region. The AEMO study was for half of Australia with lots of reliable sun. This study is for an eastern region of the US.
3. The AEMO study has a problem that it doesn’t solve – lots of reliable solar power in the middle of the day but a peak of demand in the evenings. It simply requires “demand management”. That is, their solution can’t meet demand it requires someone to change demand.
From the AEMO study:
This study on the PJM region doesn’t require “demand management”, it supplies the demand.
This is really the key to understanding the gap in many of these 100% studies. They don’t cost up the problem of supply being at “the wrong time”, they require demand to change.
Yes, all the assumptions in this kind of analysis are regional-dependent. But for large enough regions, the overall picture doesn’t change much. (The exact mix of technologies will change, but that’s really all.)
I don’t know where their error is, but generating 3x more energy than the actual demand is nuts – there’s no way that’s correct. Probably their cost of storage is too high or they have some ridiculously cheap intermittent energy source.
Demand management is not a failure of the AEMO study – it’s a just one sensible component of any sane electricity markets. Any study (like this one) that doesn’t include demand management is missing a key element. And it shows a disturbing lack of knowledge about issues in electricity markets today – demand management has been discussed for years.
Demand management is not complicated. In fact, it’s already in place for several large industrial energy users in Australia. They curtail their load when spot prices are high, and receive a payment from the market for doing so. This is cheaper (lower total cost to the market) than the extra generation that would otherwise be required.
In some places in Australia, even home consumers can manage their costs by choosing to manage their demand. (E.g. they can get lower bills if they schedule their heating to turn off for a couple of peak hours per day.) This is early days for demand management at the small customer level, but it is an area that is going to become more important over time.
I read the comments in your previous article criticising the cost and generation assumptions in the AEMO study. Most of the criticisms are just factually wrong. The costs and capacity factors for wind farms are realistic. Biogas plants are cheap and there is a huge untapped resource for them – they burn agricultural waste from existing farms. And so on.
I’m not saying the AEMO report was perfect – I have many criticisms about it in fact, but the overall picture is sound for the market it describes.
Stuart Allie,
“But for large enough regions, the overall picture doesn’t change much.”
That is just not true unless the regions are so large that transmission becomes a major problem. Indeed the PJM area in the study SoD reports on is already to some extent too large; there are a number of nodes in the PJM area that each run a largely independent market, due to transmission limitations.
In some areas, like the southwestern U.S., solar is sufficiently reliable that the main issue with matching demand is time-of-day. I think that may be the case, or at least assumed, in the Australian study. In such a case storage might be practical, since only a few hours of storage might be needed, but still not cheap. But in a place like the U.S. midwest, you can easily have a week with very little sun and/or wind. To cope with that you likely need at least an order of magnitude more storage than for diurnal variations. That would be massively expensive. The cheaper alternative is to have considerable excess generating capacity.
A “large enough” region is huge. SoD has previously shown results from a paper analyzing an array of offshore wind farms along the entire U.S. east coast that shows week long periods of low production. Large enough requires that the weather in one part of the region be uncorrelated with weather in other parts. In mid-latitudes the distance over which weather becomes uncorrelated is of the order of the Rossby wavelength. If memory serves, that is about 6000 km. That is too large for efficient transmission at reasonable cost.
You are almost surely wrong about biogas. The evidence is the fact that it is not widely employed.
Stuart,
The aim of this blog is to critically examine climate science, and recently, renewable energy.
“..but generating 3x more energy.. is nuts” is not critical examination. Find the flaw, that’s all we ask.
If it’s nuts this task should be easy. We value critical analysis here.
Their cost of storage is in their paper. Have you read it?
Dismissing stuff you haven’t read because it reaches a different conclusion than other papers isn’t the kind of analysis we are looking for.
What I look for in a paper which gets a different result from many previous papers is they explain what is wrong with previous papers. Well, they actually do that.
Their cost of storage in 2030, table 2, 6th page of the report:
– GIV $19/kWh
– Centralized storage $192/kWh
Why do they have to generate 3x the actual demand? Again, answer in the paper. Because within the 4 year period of examination, for periods of days, the actual output is only a fraction of the average output.
You can see the draw down on the storage in their figure 3 which I reproduce in this article.
The choice – more storage and less wind farms, or less storage and more wind farms. Storage is more expensive than wind farms so that’s how their result comes out like it does.
““..but generating 3x more energy.. is nuts” is not critical examination. Find the flaw, that’s all we ask.”
Well, I’m basing “… is nuts” on a decade and a half of looking at this stuff as part of my day job. Sometimes experience enables one to see that a result must be wrong even if the detailed reason it is wrong is not immediately obvious.
But having looked at their paper in a bit more detail, there is one obvious mistake. They have the capital cost of wind decreasing more between 2008 and 2030 than the cost of centralised batteries. Since wind is already a mature technology and batteries are not, this makes no sense. So combine their overblown storage costs (in 2030) with a lack of demand management and you have a completely unrealistic outcome.
Stuart,
Their cost of storage is $19/kWh for this – the least cost scenario. This relies on 100% of cars being converted to electric and available for the grid to use as storage.
What do you think is a realistic cost in 2030 for storage?
I was talking about their centralised battery costs as being unrealistic relative to wind, not their GIV costs. But you asking what I think the costs should be gets to the cause of the problem: you’re making the “single study syndrome” error – let me explain.
You have a single paper on a single scenario run through a single model. Other than saying “this model with these assumptions gives you these outputs” this tells you nothing useful. You cannot use a single model run to reliably draw general conclusions about renewable energy. I find it hilarious that this was even considered worth publishing!
In the industry this kind of work is done routinely, with multiple scenarios and multiple models. Nobody would ever dream of taking a single scenario as telling us anything useful about what the future would look like! It’s interesting when a range of scenarios spits out the same optimal solution, but no single result is meaningful.
If somebody wrote a blog post discussing the results from a single run of a single climate model with a single set of forcings and they tried to draw *general* conclusions about the future evolution of the climate, you’d point out that they were being a bit silly, wouldn’t you? Well…
If you are trying to answer the big questions about renewable energy, that’s surprisingly easy. Yes, almost everybody, almost everywhere, *could* have reliable electricity supplied by 100% – or close to it – renewable sources. In the industry, there’s been no real doubt about that for some years now. (Public statements to the contrary notwithstanding.) The only question – and I do mean “only” – that anybody cares about is: who is going to pay for it?
Stuart,
A single paper can point out the weaknesses of many other papers that fail to address an important issue.
They run through a lot of scenarios, 1.7bn of them, grouped into 6 categories.
The solution which gives the lowest cost while meeting demand every hour of the day for 4 years has GIV as the storage solution. The GIV cost is calculated as 10% of centralized storage.
What do you think is a reasonable cost for centralized storage?
I’m trying to get you to do put down some assumptions or data. Rather than just asserting the costs in the paper are unrealistic, the whole thing is nonsense, just add demand management and that’s that.
The fact that demand management has been discussed for a long time and the fact the people are trying ideas with a sample of consumers and finding some nice results on a few people doesn’t demonstrate that “demand management” will solve all problems of matching supply and demand.
The problem in the PJM region is obvious from the graph. As it seems you knew without reading the paper that it was nonsense, can you explain the demand management solution for figure 3 and figure 4?
—-
I will write more on “demand management” and storage in future articles – as I already promised in this article.
Stuart,
Your opportunity to fill us in, given my disturbing lack of knowledge.
As I asked in the article:
“..Apart from paying big industrials to turn off power during peak demand, which is already in play for most grid operators, it apparently equates to people not turning on the heating in the cold weather – or to people buying expensive storage..”
What is going to move consumer demand sufficiently?
Who has demonstrated this?
How will it happen without “affordable storage”? And what is the price point?
What is the impact if consumer demand does not move?
Stuart,
I’ll also reproduce my comment on demand management from the AEMO study so you can assist in redressing my disturbing lack of knowledge on electricity issues:
Sorry – I didn’t see the “reply” link at first so I’ve mucked up the order of comments now… my bad.
There are a few things that are coming together (in Australia at least) that will drive consumer-level demand management: replacing old total usage meters with “smart” meters; demand-related tariffs (“time-of-day” or “cost reflective” pricing); and remote controlled appliances (with the software to match).
Basically, once smart meters are installed and the suppliers start using them to bill people using tariffs that are higher during high demand periods, people will see this on their bills and act to reduce their usage at high cost times. This has already started to happen in some parts of the National Electricity Market in Australia and the expectation is that it will spread through the whole market over the next decade.
As an example, I’m aware of one trial program with customers testing different combinations of solar PV, solar hot water, battery storage, heat bank storage, etc. They are fed a simulated time-of-day price and allowed to respond however they like. They have smartphone apps showing their usage (and cost) in real time, as well as giving them remote control over their electric heating and cooling. It doesn’t take long before people start changing their usage patterns to reduce their total costs. Simply turning on their heating at 3pm and off at 5pm (avoiding the evening peak of demand and price) means they arrive home after work to a nice warm house while avoiding peak prices. If their heating uses energy from solar PV, they are even better off.
Demand management is actually already here, it’s just creeping out slowly into more general use. I’m amazed that the study you write about didn’t consider it. Unless the US market is completely different to both Australia and Europe, that just seems like a stunning omission to me.
Stuart Allie,
You wrote: “once smart meters are installed and the suppliers start using them to bill people using tariffs that are higher during high demand periods, people will see this on their bills and act to reduce their usage at high cost times”.
The Canadian province of Ontario has been trying this for years. So far as I can tell, there has been no meaningful effect on peak demand. Is there evidence that these work in anything other than pilot studies?
On demand management, this is a relevant summary by the UKERC, Response from the UK Energy Research Centre (UKERC) to the House of Lords Science and Technology Committee Inquiry into the resilience of electricity infrastructure, September 2014:
More on demand management in a future article.
“You are almost surely wrong about biogas. The evidence is the fact that it is not widely employed.”
Sigh. That’s only true because non-renewable energy is currently cheaper. We’re talking about a non-fossil fuel scenario. In that case, biogas certainly is relatively cheap, as long as there is an existing source of ag waste. There are already biogas plants operating in Australia (and have been for years) in regions where ag waste is freely available.
Stuart Allie,
Earlier you said: “Biogas plants are cheap”. I made the perfectly reasonable assumption that you meant they are no more expensive than what we use now. Now you say you meant that they are cheaper than things that are even more expensive. Trivially true.
I doubt that biogas can be sufficiently plentiful to be more than a niche player. Perhaps you can provide evidence to the contrary.
Stuart wrote: “That’s only true because non-renewable energy is currently cheaper. We’re talking about a non-fossil fuel scenario.”
We are discussing the cost of a non-fossil fuel scenario – using real numbers. Those numbers ARE different for different locations*, but a sensible discussion requires real numbers. And we need to consider ALL of the costs. Raising electricity prices at times of peak demand can reduce that demand, but there is a cost associated with that reduction. Business don’t heat and air-condition their buildings for fun; they believe their investment in heating or cooling will be repaid via more productive workers and a more productive work environment and more customers. And societies that raise the cost of energy (especially enough to effect the demand side of an inelastic supply/demand curve) are simply reducing the standard of living – hopefully less than the negative externalities associated with energy production. It’s all about the numbers.
* The Swiss get all of their electricity from nuclear (baseload demand) and hydroelectric (variable demand). When the wind doesn’t blow, eastern Denmark gets all the hydroelectric power they need from Scandinavia. However, most of the world isn’t blessed with a large potential for producing power from hydroelectric plants.
Stuart Allie,
“I don’t know where their error is, but generating 3x more energy than the actual demand is nuts – there’s no way that’s correct.”
I wonder if you appreciate how little weight most people give to this kind of statement. Yes, experience in a field often does allow you to immediately see things which look suspect. But you still have to clearly show where the error is, and you seem unwilling (or unable?) to do that. You have offered nothing in your comments which shows a glaring error.
One other point: batteries have been around for a very long time; if batteries were not a mature technology, there would have been rapid progress in reducing cost per KWH over the past two decades; that doesn’t seem evident. Could there be improvements, or even a “breakthrough”? Sure, but that is a lot less than certain. Cost for battery storage (cost per KWH stored, including CAPEX) has remained stubbornly high for nearly a century. That is why everyone is not riding around in Teslas.
Stuart wrote: “I don’t know where their error is, but generating 3x more energy than the actual demand is nuts – there’s no way that’s correct.”
Actually, they propose nameplate capacity that is 10X average demand!
This scenario is nuts – if you assume that you can always import electric power from somewhere else when you need it. SOD discusses the high cost of importing power from a long distance away:
The authors of the study on the PJM grid didn’t consider the possibility of importing a significant amount of power for two reasons: The high cost of transmission lines and the likelihood that neighboring grids will be suffering from a shortage of renewable power at the same time. Weather systems that effect wind and solar extend a thousand miles and the deficits produced by calm and cloudy conditions can be nearly 100% of nameplate capacity.
Technology intended to reduce peak demand can’t address the problem caused by negligible production from wind farms on calm days and from solar farms at night and on cloudy winter days.
So the basic assumption behind the study is the same assumption that YOU would make if you went to live on an isolated island – either by yourself or with the 61 million people served by the PJM grid. You would plan to meet 100% of your current demand for power a reasonable fraction of the time using the cheapest renewable source of energy in the PJM area – wind. (99% reliability is is only 362/365 days.) Looking at historical data, you’d ask how long calm periods typically last and look for the cheapest way to store enough power to get through those periods. Average wind turbine output is about 30% of nameplate capacity, so you might choose to install turbines capable of meeting demand when their output is 10% of nameplate capacity. Batteries would be needed during the calmest periods. Given the high cost of batteries, this could easily be the CHEAPEST solution. This is precisely what Budaschak et al propose. However, they cheat on the price of those batteries by assuming they can expropriate the power in everyone’s electric vehicle batteries whenever there is a shortage of power by paying only 10% of the cost of those batteries.
Then they looked into the lowest cost system when paying the full cost of battery storage. In that case, they added some solar panels to the mix – to tap renewable energy available on calm sunny days. However, in the PJM area, solar costs 3X as much as inland wind. (You can have three 1 GW wind farms for the same price of one 1 GW solar farm.) Consequently, the use of solar is modest in the lowest cost scenario.
What about biomass or biofuels? With 61 million people on the crowded “PJM island”, is any form of bio-energy truly sustainable? In his book, David MacKay (an advocate of renewables) claims that the best energy crops outside the tropics produce about 0.3 W/m2 (net) – vs wind at 2 W/m2 and solar at 22 W/m2). Furthermore, the cost of maintaining the infrastructure OCCASIONALLY supply 50% of average demand via bio- or fossil fuel would be extremely high.
http://www.withouthotair.com/c6/page_43.shtml
Pumped hydro provides far cheaper backup than batteries, but MacKay doesn’t believe the terrain in Great Britain (somewhat like the Eastern US) can come close to meeting the need for storage. Perhaps Budaschak et al agree with this assessment.
http://www.withouthotair.com/c26/page_186.shtml
The situation may be different in locations with lower population density, better terrain for hydroelectric and pumped storage, or better sunlight.
On occasion, bad weather – massive snow storms, hurricanes and flooding -brings modern society to a screeching halt. The power goes out; sometimes for days. Road and rail transportation is limited or non-functional. Schools and businesses close. As best I can tell – barring a revolution in energy storage, the PJM area with 90+% renewables will be brought to brought to a similar halt about once a year by bad weather for renewable energy production, even with massive over-building. Less severe weather will produce modest period of blackouts and brownouts like those in California during its power crisis.
I came across some articles about Hawaii which brings up a lot of issues. Hawaii is interesting in that its go wind and its got solar, an its pretty much a closed system.
Anyways… its probably a good spot to focus on. Hawaii should be a Canary is in this coal mine.
http://www.greentechmedia.com/articles/read/the-rate-of-rooftop-solar-growth-in-hawaii-hangs-in-limbo
http://www.renewableenergyworld.com/articles/2014/02/the-interconnection-nightmare-in-hawaii-and-why-it-matters-to-the-u-s-residential-pv-industry.html
Robin Trow
“It would be interesting to see the analysis produced by Budischak et al (2013) repeated for the UK, where the energy consumption pattern is very different from that in NE USA.”
If you have not already check out “Sustainability without all the hot air” which attempts to do just that (free online). Including looking carefully at the demand vs time for electricity.
I have seen people criticize the author for being overly keen on nuclear, and not friendly to solar. But he clearly gave the matter a great deal of thought.
Rob: MacKay does not do an analysis like Budischak et al. MacKay focuses on technical feasibility, not cost. So there are no cost-optimized solutions in his book. Prosperous Brits can select whatever technically feasible combination of renewable technologies they prefer without worrying about the cost. (The environment is worth whatever it costs.).
In Capter 26, MacKay calculates that a reserve of 1200 GWh is needed for period of low wind. He discusses the feasibility of: pumped hydroelectric (too little suitable terrain, confiscating power stored in the batteries of electric vehicles, and numerous other options. Interestingly, he never asserts that a technically feasible solution with adequate scale actually exists.
Correction to above comment. Most of MacKay’s sample renewable energy plans call for a modest amount (ca 33%) of electricity from wind and include adequate reserve for calm periods. One scenario calls for 64% wind and struggles to meet the intermittency issue. It wasn’t fair to imply he did deal with the issue fairly. Budischak uses all or mostly wind in their cost optimized solution, creating a greater intermittency issue than any MaKay faces. And when MacKay creates his most economical plan, he relies on nuclear power for nearly half.
I like that terminology. It goes with net metering of roof top solar power is robbing the rest of the rate payers.
My brother-in-law has a Nissan Leaf. Needless to say, he doesn’t leave it plugged in when he isn’t using it. At present, charging an electric vehicle at home is probably the most expensive charging method. There are sufficient reduced price or free public charging stations for the current number of electric vehicles where he lives to keep that to a minimum.
I read David MacKay’s SEWTHA several years ago and have just had another look. As I thought MacKay deals with UK annual averages, so can only establish whether there is enough total energy available from various sources to match the total demand, It doesn’t investigate how well renewables will match demand on short (a few days) timescales. The book shows what won’t work but can’t really indicate what will – it also avoids dealing with costs in any detail.
The UK demand pattern will probably require a significant base load generating capacity to overcome those cold, dark, high demand, low wind periods that often occur in January and February. As MacKay says in his book he’s not pro nuclear but he is pro arithmetic and none of his suggested energy schemes work without significant nuclear or desert solar. With the change in the political landscape in North Africa and the Middle East since SEWTHA was first published, desert solar is now too difficult due to security issues.
As a final point, I do wonder why using EV batteries for storage is treated so pejoratively. Anyone with an EV will be able to indicate when they want their batteries used and when they want their vehicle to be ready for road use. They will be paid for any electricity they supply and the price will be set to cover the reduced battery life resulting from more frequent charge cycles. If you don’t want to provide power, you can always leave the EV unconnected until late in the evening when demand will probably be sufficiently low to allow charging.
Robin Trow,
“As a final point, I do wonder why using EV batteries for storage is treated so pejoratively.”
For my part, I see it as being hopelessly unrealistic.
“Anyone with an EV will be able to indicate when they want their batteries used and when they want their vehicle to be ready for road use.”
But that would default to “never” and “always”, unless you pay a ridiculous amount for the power bought back (say, $1/kWh or more). Otherwise, it just won’t be worth the trouble of not having one’s vehicle available when needed or of having to personally monitor the state of the grid. So the storage actually available to the grid will never be enough to matter.
Robin wrote: “I read David MacKay’s SEWTHA several years ago and have just had another look. As I thought MacKay deals with UK annual averages, so can only establish whether there is enough total energy available from various sources to match the total demand, It doesn’t investigate how well renewables will match demand on short (a few days) timescales.”
MacKay discusses the problem of matching demand on an hourly or daily time scale very casually – he doesn’t emphasize the challenge and certainly not the cost. MacKay’s Plan G uses the most wind power and he calls for a storage capacity capable of meeting demand for 2 days, similar to Budischak. The wood and waste-burning facilities in this scenario may also be able to provide dispatchable power.
http://www.withouthotair.com/c27/page_210.shtml
Robin also wrote: “I do wonder why using EV batteries for storage is treated so pejoratively.”
I lived through the gas shortages in the 1970’s in California. There were long lines at gas stations because everyone was filling up when their tank was still 3/4 full, fearing there might not be enough gas a few days later. The average tank was 3/4 full, rather than 1/2 full, making the shortage worse. The authorities tried telling people that their behavior was creating these long lines and making the crisis worse – to no avail.
Based on that experience, I presume that when the weather forecast calls for little wind, most citizens under Budischak’s plan will keep their car batteries topped off and their car disconnected from the grid. Wouldn’t you? Especially if the range of their EV were a limitation. The usual weather “fearcasting” (that attracts a larger viewing audience) will inflate the problem.
It wasn’t so much a shortage as the classic result of government imposed price controls. If a market price for gasoline had been established, there would have been no shortage and no lines. Gas station owners and refiners would have made a lot of money. Horrors! Couldn’t have that.
I didn’t see lines around the block during the recent unpleasantness when gas prices went to over $4/gallon. And the high price for crude did indeed lead to innovative ways to increase oil production. That was something the Peak Oilers said was not possible.
DeWitt: Does that mean that the price of electricity should rise as the wind weakens? (Or perhaps the price of usage above a certain minimum? The affluent are unlikely to reduce demand when the price goes up and the less affluent can’t afford to pay more.) Applying free market principles to a highly regulated market tends to cause problems, though the government rarely does a better job than the marketplace.
Frank,
Electricity isn’t gasoline. You can store large quantities of gasoline with high efficiency and relatively low cost. Electricity demand, as you say, isn’t as elastic as gasoline demand, which isn’t all that elastic either. What must happen when the wind weakens, absent magical new batteries, is brownouts and blackouts. Price signals only work when there are alternatives and time to use them.
I believe there are areas where the cost of electricity changes with demand during the day. I have no idea whether that has resulted in improved efficiency. My bet would be that any difference is small.
SOD et al: Budischak discusses how design a low-cost system from scratch that can produce 30%, 90% or 99.9% of variable electric demand from renewables. At first glance, it distant from our current problem: gradually replacing conventional generation with renewables and trying to figure out how much that really costs. We all realize that the leveled cost of generation isn’t the right price for renewable energy, but a valid method for calculating the real price hasn’t been discussed here. I think Budischak provides some of the answer.
The first year dispatchable power shrinks enough that it can no longer meet demand by itself, we have created a “gap in production” that society expects will be reliably filled by the renewable power that is replacing it Let’s call that gap “G”. Budischak tells us the cheapest way to provide ANY amount of power in the PJM region with 99.9% reliability – whether G is all of the 50 GW peak demand in the in the PJM region (or the 31 GW average demand), or the first GW required by retirement of dispatchable generation.
According to the paper, the PJM region has 72 GW of capacity and a peak demand of about 50 GW (Figure 4). Let’s supposed the EPA has forced 20 GW of coal generation to close and it has been replaced by wind. The remain 52 GW of generation capacity won’t be available 100% of the time. Let’s guess that 7 GW is the absolute minimum needed for reserve*. In that case, we are expecting wind to provide G = 5 GW of power any time it is needed. In order to obtain 5 GW from wind with 99.9% reliability, we need to have build roughly 50 GW of nameplate wind capacity and storage capacity equal to roughly 12 hours of consumption at 5 GW = 60 GWh.
A second way to estimate the cost of renewable power is to multiply the leveled cost of generation by the amount of power that is “spilled” because it can’t be used. That ranges from 170% of average renewable power used (hydrogen storage to 200% of renewable power used (central batteries) to 250% of renewable power used (GIV). This approach says the cost of renewable power must be roughly 3X the leveled cost of generation – before adding in the cost of storage. Both approaches give approximately the same cost. 3X the leveled cost of wind power plus the cost of storage.
Since wind power will be displacing conventional generation part of the time, it will be reducing the return on capital investment in wind. That also adds to the cost of renewable power. Roughly 30% of nameplate wind capacity will displace the demand for dispatchable power and the raise their fixed costs by 43% (reciprocal of 70% – 100%). (At the same time, wind will reduce the need for conventional reserve generation capacity most of the time, making it cheaper.)
In summary, until dispatchable generation can no longer meet 100% of demand, renewable power is relatively cheap: any difference in leveled cost between fossil fuels and renewables, the higher capital expense for displaced fossil fuel generation, and new transmission line. After a gap in production develops that must be filled reliably, renewable power becomes much more expensive: 3X the leveled cost of wind generation plus storage costs, plus the above costs.
Frank,
“According to the paper, the PJM region has 72 GW of capacity and a peak demand of about 50 GW (Figure 4)”
I doubt that Figure 4 shows the absolute peak demand; it shows a troublesome period, but that is more likely due to low wind than exceptionally high demand. I think utilities want a margin of about 15% of expected demand and that they don’t deliberately build excess capacity beyond that. So 72 GW capacity would imply peak demand somewhat in excess of 60 GW. Such high demand would happen only a few days a year; 50 GW might well be the peak on a typical summer day.
“In order to obtain 5 GW from wind with 99.9% reliability, we need to have build roughly 50 GW of nameplate wind capacity and storage capacity equal to roughly 12 hours of consumption at 5 GW = 60 GWh.”
How did you arrive at those numbers? In particular, the need for 12 hours of storage?
“3X the leveled cost of wind power plus the cost of storage.”
Sounds about right, given Budishak’s conclusion that wind must be overbuilt by a factor of 3.
“until dispatchable generation can no longer meet 100% of demand, renewable power is relatively cheap: any difference in leveled cost between fossil fuels and renewables, the higher capital expense for displaced fossil fuel generation, and new transmission line.”
I would say that you want the difference between levelized cost of renewables and operating cost of fossil fuel; plus the other factors. Renewables only slightly reduce the needed conventional capacity, so they only slightly reduce the capital cost of that capacity. But that capital cost is included in the levelized cost of conventional generation. I agree that the cost of renewables rises as penetration increases, but they are more expensive than conventional even at low penetration.
Mike M asked: “How did you arrive at those numbers? In particular, the need for 12 hours of storage?
In my illustration, I hypothesized an imaginary grid that was short 5 GW of needed dispatchable generation capacity (including reserve) and would be required to reliably obtain power from its renewable capacity. I came up with a composite picture for the reserve and overbuilding data found found in Table 8. Overbuilding = nameplate capacity used / average demand. Conventional dispatchable power is overbuilt by a factor of about 2X to meet peak demand and handle generation outages.
Table 8. 2008 costs. 99.9% renewable. GIV:
266 GW wind (8.5X), 0 solar, 382 GWh storage (9.5 h), spill 2.5X
Table 8. 2008 costs. 99.9% renewable. central batteries:
211 GW wind + 33 GW solar (7.7X), 435 GWh storage (11 h), spill 2X
Table 8. 2008 costs. 99.9% renewable. unrealistic hydrogen:
212 GW wind + 9 GW solar (7.1X), 2971 GWh storage (74 h), spill 1.7X
Reserve: The hydrogen storage isn’t realistically priced. The GIV storage was limited to the number of EVs and unrealistic. The central battery storage represented a realist MINIMUM and I rounded up to 12 h. The cheaper storage options may permit more storage to be built, but that doesn’t seem reduce the need of overbuilding renewable generation capacity.
Overbuilding: Except for the unrealistic hydrogen reserve, they are spilling 2X average consumption or more. They think wind will deliver an average output of 40% of nameplate capacity which is on the high side. I found a reference for solar capacity factor in this area – 15%. If you are spilling 2/3rds of what you generate and using only 1/3 and the average renewable output (including solar) were 30% of nameplate plate capacity, then nameplate capacity needs to be about 10X. Looking at the actual numbers in Table 8, they recommend a renewable nameplate capacity of about 8X average demand. That is based on equipment functioning without degradation 100% of the time and extremely high output from wind. 10X seems more reasonable.
http://www.solarpowerandwater.com/page3/page3.html
When a grid is counting on renewables to reduce CO2 emissions, but not reliably meet demand; renewable power seems relatively cheap, because it doesn’t need to be reliable. Budicshak’s 30% scenario for 2030 has 61 GW of fossil fuel capacity, probably enough to meet peak demand, and no storage (except GIV). However, as we retire dispatchable generation facilities and rely on renewables, then the essential contribution from renewable power must be designed (and should be priced) via a strategy like Budischak’s. The fact that we may not have the storage facilities and the overbuilding of nameplate capacity specified by Budischak for 99.9% reliability is irrelevant; the cost of unreliability is passed on to customers in the form of outages and incentives to reduce demand.
Strategy for calculating cost of renewable energy:
a) If the grid isn’t counting on any renewables to meet demand, then the renewable cost is:
1) the levelized cost of generation plus return on capital
2) plus the higher capital cost for existing dispatchable generation that is under-utilized.
3) minus the capital cost of the smaller reserve that may be needed because of the wind provides some reserve.
b) Whatever power (including reserve) you can’t count on getting from conventional generation needs to be available with 99.9% reliability from renewables following Budischak.
[…] « Renewables XIV – Minimized Cost of 99.9% Renewable Study […]
Here’s a study from Germany: “What will the energy transformation cost?” – looking at reducing GH emissions by 85% in 2030 or 2050: https://www.ise.fraunhofer.de/en/publications/veroeffentlichungen-pdf-dateien-en/studien-und-konzeptpapiere/study-what-will-the-energy-transformation-cost.pdf
I recently encountered some new data that challenged by previous biases (partly shaped by this blog) about the high cost of integrating solar power into an existing grid.
“[LA’s] municipal utility is readying a 25-year power purchase agreement for 400 MWac of solar power at 1.997¢/kWh along with 200 MW / 800 MWh of energy storage at 1.3¢/kWh.”
https://pv-magazine-usa.com/2019/06/28/los-angeles-seeks-record-setting-solar-power-price-under-2¢-kwh/
Elsewhere is says that the existing transmission line to LA is near capacity with the output from nearby solar farms and this new facility will store electricity during peak generation hours and transmit power during off-hours. These numbers seem grossly inconsistent with those I learned only a few years ago. However, the contract is with 8minuteenergy, the US’s largest operator of solar farms and bids with similar prices were submitted by others. What is going on?
The DoE reviews the cost of newly commissioned electricity generating plants and estimates what the levelized cost of electricity would be for a new facility coming online in a few years. 2019 and 2014 report numbers (per MWh) for power coming online in 2023 or 2019 are:
Fixed cost for CC-gas: $9.6 (2019). $16.0 (2014).
Variable cost for CC-gas: $32.3 (2019). $49.1 (2014).
Total cost for CC-gas: $41.9 (2019). $65.1 (2014)
Fixed cost for solar PV: $45.9 (2019). $125.9 (2014)
Lowest Fixed cost for solar PV: $40.3 (2019).
Variable cost for solar: $0 (2019 and 2014).
Levelized tax credit: -$11.5 (2019). -$11.1 (2014)
FWH calc.subsidized cost: $34.4 (2019). $29.8 (2019 lowest). $114.8 (2014).
The standard assumptions are an after-tax cost of capital of 4.2% (2019) or 6.5% (2014) and a 30-year cost recovery period. According to the DOE, the cost of solar power had dropped by a factor of 3 in the past five years, partly because of lower cost of capital, but mostly because of falling costs of solar panels and other equipment. Nevertheless, the DOE’s subsidized cost is still 50% more than 8minuteenergy and others appears willing to bid today. However, the 10-year T-bill rate has fallen nearly 1% (to 2%) in the past year and the prices of solar panels may have continued to fall, so a bid of $20/MWh could make sense if you believe the DOE’s numbers lag what is happening in the real world. With interest rates falling and technology improving modestly, the $20/MWh reported in the linked article doesn’t seem grossly out of line with these older numbers from the DOE.
Imagine building a new solar plant and a new gas plant solely to back up solar. (Using an existing gas plant for back up means a different fixed charge for gas backup in every calculation below.) According to the unsubsidized DOE numbers:
$45.9 for solar + $9.6 gas fixed = $56.5 (vs $41.9 for gas alone).
Based on the subsidized numbers reported for LA:
$20.0 for solar + $9.6 gas fixed = $29.6 (vs $41.9 for gas alone).
If you assume that half of the power generated had an extra charge for battery storage, the cost becomes:
$26.5 for solar/battery + $9.6 gas fixed = $36.1 (vs $41.9 for gas alone).
Based on the bid numbers reported above and adding in the DOE’s estimate of the subsidy:
$31.1 for solar + $9.6 gas fixed = $40.7 (vs $41.9 for gas alone).
California has a 30% tax credit for storage technology that increases the unsubsidized price 42% from $13 to $18.5:
$49.6 for solar/battery + $9.6 gas fixed = $59.2 (vs $41.9 for gas alone).
None of this data tells us what it would cost to get rid of the gas plant and its fixed costs, but the subsidized numbers show that LA is getting a great deal for solar and saving some money using the solar+battery combination. Without the subsidy, LA would be breaking even by replacing gas with solar. Adding the battery to smooth out generation and minimize use of gas adds significant cost.
As best I can tell, the economics of solar power have changed dramatically for those blessed with abundant sunlight.
Frank,
Imagine this was the power for the whole city. Peak power requirements are 200MW.
The storage is 800MWhr.
So there are 4 hours of storage at peak requirements.
Of course the demand may lower outside of peak requirements, so maybe you get 5 or 6 hours (depends on demand and supply surveys).
But really we need about 20 hours of storage. Just for one day. So worst case we need 4,000MWhr, or maybe it’s only 80% or 70% of that. Depends on the requirements through each day, through the year.
And now there are occasionally many days where it’s not sunny.
So maybe we need 16,000MWhr.
So in the first case the cost of storage is 6.5c, in the second case (days without solar) 26c. Compare with 2c for the production cost.
The solar production cost is a fraction of the storage cost, if you want to store across a whole day, and a small fraction if you want to store across half a week.
These are just indicative numbers without knowing the demand and supply curves, or the minimum solar across a week. Etc.
The problem isn’t solar electricity production costs, it’s storage. Solar production cost is a function of (probably) Moore’s law – it keeps declining at a rapid rate. Storage cost is a function of what we find in almost all other industries – it declines at a steady rate.
In another article I think I put in the cost of batteries to store UK electricity requirements for 2 days, based on the 2050 projections given by a consultancy trying to prepare the UK for its decarbonised future.
The cost was 10% of gdp, which in the UK is the cost of the entire National Health Service. If you want to survive the whole week it’s 25% of the gdp, more than half what the government takes in in tax revenue.
Without a revolution in storage, gas power is the only realistic backup.
I’m open to people explaining what’s wrong with this argument.
——
Note: the 4 hour storage may provide valuable grid service by smoothing out the demand requirements from other sources. So a gas plant can ramp up and down more slowly. For example.
That should have said 35% of gdp for storage for the whole week. So the entire tax base just about.
Solar is essentially a non-starter for winter generation in the UK.
The only realistic* assessment of a zero carbon future I’ve seen for the UK comes from the Centre for Alternative technology:
https://www.cat.org.uk/info-resources/zero-carbon-britain/
They advocate biogas storage as winter backup for low wind.
*they don’t like nuclear, so it doesn’t need to be quite so extreme. But at least they don’t rely on magical thinking.
verytallguy,
Of course. For the UK we’re talking about wind power. Same equation for storage costs applies.
SOD: When I looked for an appropriate place to post this information, I overlooked the possibility that readers might mistakenly assume I was talking about full-time 100% renewable power. As you correctly point out, vastly more storage is needed and the amount and cost of that storage can’t be determined from any information I have provided.
If I remember correctly, several commenters above expressed serious doubts about Budischak’s cost of central battery back up, something that could have changed dramatically. I hoped the current information about the cost of battery storage would be useful attached to this post. As I interpret the linked report, LA is being surcharged a subsidized 1.3 cents/kWh or unsubsidized 1.86 cents/kWh for power from the battery. Unfortunately, I’m not sure how to correctly convert Budischak’s costs into these units. It appears that the intention of the solar farm contracting with LA is to use batteries daily on sunny days to distribute peak generation around noon to other hours of the day. They could be anticipating many more charge/discharge cycles than Budischak.
My calculations all assumed that solar power required 100% backup by a natural gas plant. I imagined contracting in 2019 for both a solar farm and a gas plant of the same nameplate capacity. Therefore, I added $9.6/MWh (2019 estimate) in every calculation to pay the fixed cost of gas plant whenever solar made its output unnecessary. (On paper, older gas plants have an even higher fixed cost, since they were built when interest rates were higher, but that fixed cost would be paid even if there were no solar and 100% gas.) I expected the solar+gas combination to be more expensive than gas alone ($41.9/MWh for gas contract signed in 2019). However the cost of solar electricity is now cheaper than or equal to ($20/MWh subsidized, $31.1/MWh unsubsidized) the current cost of fuel for a gas plant ($32.2/MWh). (Technically, the DoE’s numbers are for the variable cost of a gas plant, not the “fuel” cost.) If you assign any cost to the negative externalities of CO2 (optionally after subtracting the negative externalities of solar), then unsubsidized solar+gas option would be superior to gas alone.
These calculation would apply to a solar+gas scenario as long as peak solar generation matches or only modestly exceeds peak demand. As soon as significant solar power at peak generation is wasted or turned off, the economics change. Systems that track the sun put out a large fraction of maximum output for a little less than 8 hours/day, so this might be a 30% renewable and 70% gas scenario now available to Southern California that doesn’t cost (unsubsidized) any more than 100% gas. It appears similar to Budischak’s 30% renewable scenario for the PJM region, which could be delivered by about 50 GW of inland wind with 2% wastage.
The solar+battery option (with gas backup) saves LA small amount with existing subsidies for both solar and battery, and costs nearly 50% more without subsidy than gas alone. Maybe this could be scaled up into a 40%-50% renewable scenario (short of the ultimate goal, but perhaps consistent with a 50% reduction by 2050.)
SoD: Unless there is an order of magnitude breakthrough in the cost of storage, I think you are correct when saying that solar is never going to provide 100% renewable power. Right now (as discussed above) about 30% solar renewable could be available with no added cost and that might be stretched to 40% or 50% with battery storage at a practical cost. Can we do better?
What if we constructed a system that provided 100% renewable power only on days that were sunny and relied on up to 100% gas for cloudy periods. The fixed cost of gas backup (ie capacity without fuel) is only $10/MWh. Palm Springs, a typical desert site near LA, has 270 sunny days a year, so this system could be 75% or better renewable. The figure below show California demand and solar generation:
https://en.wikipedia.org/wiki/Duck_curve
I’d estimate that demand could be met by solar alone for perhaps 8 hours a day and certainly more than 6 h. So for every MWh of solar output consumed in the middle of the day, you would need to store 2 or 3 additional MWh to get through the rest of the day, especially the peak in the late afternoon and early evening. Storing 2 MWh from every 3 MWh generated would add an additional unsubsidized $37/MWh to the $31/MWh unsubsidized cost of solar alone. If 3 of 4 MWh generated must be stored, that would add $55/MWh. Seems like a lot, until I remember that solar alone five years ago cost $126/MWh. This equipment will be of some used even on cloudy days, so let’s call this 80+% renewable. The batteries would also be useful with a mixture of wind and solar. So my take-home lesson is that trying for 100% renewable isn’t going to be worth the added cost, but 80% renewable is looking better.
If I were smarter, I would have paid more attention to Budischak’s 90% renewable scenario, which wasted about half of the wind power generated instead of the 99.9% scenario, which wasted 2/3rds of the wind power generated. We shouldn’t be thinking in terms of how much 100% renewable costs; we should be asking what percentage renewable is practical at what price point. Or put in other terms, let a “social cost of carbon” – not an arbitrary goal, especially 100% – dictate the percentage of renewal power used.
Frank,
Solar / wind plus gas powered backup is a realistic solution. Renewables work well some of the time, gas works all the time. Gas plants only use fossil fuels while running. Simple really. The cost is obviously higher than “renewables only”. But much lower than “renewables plus storage”. (Until we have the currently mythical low cost storage).
Your other point – instead of mandating X% renewable, figure out the cost curve (cost v %) – is spot on.
It’s chief flaw is it’s too sensible. It’s defeatist. Mandate the percentage and the technology will apppear. Or something.
SOD wrote: “Solar / wind plus gas powered backup is a realistic solution.”
However, without an in-depth analysis similar to that of Budischak, I can’t say anything quantitative about the cost of an optimal mixture of renewables. Hydroelectric is a very useful renewable in some locations, but complicated by drought and irrigation. (Budischak became out of date as soon as prices changed. I (and you?) now question the approach of targeting a set percentage of renewables rather than applying a SCC.) The best I could calculate was 100% solar on A sunny day storing power for other some or all of that same day and with natural gas back up for cloudy days. That could be up to about 80% renewable in sunny locations.
SOD continued: “Renewables work well some of the time, gas works all the time. Gas plants only use fossil fuels while running. Simple really. The cost is obviously higher than “renewables only”. But much lower than “renewables plus storage”. (Until we have the currently mythical low cost storage).”
Distinguishing between backup and storage is important (as I’m sure you know). Natural gas backup is available for the current fixed cost of $10/MWh, plus the cost of fuel as long as needed. Storage currently costs $18.5/MWh MULTIPLIED by the MAXIMUM number of hours storage must supply. That cost can increase dramatically (double, for example) if storage must supply circumstances that occur once a year or every few years.
SOD went on: “Your other point – instead of mandating X% renewable, figure out the cost curve (cost v %) – is spot on.
It’s chief flaw is it’s too sensible. It’s defeatist. Mandate the percentage and the technology will apppear. Or something.”
Governments like to mandate things. Mandating free lunches is exceptionally popular. Public opinion surveys asking people if they wish to received a free lunch invariably show that free lunches are enormously popular. If I understand correctly, cap and trade is a mandate; carbon tax is not. Nevertheless, both are considered equivalent ways of putting a price on carbon.
The most infamous government mandate may have been the Great Leap Forward, which apparently cost the lives of 20-60 million Chinese.
Frank,
Solar and wind power producers can afford to sell electricity for less than the cost of production by also selling Renewable Energy Certificates. One REC equals 1MWH of solar or wind generated electricity These can substantially increase the revenue of the renewable energy producer. Hence, the contract price for the electricity alone is not sufficient information to determine the actual cost, as states my require the purchase of REC’s.
See, for example here: http://www.b-e-f.org/learn/what-are-renewable-energy-certificates/
DeWitt: The link you provided appears to be privately funded. I’m skeptical that the largest owner of solar farms in the US supplying electricity to the second largest city is likely to receive a significant amount of funding from such sources. Only governments are likely to have the funds to significantly subsidize renewable energy on today’s expanding scale AND over the lifetime of a contract. Non-government organizations are more likely to respond to small, non-economic operations associated with “virtue signaling”. However, my skepticism doesn’t mean that you are wrong.
This picture from the PV magazine article reminds me that these solar farms in the desert are displacing agriculture, presumably made possible by irrigation.
8minutenergy – 328 MW-DC Mount Signal Solar Farm in Calexico, California
In my “100%-solar on sunny days” scenario (80+% renewable), midday demand in CA can be met with about 75 of these farms with another 150-225 farms storing power for other hours of the day.
A recent paper vastly extends some of the analysis done by Budishak to 42 different countries:
Geophysical constraints on the reliability of solar and wind power worldwide.
https://www.nature.com/articles/s41467-021-26355-z#ref-CR29
Abstract: If future net-zero emissions energy systems rely heavily on solar and wind resources, spatial and temporal mismatches between resource availability and electricity demand may challenge system reliability. Using 39 years of hourly reanalysis data (1980–2018), we analyze the ability of solar and wind resources to meet electricity demand in 42 countries, varying the hypothetical scale and mix of renewable generation as well as energy storage capacity. Assuming perfect transmission and annual generation equal to annual demand, but no energy storage, we find the most reliable renewable electricity systems are wind-heavy and satisfy countries’ electricity demand in 72–91% of hours (83–94% by adding 12 h of storage). Yet even in systems which meet >90% of demand, hundreds of hours of unmet demand may occur annually. Our analysis helps quantify the power, energy, and utilization rates of additional energy storage, demand management, or curtailment, as well as the benefits of regional aggregation.
One big difference compared with Budichak is that this paper makes no attempt to deal with cost.
A second difference is that the analysis “assumes perfect” transmission, an absurd and credibility-damaging assumption for countries the size of the United States. However, this assumption may be appropriate for smaller countries like France, Germany and the UK, where the high cost of distant transmission within country and be compensated for some transmission across borders. The assumption of perfect transmission UNREALISTICALLY allows all large countries to meet a greater fraction of demand with wind and solar.
A third difference is that generation infrastructure is not “designed” to reliably meet demand for a specified fraction of the time (say 99.7%, all but one day a year, or 99.9% of the time). That is why the abstract reports meeting demand for as little as 72% (failing 102 days a year) and as much as 94% of the time (failing only 22 days) – both of which instinctively sound totally unacceptable. Instead, the analysis (in Figure 4) shows the size of the gaps in power supply on plots showing both the gap in hours/year on one axis and as a percentage of total demand on the other axis. They consider generation infrastructure with an optimal mix of wind and solar) which matches average demand (1X) or is overbuilt by a factor of 1.5X or 3X with or without 3 hours or 12 hours of storage. Wind dominates the optimal in most countries. Figure 4 IS WHAT MAKES THIS PAPER WORTH READING. Budishak never told us anything about what fraction of demand wouldn’t be met and modest shortfalls can easily be handled with demand reduction strategies.
In Germany, for example, optimal 1X generation capacity from wind and solar produces gaps of about 90% of demand for about 100 hours/year and 70% for at least 1000 hour/year. This situation isn’t improved dramatically by 1.5X generation capacity with or without energy storage. With 3X generation, [intolerable?] gaps of 50% of demand exist for about 100 hours/year without energy storage, but only about 20 hours with 12 h of energy storage. This gap is only 20% of demand, and presumably could be easily handled by demand reduction. Germany isuffers form “Dunkelflaute” (dark doldrums) in winter that reduced renewable generation to near zero for 2 weeks in 2006.
Similar trends exist in other medium-sized countries, although countries at lower latitudes benefit modestly from increasing solar and adding storage compared with Germany. Larger countries like Brazil and Mexico benefit unfairly from the assumption of perfect transmission and are predicted to meet demand much better with 1.5X capacity with energy storage or 3X capacity without storage. The assumption of perfect transmission in the largest countries means 3X generation capacity is never needed. In the US, 1X generation capacity fails to meet 50% of demand for an unacceptable 100 hours per year and 40% of demand for 1000 hours, a situation that is worsened by adding storage. However, 1.5X generation capacity with 12 hours of storage meets 80% of demand all the time.
IMO, the take-home lesson is that Budishak’s demonstration that renewable generation capacity of 3X average demand can produce a reliable supply of electricity may be generally applicable.
Thanks Frank, looks like an interesting paper. I will have a read.
The Tong et al 2021 paper assuming perfect transmission I discussed above asserted its results for the US were supported by another major study: Princeton’s Net-Zero America project. This report outlines 5 pathways to net-zero emissions by 2050, including one (the E+ RE+ option) that relies almost completely on renewable energy. Surprisingly, one of the options (the E+ RE- option) the authors surreptitiously relies on a major increase in nuclear power to provide about half of electricity. This report adds more information to Tong (2021).
Click to access Princeton%20NZA%20FINAL%20REPORT%20SUMMARY%20(29Oct2021).pdf
Land use: The E+ RE+ option requires that 1 million km^2 of land be devotes to producing wind and solar power (the combined size of Arkansas, Iowa, Kansas, Missouri, Nebraska and Oklahoma). The E+ RE- option only requires one-fourth as much land (Illinois plus Indiana). A third option that includes a modest contribution from biomass (less than 10%) devotes 0.25 million acres to energy crops. The land required for future with large amounts of renewable energy is enormous.
Transmission capacity: The E+ RE+ option requires a 5-fold increase in electricity transmission capacity to get highly variable output from wind and solar farms from where it is generated to relatively nearby customers. Since the E+ RE+ option projects 4X more generation capacity than we have at present, it probably is building a generating capacity about 3X average demand to ensure reliability and not the nationwide “perfect transmission” assumed in Tong (2021).
The E+ RE- option assumes 250 new 1 GW reactors or the equivalent in smaller modular reactors.
I could, but won’t, editorialize about what this report says about the practicality of such dramatic mitigation of carbon dioxide emissions and the value of such top-down planning.
Frank,
So let me editorialize. The same people who obstruct nuclear power plant construction will never allow something that drastic to actually be built. And that’s neglecting the cost. Having to overbuild capacity by a factor of three absolutely contradicts the claims that wind and solar are cheaper than even natural gas. And that doesn’t include the cost of the massive increase in transmission lines required to achieve anything close to ‘perfect transmission’. Twelve hours of storage is also a whole lot of batteries, which aren’t free either.
It’s a very informative paper. I like this graph:
The first thing to notice is very large countries – like Australia, US, Canada – have much better results. That’s because a large country is more likely to have sunshine or wind, at least somewhere, than a small country.
Comparing Germany and Australia, for example, we can see that with 1.5x overbuilding and 3 hours of storage Australia has just a few hours of 50% shortfall in electricity supply. Germany has something like 500 hours of 50% shortfall.
However, the cost of creating “perfect transmission lines” skyrockets in a larger country, so it isn’t necessarily even close to an optimum solution.
The second thing to notice is they’ve paid attention to the problem of storage (unlike media reports and politicians) – how expensive it is, and how little is actually available even if you want to spend vast sums of money.
For Australia, buying 3hrs of storage would cost something like US$50bn at 2020 battery prices (note 1). That’s US$5,000 per household. So it’s definitely noticeable by the voters.
Buying 12hrs of storage would cost something like US$20,000 per household. There might be something of a electoral issue. But there’s no one to give that approx US$380bn order to. Perhaps Telsa will give up its car business and just make batteries for Australia for 8 years or so. Unlikely.
Clearly even a few hours of storage for large countries requires a huge increase in global storage production.
Note 1 – Using the prices paid by Neoen to expand “the world’s biggest battery” in South Australia in 2020.
The third item is how challenging an optimization problem this is.
If we consider the minimum cost to achieve say 90% & 99 electricity production by wind/solar then we have to include:
1. Cost of building redundant transmission lines
2. Cost of storage
Then I think we’ll find that the cost to go from 90% to 99% is incredible high.
Anyone looking at the numbers who has to explain to the people who will actually be paying for it will find it challenging.
A couple of questions will jump out even for people really keen on the idea:
1. Why is net zero being considered? Why not net 10?
2. Why don’t we spend a tiny fraction of this money reducing the same amount of emissions (from 90% to 99%) somewhere else?
Anyway, it will be fascinating to see someone actually put some realistic budgets together. I’m not holding my breath.
“Anyway, it will be fascinating to see someone actually put some realistic budgets together. I’m not holding my breath.”
Nor am I. Green and realistic seem to be mutually exclusive.
There was a commenter at the Wall Street Journal online who said that all we need is will to rapidly replace ICE with electric vehicles. That, IMO, is the definition of magical thinking as in fiction will is essential to work magic.
SOD wrote: “A couple of questions will jump out even for people really keen on the idea:
1. Why is net zero being considered? Why not net 10?
2. Why don’t we spend a tiny fraction of this money reducing the same amount of emissions (from 90% to 99%) somewhere else?
According to the forward to the report written by John Holdren finessed your questions this way:
Most of the global community of nations has long embraced a target of limiting the global average surface temperature increase to 2°C (3.6°F) above the “pre-industrial” average. (That average was about the same as the value in the period 1880-1900.) It is clear that this figure would entail climatic disruption and impacts considerably greater than those currently being experienced at just half of that increase. The 2°C figure was agreed not because it would be “safe”, but because multiple analyses had indicated that doing much better would be extremely difficult technologically and economically. (Another factor was the view of some that “tipping points” plunging the world into drastically different climate regimes were more likely above 2°C than below; in reality, though, the same argument holds for any other choice of target.) As part of the 2015 Paris Agreement of the Conference of the Parties to the UN Framework Convention on Climate Change, the 2°C target was again officially embraced, but a more ambitious, aspirational target of 1.5°C was added in response to arguments that the LIKELY IMPACTS OF 2°C, which science has been bringing into clearer focus, WOULD BE INTOLERABLE. In the view of most analysts familiar with the technological and economic challenges of very rapid emission reductions, along with the limitations and uncertainties of natural and technological CO2-removal methods and solar-radiation management, holding the temperature increase to 1.5°C target is very unlikely to be achievable. A large part of the analytical effort on pathways to deep emissions reduction continues to be focused, therefore, on investigating how reductions consistent with a 2.0°C target might be achieved. In any case, though, it is much more important now to focus on what strategies for technological innovation and what policies will move the world more rapidly onto a deep-reductions trajectory than to try to agree on exactly what ultimate temperature limit the world will be able to stay below.”
“… IT HAS BEEN CLEAR FOR TWO DECADES OR MORE THAT, FOR THE INDUSTRIALIZED COUNTRIES TO DO SOMETHING APPROACHING A “RESPONSIBLE SHARE OF A GLOBAL EFFORT TO LIMIT THE AVERAGE SURFACE TEMPERATURE INCREASE TO 2.0°C, THEY WOULD NEED TO REDUCE THEIR EMISSIONS OF HEAT-TRAPPING GASES BY 80-100% BY AROUND 2050. Each year that has passed without countries taking steps of the magnitude needed to move expeditiously onto a trajectory capable of achieving such a goal has increased the challenge that still lies ahead.”
“…At the same time, observations of actual harm from climate change and a continuing flow of bad news from climate science about likely future impacts has increased the sense of urgency in the knowledgeable community, while continuing advances in energy technology have engendered a degree of optimism about what emission reductions might be possible and affordable. The result has been an increasing flow of (mostly) increasingly sophisticated modeling studies of how emissions of CO2 and other heat-trapping gases might be reduced to near zero by 2050.”
So the answer to SOD’s question is that John Holdren and his pals have personally decided that the likely impacts of an additional 1 degC of warming will be intolerable. And they have chosen to create a plan for Net-Zero emissions by 2050 and obtained funding to create it. To convince the public, they have been hyping the role of rising GHGs in making some extreme weather events slightly more extreme.
Under the Paris Accords, the EU committed to a 40% reduction compared with 1990 by 2030. China pledged to peak by 2030. The Obama administration committed to achieve a 50-52% reduction relative to 2050 in economy-wide NET greenhouse gas “pollution” in 2030. If IIRC, this was the goal of the Obama EPA’s Clean Power Plan under the authority allegedly granted by Congress in the Clean Air Act that regulates traditional air pollutants. However, the Supreme Court just ruled that Congress needed to have been much more explicit when granting the EPA the authority to regulate CO2 and other GHGs rather than traditional pollutants: A 2 degC target? Cost benefit analysis? X% reduction by 2050? What emitters? When the dangers of CFCs were recognized in the 1980s, Congress amended the Clean Air Act to authorize the EPA to regulate ozone destroying substances. At the moment, there is no legal authority in the US to target any reduction in CO2 emissions, which is sensible since Congress hasn’t spoken on this issue.
What is missing from Holdren’s justification is any mention of cost, or better the cost difference between 100% reduction and 90% (or less) reduction and the difference in benefits to be obtained from such reductions. The absence of this information is exactly why studies like this one should have a “red team” to question the basic assumptions about appropriate goals, costs and benefits.
If you are interested in this subject, there is a summary of costs on p13 of the report with an interesting or fanciful Figure showing how the cost of our “energy system as a percentage of GDP has fallen since the oil shocks of the 1970’s (8-14% of GDP, leading to a horrible economy) and the $100/barrel 2000’s (8-10% of GDP) to under 5% of GDP in 2020 and about 3.5% of GDP in 2050 under business as usual. Their 5 options keep the cost of our energy system constant (the high-nuclear E+ RE- option) or raise it by up to 1.5% of GDP (the E+ RE+ option with almost all renewables). The post-pandemic oil crisis has changed today’s costs, but perhaps not the business-as-usual cost for 2050. If you want to post this Figure, someone might look into the report and comment on how they came up with their numbers. DeWitt noted that if renewables are “cost competitive” today, the cost of the E+ RE+ option should be at least 3X higher – before adding the cost of 5X transmission capacity and storage (if they included any). As you can see on p31, they are planning for an installed capacity SIX times larger than today, and four times larger than business as usual. However, their cost for our current system includes a high cost for air pollution (as did Budischak). And they apply a “Societal NPV” for costs of only 2% – despite the fact that our energy system is provided by private companies that charge their customers a much higher cost for capital.