Feeds:
Posts
Comments

Archive for November, 2010

..Nick Stokes with the Moyhu blog.

I received this award some time ago from Skeptical Science, and passing it on is long overdue.

The idea is the award gets passed on from blog to blog, to those whom they deem a ‘thinking blog’

Nick has frequently commented on Science of Doom and always makes a great contribution. His own blog has excellent articles that are technically very strong.

When you read his blog you wouldn’t even know about the great war between the two opposing sides – truth and righteousness vs the evil ones.

You just get a clear explanation of a subject like entropy or condensation and expansion.

I recommend visiting Nick’s blog if you are interested in understanding more about climate science.

Read Full Post »

When I wrote Do Trenberth and Kiehl understand the First Law of Thermodynamics? I imagined that (almost) no one would have a problem with the model created. Instead, I thought perhaps some might question its relevance to climate.

It was a deliberate choice to use conduction to demonstrate the point – the reason is that radiation is less familiar to most people, while conduction is more straightforward and easier to understand.

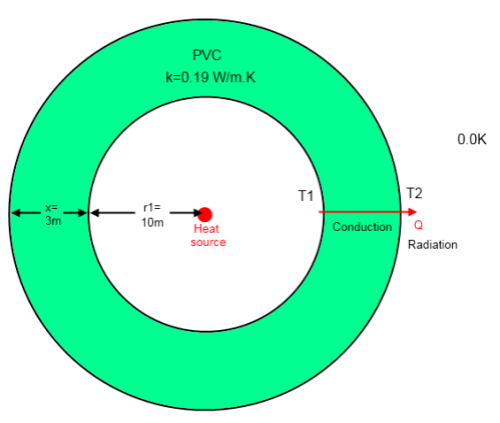
Here is the model from that article – a heat source in a hollow PVC sphere, located in the depths of space:

Many people have experienced a lagged hot water pipe. The more lagging (insulation), the higher the temperature rises. It seems straightforward.

However, the conceptual barrier that some people have is so large that anything – literally – will be put forward to make the model fit their conceptual idea. In case the case of one blog, claiming that energy can be destroyed in an effort to get the “right” result. A delicious irony that the first law of thermodynamics is cast aside to protect.. the first law of thermodynamics.

The reason this PVC sphere model appears so wrong to many people is for similar reasons that the famous Kiehl & Trenberth diagram seems wrong – the radiation “internally” (earth surface) is higher than the external radiation to space. (Note that the radiation values in the K&T diagram can be measured).

Explaining How the Result is Calculated

..in simple terms.

Solving the maths for the model above is straightforward (refer to the first article for the actual maths). Here is the solution in simple terms:

For the steady state condition the energy radiated from the outer surface must equal the energy source in the center (30,000 W). Otherwise the system will keep accumulating energy.

Given the surface area and the stated emissivity the outer surface temperature (T2) must be 133K (to radiate 30,000 W).

The only way that heat can be transferred from the inner surface to the outer surface is through conduction. This means 30,000 W is conducted through the PVC.

Given the (low) thermal conductivity of PVC and the dimensions, the temperature difference must be 290K, making T1 = 423K.

If the temperature differential is any lower then less than 30,000W will be conducted through the wall. And if that was the case then heat would be accumulated at the inner surface – increasing its temperature until eventually 30,000W did flow through.

Conversely, if the temperature was higher than 423K then more than 30,000W would be conducted through the sphere. This would start to reduce the temperature until only 30,000W was conducted.

Simple really. However, when the result doesn’t seem right, people begin their mental gyrations to get the “right” result.

This article is not written to convince people who have their minds made up. It’s written to help those who are asking the legitimate question:

Haven’t you just created energy? And can’t I use that to run a small power station?

Good question.

This article is not about proving what has already been demonstrated, it’s about helping with mental models.

The equations of heat transfer have already been clearly explained in Part One. So far, the arguments against that have been put forward consist of:

  • the argument from incredulity
  • 3m of PVC can transmit radiation straight through (no it can’t)
  • energy disappears under the right circumstances (that was just the first of many flaws in that person’s argument..)

Of course, if someone comes up with yet another alternative calculation of the heat transfer I will be happy to look at it.

In the meantime, let’s create a mental model..

The Power Station

A few people have jubilantly claimed that the model I created, if correct, can run a power station of 1.8 MW, from a source of only 30,000 W.

That’s what it might seem like on the surface. But strangely, the model results were derived by conserving energy. That is, no energy was created or destroyed..

In the steady state condition:

  • 30,000 W is produced from the internal source
  • 30,000 W is conducted through the PVC “wall”
  • 30,000 W is radiated from the outer surface

Energy is not being created or destroyed. Where is the energy accumulation in this model? Where is the usable energy being stockpiled?

  • If you want to understand the subject, this point is the one to focus on and think about
  • If you don’t want to understand the subject say “he’s created 1.8 MW of energy from 30,000W – ridiculous”, and move on (it sounds good)

The inner surface of the sphere has an area of 1,257 m² (4πr²). Consider one square meter of internal surface, we’ll call it “A” – these kind of models always have catchy names for different components of the model.

  • Each second, A receives 23.9 W/m² from the internal heat source (30,000W / 1,257 m²).
  • Each second, A conducts 23.9 W/m² through the wall.
  • Each second, A absorbs 1,452 W/m² radiated from the rest of the inner wall.
  • Each second, A re-radiates 1,452 W/m².

This is another way of saying that no energy is being created or destroyed. Where is the energy to run this power station?

All that happens if we start drawing power out of this system is the temperature internally reduces very quickly.

How Does the Sphere Heat Up?

In my efforts to understand the conceptual problems people have, I believe that this might help. I can’t be certain – this article is about mental models.

Let’s picture the scene when the PVC sphere is “started up”.

Outside it is 0K. Inside it is 0K. Chilly. Very chilly.

Now the 30,000 W heat source is fired up. 30,000 J every second gets radiated out from this source. Every second, 80% of this 30,000 J gets absorbed by the inner surface (with 20% reflected).

At this stage almost no energy is conducted through the PVC sphere. It can’t – because the temperature differential is not nearly high enough. Conduction requires a heat differential. So instead, the energy goes into heating up the inner surface of the sphere.

As the inner surface heats up it begins to conduct heat through to the outer surface – but most of the energy still goes into heating the inner surface.

A necessary consequence of the inner surface being heated up is that it radiates. All of this radiation is absorbed by the rest of the inner surface AND THEN re-radiated. Energy is not being created. This energy can’t be “tapped off” to do anything useful.

A small supply of energy is simply being “bounced around” (not really “bounced” but it might be a useful way to think about it)

This energy is simply the energy that has been accumulated by the inner surface during the initial heating process. It keeps being accumulated until finally the temperature is high enough to conduct the full 30,000 W through to the outer surface.

Now we have reached equilibrium! On our journey to equilibrium, while the inner surface was heating up, it accumulated heat, and this accumulated heat is now radiated, absorbed, re-radiated, absorbed…

You can connect it to a power station and very quickly you will draw down this accumulation of energy. The maximum you can draw out long term will be 30,000 W.

Conclusion

This article is all about mental models – explaining why the actual results for this model don’t violate the First Law of Thermodynamics. The results were calculated from the very simple and standard heat transfer equations.

Analysis of this model, with the results that I have presented (in part one), demonstrates that energy is conserved.

At first glance it might not seem like it to many people – because the inner surface radiation is so high. But the energy is just re-radiated from the energy absorbed. It’s like a small stockpile of energy that is being “bounced around” from wall to wall.

There is only one (legitimate) way to solve the heat transfer equations for this model. Other approaches invent /destroy physics in an attempt to get a low enough value for the radiation emitted from the inner wall.

Read Full Post »

I while ago I wrote an article – Do Trenberth and Kiehl understand the First Law of Thermodynamics?

It could have been very short. “Yes”.

However, I did produce an extremely basic model to demonstrate that simple systems with heating “from within” can lead to outcomes that – for many people – are unexpected.

A huge admirer of this blog has written an embarrassingly pro-Science of Doom post entitled:

Why ‘Science of Doom’ Doesn’t Understand the 1st Law of Thermodynamics

So I thought I would return the favor by sending readers to take a look. At the very least, the blog writer will have the comfort of a small lift in visits as well as the welcome opportunity to explain their unique point of view. I just hope that my readers realize that their gushing praise for this blog does not involve any payments whatsoever.

And with apologies to the mysterious Dr. Philips who has had no part (ever) in the writing of this blog.

And on a less important note, if anyone is wondering how a PVC hollow sphere, heated from the inside and sitting in space has anything to do with the planet Earth – I can only hang my head in shame as it clearly has nothing whatsoever to do with our amazing planet.

A PVC sphere is nothing like the earth. The atmosphere is not made out of PVC. Conduction is not an important mechanism in climate physics. What was I thinking?

In any case, I fully expect the author of the laudatory blog article to change the title to something like “Why ‘Science of Doom’ Doesn’t Understand that the Atmosphere Isn’t Made out of PVC”.

And on a small technical note, let’s hope that the article writer fixes up the tiny technical mistakes in their article. If PVC can’t “transmit” radiation then conduction will be required, and.. ouch..

Read Full Post »

With apologies to my many patient readers who want to cover more challenging subjects.

Many people trying to understand climate science have a conceptual problem.

I have written (too) many articles about the second law of thermodynamics – the real and the imaginary version. Resulting comments on this blog and elsewhere about those articles frequently contain comments of this form:

So if we take bucket A full of water at 80°C and bucket B full of water at 10°C, Science of Doom is saying that bucket A will heat up because of bucket B? Right! That’s ridiculous and climate science is absurd!

Yes, if anyone was saying that it would be ridiculous. I agree. To take one example from many, in The Real Second Law of Thermodynamics I said:

Put a hold and cold body together and they tend to come to the same temperature, not move apart in temperature.

Of course, it could be that I am inconsistent in my application of this principle.

One observation on the many contrary claims resulting from my articles – not a single person has provided a mathematical summary to demonstrate that the examples provided contradict the first or second law of thermodynamics.

It should be so easy to do – after all if one of the many systems I have outlined contravenes one of these laws, surely someone can write down the equations for energy conservation (1st law of thermodynamics) or for change in entropy (2nd law of thermodynamics) and prove me wrong. We aren’t talking complex maths here with double integrals or partial differentiation. Just equations of the form a + b = 0.

And here’s the reason why – the problem that people have is conceptual. It seems wrong so they keep explaining why it seems wrong.

Conceptual problems are the hardest to get around. At least, that’s what I have always found. Until a subject “clicks”, all the mathematical proof in the world is just a jumble of letters.

So with that introduction, I offer a conceptual model to help those many people who don’t understand how a cold atmosphere can lead to a warmer surface than would occur without the cold atmosphere.

And if you are one of those people in the “firmly convinced” camp, let me suggest this reason for making the effort to understand this conceptual model. If you understand why others are wrong you can help explain it to them. But if you just don’t understand the argument of people on “the other side” you can’t offer them any useful assistance.

Model 2 – Two bodies – The Boring One that Everyone Really Does Agree With

Very quickly, to “warm everyone up”, and to once again state the basics – if we have two bodies in a closed system, and body A is at temperature 80°C and body B is at 10°C, then over a period of time both will end up at the same temperature somewhere between 10°C and 80°C. It is impossible, for example, for body A to end up at 100°C and body B at 0°C.

Everyone is in agreement on this point.

Note that the “period of time” might be anything between seconds and many times the age of the universe – dependent upon the circumstances of the two bodies.

Model 3A – Three Bodies with the Third Body Being Quite Cold

Where’s Body 1? This picture is the view from Body 1, also known as “Chilly Earth”, which is a spherical solid planet.

To make the problem much easier to solve we will state that the heat capacities of Body 2 and Body 3 are extremely high. This means that whether they gain or lose energy, their temperature will stay almost exactly the same. Body 1, “Chilly Earth”, has a much lower heat capacity and will therefore adjust quickly to a temperature which balances the absorption and emission of radiation.

“Chilly Earth” doesn’t have an atmosphere.

However, for the purposes of helping the conceptual model, “Chilly Earth” reflects 30% of shortwave radiation from the Sun but at longer wavelengths absorbs 100% (reflects 0%). This means its emissivity at longwave is also 100%.

“Chilly Earth” has a very high conductivity for heat, and therefore the whole planet is at the same surface temperature. (See note 1).

“Sun” is 150M km away from “Chilly Earth”, and “Chilly Earth” has a radius of 1,000 km (a little different from the planet we call home).

Let’s calculate the approximate equilibrium temperature of “Chilly Earth”, T1

How do we do this? By calculating the energy absorbed from Body 2 and from Body 3, and calculating the temperature of a surface that will radiate that same energy back out.

The method is simple – see below.

Energy Absorbed from Body 2, “Sun”

Radiation from “Sun” at 5780K = 6.3 x 10⁷ W/m² – near the surface of the sun. By the time the sun’s radiation reaches earth, because of the inverse square law (the radiation has “spread out”), it is reduced to 1,369 W/m². Remember that 30% is reflected, so the absorbed radiation = 958 W/m².

The surface area that “captures” this radiation = πr² = 3.14 x 10⁶ m².

Energy absorbed from body 2, Er2 = 958 x 3.14 x 106 = 3.01 x 10⁹ W.

Energy Absorbed from Body 3, “Space”

Radiation from “Space” at 3K = 4.59 x 10⁻⁶ W/m². Apart from the very tiny angle in the sky for “Sun”, the entire rest of the sky is radiating towards the earth from all directions in the sky.

The surface area that “captures” this radiation = 4πr² = 1.26 x 10⁷ m².

Energy absorbed from body 3, Er3 = 4.59 x 10-6 x 1.26 x 107 = 57.7W.

So energy from body 3 can be neglected which is not really surprising.

Energy Radiated from Body 1, “Chilly Earth”

For thermal equilibrium (energy in = energy out), “Chilly Earth” must radiate out 3.01 x 10⁹ W, from its entire surface area of 1.26 x 10⁷ m².

This equates to 239 W/m², which for a body with an emissivity of 1 (a blackbody) means T1 = -18°C.

So we have calculated the equilibrium temperature of “Chilly Earth”.

Now, if we change the model conditions – the reflected portion of solar radiation, the emissivity of the earth at longwave, or the conductivity of the planet’s surface – any of these factors would affect the result. They wouldn’t invalidate the analysis, they would simply lead to a different number, one that was slightly more difficult to work out.

But hopefully everyone can agree that with these conditions there is nothing wrong with the method. (I realize that a few people will not agree..)

Model 3B – Three Bodies with the Third Body Being Somewhat Warmer

So now we are going to perform the same analysis with our new Body 1, “Warmer Earth” (a wild stab at an appropriate name).

The only thing that has really changed about the environment is that Body 3, “Crazy Background Radiation”, is now at 250K instead of 3K.

Note that the temperature of Body 3 is higher than before but lower than the equilibrium temperature of 255K calculated for “Chilly Earth” in the last model. As before, body 3 has an emissivity of 1 for longer wavelengths.

Body 1, “Warmer Earth”, still reflects 30% of solar radiation and is the same in every way as “Chilly Earth”.

What are we going to find?

We will do the same analysis as last time. Repeated in full to help those unfamiliar with this kind of problem.

Energy Absorbed from Body 2, “Sun”

Radiation from “Sun” at 5780K = 6.3 x 10⁷ W/m² – near the surface of the sun. By the time the sun’s radiation reaches earth, because of the inverse square law (the radiation has “spread out”), it is reduced to 1,369 W/m². Remember that 30% is reflected, so the absorbed radiation = 958 W/m².

The surface area that “captures” this radiation = πr² = 3.14 x 10⁶ m².

Energy absorbed from body 2, Er2 = 958 x 3.14 x 106 = 3.01 x 10⁹ W.

Energy Absorbed from Body 3, “Crazy Background Radiation”

Radiation from “Crazy Background Radiation” at 250K = 221 W/m². Apart from the very tiny angle in the sky for “Sun”, the entire rest of the sky is radiating towards the earth from all directions in the sky.

The surface area that “captures” this radiation = 4πr² = 1.26 x 10⁷ m². (See note 2).

Energy absorbed from body 3, Er3 = 221 x 1.26 x 107 = 2.78 x 10⁹ W.

In this case, energy from body 3 is comparable with body 2.

Energy Radiated from Body 1, “Warmer Earth”

Body 1 absorbs Etot= Er2 + Er3 = 5.79 x 10⁹ W

For thermal equilibrium (energy in = energy out). “Warmer Earth” must radiate out 5.79 x 10⁹ W, from its entire surface area of 1.26 x 10⁷ m².

This equates to 460 W/m², which for a body with an emissivity of 1 (a blackbody) means T1 = +27°C.

Discussion

Our two cases have revealed something very interesting.

A very very cold sky led to a surface temperature on our slightly different earth of -18°C, while a cold sky (colder than the original experiment’s planetary surface temperature) led to a surface temperature of 27°C.

Well, and here’s the thing, strictly speaking the temperature is actually caused primarily by the bright object in the middle of the picture, “Sun”. The energy absorbed from the sky just changes the outcome a little.

In both cases we calculated the equilibrium temperature by using the first law of thermodynamics (energy in = energy out).

If we do the calculation of entropy change we will find something interesting.. but first, let’s consider the conceptual model and what exactly is going on.

It’s very simple.

In a 3-body problem the temperature of the coldest body still has an effect on the equilibrium temperature of the body being heated by a hotter body.

I could make it more catchy, more media-friendly, but that would go against everything I stand for. I will call this Doom’s Law.

Entropy

The second law of thermodynamics says that entropy can’t reduce. The many cries of anguish that will now arise will claim that Model 3B has broken the Second Law of Thermodynamics. But it hasn’t.

See The Real Second Law of Thermodynamics for more on how to do this calculation. And even clearer, the article by Nick Stokes:

Change in entropy, δS = δQ / T

where δQ = change in energy, T = temperature

We will consider both models over 1 second.

Model 3A

Body 2, “Sun”, δS2 = -3.85 x 1026 / 5780 = -6.66 x 10²² J/K

Body 3, “Space”, δS3 = 3.85 x 1026 / 3 = +1.28 x 1026 J/K

And finally, Body 1, “Chilly Earth”, δS1 = 0 / 255 = 0 J/K

Total Entropy Change = δS1 + δS2 + δS3 = +1.28 x 1026 J/K  :a net increase in entropy.

Model 3B

Body 2, “Sun”, δS2 = -3.85 x 1026 / 5780 = -6.66 x 10²² J/K

Body 3, “Crazy Background Radiation”, δS3 = 3.85 x 1026 / 250 = +1.54 x 1024 J/K

And finally, Body 1, “Warmer Earth”, δS1 = 0 / 255 = 0 J/K

Total Entropy Change = δS1 + δS2 + δS3 = +1.47 x 1024 J/K   :a net increase in entropy.

Important points to note about the entropy calculation

Both scenarios increase entropy – by transferring heat from a high temperature source, “Sun”, to a low temperature source, “Space” in 3A, and “Crazy Background Radiation” in 3B (which is really also Space at a higher temperature).

The earth-like planet is sitting in the middle and doesn’t have a significant effect on the entropy of the universe.

In both cases the entropy of the system increases, so both are in accordance with the second law of thermodynamics.

The earth cools to space, but just at a slower rate when the background temperature of “space” is higher.

If we replaced “crazy background radiation” by an atmosphere that was mostly transparent to solar radiation, the analysis would be a little more complex but the result wouldn’t be much different.

Reasons Why It Might be Wrong

Just to be clear, these aren’t true..

1. The hotter body can’t absorb radiation from the colder body

a) see Amazing Things we Find in Textbooks – The Real Second Law of Thermodynamics for six textbooks on heat transfer which all say, yes it does. Actually, seven textbooks, thanks to commenter Bryan identifying his “non-cherrypicked” textbook by “real physicists” which also agreed.

b) see The Amazing Case of “Back Radiation” – Part Three which includes the EBEX experiment as well as a brief explanation of fundamental physics

c) see Absorption of Radiation from Different Temperature Sources – clearing up a few misconceptions on this idea

2. It’s not a real situation because the atmosphere isn’t a black body

It is true that the atmosphere is not a blackbody. But look back at model 3B. It doesn’t matter. Body 3 in this model could be a 250K body with an emissivity of 0.1 and the temperature would still increase over model 3A.

In fact, if the claim is that a colder body can never increase the temperature of a warmer body – all we need is one counter-example to falsify this theory. Now, if you want to modify your theory to something different we can examine this new theory instead.

Reasons Why It Has to be Right

1. The First Law of Thermodynamics. This neglected little jewel is quite important. Energy can’t disappear (or be created) or be quarantined into a mental box.

There is a reason why all the people disputing these basic analyses never explain where the energy goes (if it “can’t” go into changing the temperature of the hotter body that might have absorbed it). The reason – they don’t know.

2. The Second Law of Thermodynamics. This law says that in a closed system entropy cannot decrease. Despite angry claims about “no such thing as a closed system” – that’s what the second law says. Entropy is often simple to calculate.

If a solution uses simple radiation of energy (Stefan-Boltzmann’s law) and satisfies the first and second law of thermodynamics, and some people don’t like it, it suggests that the problem is with their conceptual model.

Conclusion

This is a conceptual model that is very simple.

The sun warms up the earth, and the earth cools to space. The colder “space” is, the faster the rate of net heat transfer. The warmer “space” is, the slower the rate of net heat transfer. And because the sun “pumps in” heat at the same rate, if you slow the rate of heat loss the equilibrium temperature has to increase.

The first law of thermodynamics is the key to understanding this problem. It is simple to verify that model 3A & 3B both satisfy the first law of thermodynamics. In fact, more importantly, a different result would contradict the first law of thermodynamics.

It is also easy to verify that in both 3A & 3B entropy increases.

Just to be clear on a tedious point, the earth and space do not have to radiate as a blackbody to have these conclusions. They just make the model simpler to explain, and the maths easier to understand. We could easily change the emissivity of the planet to 0.9 and the emissivity of space to 0.5 in both models and we would still find that Model 3B had a warmer planetary surface than Model 3A.

Many people will be unhappy, but this blog is not about bringing happiness. Clarity is the objective.

One more hopeless note of despair – this article uses simple theory to prove a point, which is actually a very valuable exercise. Next, some will say – “I don’t want that pointless over-theoretical theory, these people need to prove it with some experiments“.

And so I offer the series, The Amazing Case of “Back Radiation” as proof, especially Part Three. Result of Part Three was – “well, that can’t happen because it goes against theory“..

And so the circle is complete.

Notes

Note 1 – These strange conditions that don’t relate to the real world are to make the conceptual model simpler (and the maths easy). This is the staple of physics (and other sciences) – compare simple models first, then make them more complex and more realistic. If you can prove a theory with a simple model you have saved a lot of work and more people can understand it.

Note 2 – Solar radiation is from a tiny “angle” in the sky, and so the radiation is effectively “captured” by the earth as a flat disk in space. This area is the area of a disk = πr². By contrast, radiation from the sky is from all around the planet, and so the radiation is effectively captured by the surface area of the sphere. This area = 4πr². See The Earth’s Energy Budget – Part One for more explanation of this.

Read Full Post »
In New Theory Proves AGW Wrong! I said:

So, if New Theory Proves AGW Wrong is an exciting subject, you will continue to enjoy the subject for many years, because I’m sure there will be many more papers from physicists “proving” the theory wrong.

However, it’s likely that if they are papers “falsifying” the foundational “greenhouse” gas effect – or radiative-convective model of the atmosphere – then probably each paper will also contradict the ones that came before and the ones that follow after.

I noticed on another blog an article lauding the work of a physicist who reaches some different conclusions about the role of CO2 and other trace gases in the atmosphere.

This has clearly made a lot of people happy which is wonderful. However, if you want to understand the science of the subject, read on.

One of the areas that many people are confused by is the distinction between GCMs and the radiative transfer equations. Well, strictly speaking almost everyone who is confused about the distinction doesn’t know what the radiative transfer equations are.

So I should say:

Many people are confused about the distinction between GCMs and the effect of CO2 in the atmosphere

They are quite different. The role of CO2 and other trace gases is a component of GCMs.

Digression – As an analogy with less emotive power we could consider the subject of ocean circulation. Now it’s easy to prove theoretically that more dense water sinks and less dense water rises. We can do 100’s of experiments in tanks that prove this. Now if the models that calculate the whole ocean circulation don’t quite get the right answers one reason might be that the theory of buoyancy is a huge mistake.

But there could be other reasons as well. For example, flaws in equations for the amount of momentum transferred from the winds to the ocean, knowledge of the salinity throughout the ocean, knowledge of the variation in eddy diffusivity and tens – or hundreds – of other reasons. All we need to do to confirm buoyancy is to go back to our tank experiments.. End of digression.

Happily there is plenty of detailed experimental work to back up “standard theory” about CO2 and therefore prove “new theories” wrong.

Richard M. Goody

RM Goody was the doctoral advisor to Richard Lindzen. He wrote the classic work Atmospheric Radiation: Theoretical Basis (1964). I have the 2nd edition, co-authored with Y.L. Yung, from 1989.

Here are measured vs theoretical spectra at the top of atmosphere. Note that the spectra are displaced for easier comparison:From Atmospheric Radiation, Goody (1989)

From Atmospheric Radiation, Goody (1989)

Click for a larger image

This extract makes it easier to see the magnitude of any differences:From Atmospheric Radiation, Goody (1989)

From Atmospheric Radiation, Goody (1989)

Click for a larger image

Goody & Yung comment:

The agreement between theory and observation in Figs 6.1 and 6.2 is generally within about 10%. It is surprising, at first sight, that it is not better. Uncertainties in the spectroscopic data are partially responsible, but it is difficult to assign all the errors to this source. Local variations in temperature and departures from a strictly stratified atmosphere must also contribute.

The radiosonde data used may not correctly apply to the path of the radiation. The atmospheric temperatures could be adjusted slightly to give better agreement..

How was the theoretical calculation done? By solving this equation, which looks a little daunting, but I will explain it in simple terms:

Before we look in a little detail about the radiative transfer equations, it is important to understand that to calculate the interaction of the atmosphere and radiation, there are two parameters which are required:

  • the quantity of radiatively-active gases (like CO2 and water vapor) vertically through the atmosphere (affects absorption)
  • the temperature profile vertically through the atmosphere (affects emission)

If we have that data, the equation above can be solved to produce a spectrum like the one shown. The uncertainty in the data generates uncertainty in the results.

Given the closeness of the match, if a “new theory” comes along and produces very different results then there are two things that we would expect:

  • demonstrating the improvement in experimental/theoretical match
  • explaining why the existing theory is wrong OR under what specific circumstances the new theory does a better job

When you don’t see either of these you can be reasonably sure that the “new theory” isn’t worth spending too much time on.

Of course, the result from the great RM Goody could be a fluke, or he could have just made the whole thing up. Better to consider this possibility – after all, if a random person has produced a 27-page document with lots of equations it is very likely that this new person if correct, so long as they support your point of view..

Dessler, Yang, Lee, Solbrig, Zhang and Minschwaner

In their paper, An analysis of the dependence of clear-sky top-of-atmosphere outgoing longwave radiation on atmospheric temperature and water vapor, the authors provide a comparison of the measured results from CERES with the solution of the radiative transfer equations (using a particular band model, see note 1):


From Dessler et al (2008)

From Dessler et al (2008)


The authors say:

First, we compare the OLR measurements to OLR calculated from two radiative transfer models. The models use as input simultaneous and collocated measurements of atmospheric temperature and atmospheric water vapor made by the Atmospheric Infrared Sounder (AIRS). We find excellent agreement between the models’ predictions of OLR and observations, well within the uncertainty of the measurements.

Notice the important point that to calculate the OLR (outgoing longwave radiation) measurements at the top of atmosphere we need atmospheric temperature and water vapor concentration (CO2 is well-mixed in the atmosphere so we can assume the values of CO2).

For interest:

The uncertainty of an individual top-of-atmosphere OLR measurement is 5 W/m2 , while the uncertainty of average OLR over a 1-latitude  1-longitude box, which contains many viewing angles, is 1.5 W/m²

The primary purpose of this paper wasn’t to demonstrate the correctness of the radiative transfer equations – these are beyond dispute – but was first to demonstrate the accuracy of a particular band model, and second, to use that result to demonstrate the relationship between the surface temperature, humidity and OLR measurement.

So we have detailed spectral calculations matching standard theory as well as 100,000 flux measurements matching theory – at the top of atmosphere.

What about at the ground?

Walden, Warren and Murcray

In Measurements of the downward longwave radiation spectrum over the Antarctic plateau and comparisons with a line-by-line radiative transfer model for clear skies, the authors compare measured spectra at the ground with the theoretical results:


Antarctica - Walden (1998)

Antarctica - Walden (1998)


As you can see, a close match across all measured wavelengths.

I don’t remember seeing a paper which compares large numbers of DLR (downward longwave radiation) measurements vs theory (there probably are some), but I hope I have done enough to demonstrate that people with new theories have a mountain to climb if they want to prove the standard theory wrong.

Whether or not GCMs can predict the future or even model the past is a totally different question from Do we understand the physics of radiation transfer through the atmosphere? The answer to this last question is “yes”.

The Standard Approach – Theory

Understanding the theory of radiative transfer is quite daunting without a maths background, and as many readers don’t want to see lots of equations I will try and describe the approach non-mathematically. There is some simple maths for this subject in CO2 – An Insignificant Trace Gas? Part Three.

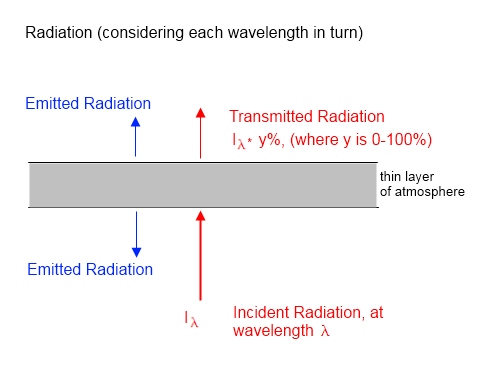
Consider a “monochromatic” beam of radiation travelling up through a thin layer of atmosphere:

Monochromatic means “at one wavelength”.

The light entering the layer at the bottom will be partly absorbed by the gas, dependent on the presence of any absorbers at that wavelength. The actual calculation of the amount of absorption is simple. The attenuation that results is in proportion to the intensity of radiation and in proportion to the amount of absorbers and a parameter called “capture cross section”. This last parameter relates to the effectiveness of the particular gas in absorbing that wavelength of radiation – and is measured in a spectroscopy lab.

There are complications in that the capture cross section of a gas is also dependent on pressure and temperature – and pressure varies by a factor of five from the surface to the tropopause. This just makes the calculation more tedious, it doesn’t present any major obstacles to carrying out the calculation.

That means we can calculate the intensity of radiation at that wavelength emerging from the other side of the slab of atmosphere. Or does it?

No, the problem is not complete. If a gas can absorb at a wavelength it will also radiate at that same wavelength.

Energy from radiation absorbed by the gas is shared thermally with all other gas molecules (except high up in the atmosphere where the pressure is very low) and so all radiatively-active gases will emit radiation. However, at the wavelength we are considering, only specific gases will radiate.

So the calculation for the radiation leaving the slab of atmosphere is also dependent on the temperature of the gas and its ability to radiate at that wavelength.

To complete the calculation we need to carry it out across all wavelengths (“integrate” across all wavelengths).

That calculation is then complete for the thin slab of atmosphere. So finally we need to “integrate” this calculation vertically through the atmosphere.

If you read back through the explanation, as it becomes clearer you will see that you need to know the quantity of CO2, water vapor and other trace gases at each height. And that you need to know the temperature at each height in the atmosphere.

Now it’s not a calculation you can do in your head, or on a pocket calculator. Which is why the many people writing poetry on this subject are usually wrong. If someone reaches a conclusion and it isn’t based on solving the equations shown above in the RM Goody section then it’s not reliable. And, therefore, poetry.

The Standard Approach – Doubling CO2

Armed with the knowledge of how to calculate the interaction of the atmosphere with radiation, how do we approach the question of the effect of doubling CO2?

In the past many people had slightly different approaches, so usually it is prepared in a standard way – explained further in CO2 – An Insignificant Trace Gas? Part Seven – The Boring Numbers.

The most important point to understand is that the atmosphere and surface are heated by the sun via radiation, and they cool to space via radiation. While all of the components of the climate are inter-related, the fundamental consideration is that if cooling to space reduces then the climate will heat up (assuming constant solar radiation). Which part of the climate, at what speed, in what order? These are all important questions but first understand that if the climate system radiates less energy to space then the climate system will heat up. See The Earth’s Energy Budget – Part Two.

Therefore, the usual calculation of the effect of doubling CO2 – prior to any feedbacks – assumes that the same temperature profile exists vertically through the atmosphere, along with the same concentration of water vapor. The question is then:

How much does the surface temperature have to increase to allow the same amount of radiation to be emitted to space?

See The Earth’s Energy Budget – Part Three for an explanation about why more CO2 means less radiation emitted to space initially.

The end result is that – without feedbacks – the surface will increase in temperature about 1°C to allow the same amount of radiation to space (compared with the case before CO2 was doubled).

The calculation relies on solving the radiative transfer equations as explained in words above, and shown mathematically in the extract from Goody’s book.

The “New Theory”

For reasons already explained, if someone has a new theory that gets a completely different result for the effect of more CO2, then we would expect them to explain where everyone else went wrong.

There is no sign of that in this paper.

For interested readers, I provide a few comments on the paper. The author is described as “John Nicol, Professor Emeritus of Physics, James Cook University, Australia”. Perhaps modesty prevents him mentioning the professorship in his own bio – in any case, he probably knows a lot of physics – as do the many professors of physics who have studied radiation in the atmosphere for many decades and written the books and papers on the subject..

In any case, on this blog, we weigh up ideas and evidence rather than resumés..

Here is his conclusion:

The findings clearly show that any gas with an absorption line or band lying within the spectral range of the radiation field from the warmed earth, will be capable of contributing towards raising the temperature of the earth. However, it is equally clear that after reaching a fixed threshold of so-called Greenhouse gas density, which is much lower than that currently found in the atmosphere, there will be no further increase in temperature from this source, no matter how large the increase in the atmospheric density of such gases.

So he understands the inappropriately-named “greenhouse” effect in basic terms but effectively claims that the effect of CO2 is “saturated”.

The paper’s advocate claimed:

..closely argued, mathematical and physical analysis of how energy is transmitted from the surface through the atmosphere, answers all questions..

– however, the paper is anything but.

There are some equations:

  • Planck’s law of blackbody radiation (p3)
  • Stefan-Boltzmann’s law of total radiation (p2)
  • Wien’s law of peak radiation (p3)
  • spectral line width due to natural broadening, doppler broadening and collision broadening (p7 &8)
  • density changes vs height in the atmosphere (p6)

These are all standard equations and it is not at all clear what equations are solved to demonstrate his conclusion.

He derives the expression for absorption of radiation (often known as Beer’s law – see CO2 – An Insignificant Trace Gas? Part Three). But most importantly, there is no equation for emission of radiation by the atmosphere. Emission of radiation is discussed, but whether or not it is included in his calculation is hard to determine.

Many of the sections in his paper are what you would find in a basic textbook (although line width equations would be in a more advanced textbook).

There are typos like the distance from the earth to the sun – which is not 1.5M km (p3). This doesn’t affect any conclusion, but shows that basic checking has not been done.

There are confusing elements. For example, the blackbody radiation curve (fig 1) for a 289K body, expressed against frequency. The frequency of peak radiation actually matches a wavelength of 17.6 μm, not 10 μm. (Peak frequency, ν = 1.7×10¹³ Hz, λ=c/ν = 3×10⁸/1.7×1013 = 17.6 μm. This corresponds to a temperature of 2.898×10⁻³/λ = 165 K).

And comments like this suggest some flawed thinking about the subject of radiative transfer:

The black inverted curve shows the fraction of radiation emitted at each frequency which escapes from the top of the troposphere at a height of 10 km and thus represents the proportion of the energy which could be additionally captured by an increase of CO2 and so contribute to the further warming of air in the various layers of the troposphere. It thus represents the effective absorption spectrum of CO2 within the range of frequencies shown after accounting for collisional line broadening which provides a reduced but significant level of absorption even in the very far wings of the line which is represented in Figure 3 on page 6.

Why flawed? Because the radiation emitted from the top of the troposphere is made up from two components:

  • surface radiation which is transmitted through the atmosphere
  • radiation emitted by the atmosphere at different heights which is transmitted through the atmosphere

Because other parts of the paper discuss emission by the atmosphere it is hard to determine whether or not it is ignored in his calculations, or whether the paper fails to convey the author’s approach.

One interesting comment is made towards the end of the paper:

The calculations show that doubling the level of CO2 leads to an escape of only 0.75 %, a difference of 1.8 %.  Thus, in this example where the chosen value of the broadening used is significantly less than the actual case in the atmosphere, an additional 6 Watts, from the original 396 Watts, would be retained in the 10 km column within the troposphere, when the density of carbon dioxide is doubled.

Now when we consider the effect of doubling CO2 the question is what is the “radiative forcing” – the change in top of atmosphere flux. The standard result is 3.7 W/m². (This is what leads to the calculation of 1°C surface temperature change prior to feedback).

It appears (but I can’t be certain) that Dr. Nicol thinks that the radiative forcing for doubling CO2 is even higher than the calculations that appear in the many papers used in the IPCC report. From his calculations he reports that 6W/m² would be retained.

On a technical note, although radiative forcing has a precise definition, it isn’t clear what exactly Dr. Nicol means by his value of “retained radiation”.

However, it does appear to conflict which his conclusion (extract reported at the beginning of this section).

There are many other areas of confusion in his paper. The focus appears to be on the surface forcing from changes in CO2 rather than changes in the energy balance for the whole climate system. There is a section (fig 6, page 21) which examines how much terrestrial radiation is absorbed in the first 50m of the atmosphere by the CO2 band at current and higher concentrations.

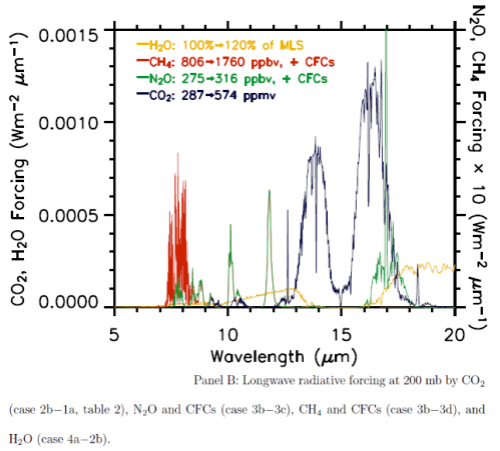
What would be more interesting is to see what changes occur in the top of atmosphere forcing from these changes, for example:


Longwave radiative forcing from increases in various "greenhouse" gases

Longwave radiative forcing from increases in various "greenhouse" gases


This graph is from W.D. Collins (2006) – see CO2 – An Insignificant Trace Gas? – Part Eight – Saturation.

Note the blue curve. This graph makes clear the calculated forcing vs wavelength. By contrast Dr. Nicol’s paper doesn’t really make clear what surface forcing is considered – how far out into the “wings” of the CO2 band is considered, or what result will occur at the surface for any top of atmosphere changes.

It is almost as if he is totally unaware of the work done on this problem since the 1960’s.

It is also possible that I have misunderstood what he is trying to demonstrate or what he has demonstrated. Hopefully someone, perhaps even Dr. Nicol, can explain if that is the case.

Conclusion

Calculations of radiation through the atmosphere do require consideration of absorption AND emission. The formal radiative transfer equations for the atmosphere are not innovative or in question – they are in all the textbooks and well-known to scientists in the field.

Experimental results closely match theory – both in total flux values and in spectral analysis. This demonstrates that radiative transfer is correctly explained by the standard theory.

New and innovative approaches to the subject are to be welcomed. However, just because someone with a physics degree, or a doctorate in physics, produces lots of equations and writes a conclusion doesn’t mean they have overturned standard theory.

New approaches need to demonstrate exactly what is wrong with the standard approach as found in all the textbooks and formative papers on this subject. They also need to explain, if they reach different conclusions, why the existing solutions match the results so closely.

Dr. Nicol’s paper doesn’t explain what’s wrong with existing theory and it is almost as if he is unaware of it.

References

Atmospheric Radiation: Theoretical Basis, Goody & Yung, Oxford University Press (2nd ed. 1989)

An analysis of the dependence of clear-sky top-of-atmosphere outgoing longwave radiation on atmospheric temperature and water vapor, by Dessler et al, Journal of Geophysics Research (2008)

Measurements of the downward longwave radiation spectrum over the Antarctic plateau and comparisons with a line-by-line radiative transfer model for clear skies, Walden et al, Journal of Geophysical Research (1998)

Notes

Note 1 – A “band model” is a mathematical expression which simplifies the complexity of the line by line (LBL) solution of the radiative transfer equations. Instead of having to lookup a value at every wavelength the band model uses an expression which is computationally much quicker.

Read Full Post »