This blog is about climate science.
I wanted to take a look at Renewable Energy because it’s interesting and related to climate science in an obvious way. Information from media sources confirms my belief that 99% of what is produced by the media is rehashed press releases from various organizations with very little fact checking. (Just a note for citizens alarmed by this statement – they are still the “go to source” for the weather, footage of disasters and partly-made-up stories about celebrities).
Regular readers of this blog know that the articles and discussion so far have only been about the science – what can be proven, what evidence exists, and so on. Questions about motives, about “things people might have done”, and so on, are not of interest in the climate discussion (not for this blog). There are much better blogs for that – with much larger readerships.
Here’s an extract from About this Blog:
Opinions
Opinions are often interesting and sometimes entertaining. But what do we learn from opinions? It’s more useful to understand the science behind the subject. What is this particular theory built on? How long has the theory been “established”? What lines of evidence support this theory? What evidence would falsify this theory? What do opposing theories say?
Anything else?
This blog will try and stay away from guessing motives and insulting people because of how they vote or their religious beliefs. However, this doesn’t mean we won’t use satire now and again as it can make the day more interesting.
The same principles will apply for this discussion about renewables. Our focus will be on technical and commercial aspects of renewable energy, with a focus on evidence rather than figuring it out from “motive attribution”. And wishful thinking – wonderful though it is for reducing personal stress – will be challenged.
As always, the moderator reserves the right to remove comments that don’t meet these painful requirements.
Here’s a claim about renewables from a recent media article:
By Bloomberg New Energy Finance’s most recent calculations a new wind farm in Australia would cost $74 a megawatt hour..
..”Wind is already the cheapest, and solar PV [photovoltaic panels] will be cheaper than gas in around two years, in 2017. We project that wind will continue to decline in cost, though at a more modest rate than solar. Solar will become the dominant source in the longer term.”
I couldn’t find any evidence in the article that verified the claim. Only that it came from Bloomberg New Energy Finance and was the opposite of a radio shock jock. Generally I favor my dogs’ opinions over opinionated media people (unless it is about the necessity of an infinite supply of Schmackos starting now, right now). But I have a skeptical mindset and not knowing the wonderful people at Bloomberg I have no idea whether their claim is rock-solid accurate data, or “wishful thinking to promote their products so they can make lots of money and retire early”.
Calculating the cost of anything like this is difficult. What is the basis of the cost calculation? I don’t know if the claim in BNEF’s calculation is “accurate” – but without context it is not such a useful number. The fact that BNEF might have some vested interest in a favorable comparison over coal and gas is just something I assume.
But, like with climate science, instead of discussing motives and political stances, we will just try and figure out how the numbers stack up. We won’t be pitting coal companies (=devils or angels depending on your political beliefs) against wind turbine producers (=devils or angels depending on your political beliefs) or against green activists (=devils or angels depending on your political beliefs).
Instead we will look for data – a crazy idea and I completely understand how very unpopular it is. Luckily, I’m sure I can help people struggling with the idea to find better websites on which to comment.
Calculating the Cost
I’ve read the details of a few business plans and I’m sure that most other business plans also have the same issue – change a few parameters (=”assumptions”, often “reasonable assumptions”) and the outlook goes from amazing riches to destitution and bankruptcy.
The cost per MWHr of wind energy will depend on a few factors:
- cost of buying a wind turbine
- land acquisition/land rental costs
- installation cost
- grid connection costs
- the “backup requirement” aka “capacity credit”
- cost of capital
- lifetime of equipment
- maintenance costs
- % utilization (output energy / nameplate capacity)
And of course, in any discussion about “the future”, favorable assumptions can be made about “the next generation”. Is the calculation of $74/MWHr based on what was shipped 5 years ago and its actuals, or what is suggested for a turbine purchased next year?
If you want wind to look better than gas or coal – or the converse – there are enough variables to get the result you want. I’ll be amazed if you can’t change the relative costs by a factor of 5 by playing around with what appear to be reasonable assumptions.
Perhaps the data is easy to obtain. I’m sure many readers have some or all of this data to hand.
Moore’s Law and Other Industries
Most people are familiar with the now legendary statement from the 1960s about semiconductor performance doubling every 18 months. This revolution is amazing. But it’s unusual.
There are a lot of economies of scale from mass production in a factory. But mostly limiting cases are reached pretty quickly, after which cost reductions of a few percent a year are great results – rather than producing the same product for 1% of what it cost just 10 years before. Semiconductors are the exception.
When a product is made from steel alloys, carbon fiber composites or similar materials we can’t expect Moore’s law to kick in. On the other hand, products that rely on a combination of software, electronic components and “traditional materials” and have been produced on small scales up until now can expect major cost reductions from amortizing costs (software, custom chips, tooling, etc) and general economies of scale (purchasing power, standardizing processes, etc).
In some industries, rapid growth actually causes cost increases. If you want an experienced team to provide project management, installation and commissioning services you might find that the boom in renewables is driving those costs up, not down.
A friend of mine working for a natural gas producer in Queensland, Australia recounted the story of the cost of building a dam a few years ago. Long story short, the internal estimates ranged from $2M to $7M, but when the tenders came in from general contractors the prices were $10M to $25M. The reason was a combination of:
- escalating contractor costs (due to the boom)
- compliance with new government environmental regulations
- compliance with the customer’s many policies / OH&S requirements
- the contractual risk due to all of the above, along with the significant proliferation of contract terms (i.e., will we get sued, have we taken on liabilities we don’t understand, etc)
The point being that industry insiders – i.e., the customer – with a strong vested interest in understanding current costs was out by a factor of more than three in a traditional enterprise. This kind of inaccuracy is unusual but it can happen when the industry landscape is changing quickly.
Even if you have signed a fixed price contract with an EPC you can only be sure this is the minimum you will be paying.
The only point I’m making is that a lot of costs are unknown even by experienced people in the field. Companies like BNEF might make some assumptions but it’s a low stress exercise when someone else will be paying the actual bills.
Intermittency & Grid Operators
We will discuss this further in future articles. This is a key issue between renewables and fossil fuel / nuclear power stations. The traditional power stations can create energy when it is needed. Wind and solar – mainstays of the renewable revolution – create energy when the sun shines and the wind blows.
As a starting point for any discussion let’s assume that storing energy is massively uneconomic. While new developments might be available “around the corner”, storing energy is very expensive. The only real mechanism is pumped hydro schemes. Of course, we can discuss this.
Grid operators have a challenge – balance demand with supply (because storage capacity is virtually zero). Demand is variable and although there is some predictability, there are unexpected changes even in the short term.
The demand curve depends on the country. For example, the UK has peak demand in the winter evenings. Wealthy hotter countries have peak demand in the summer in the middle of the day (air-conditioning).
There are two important principles:
- Grid operators already have to deal with intermittency because conventional power stations go off-line with planned outages and with unplanned, last minute, outages
- Renewables have a “capacity credit” that is usually less than their expected output
The first is a simple one. An example is the Sizewell B nuclear power station in the UK supplying about 1GW [fixed] out of 80GW of total grid supply. From time to time it shuts down and the grid operator gets very little notice. So grid operators already have to deal with this. They use statistical calculations to ensure excess supply during normal operation, based on an acceptable “loss of load probability”. Total electricity demand is variable and supply is continually adjusted to match that demand. Of course, the scale of intermittency from large penetration of renewables may present challenges that are difficult to deal with by comparison with current intermittency.
The second is the difficult one. Here’s an example from a textbook by Godfrey, that’s actually a collection of articles on (mainly) UK renewables:
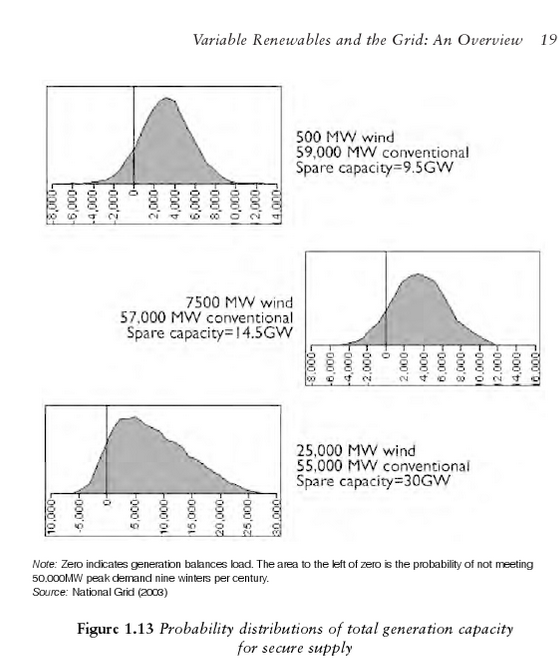
The essence of the calculation is a probabilistic one. At small penetration levels, the energy input from wind power displaces the need for energy generation from traditional sources. But as the percentage of wind power increases, the “potential down time” causes more problems – requiring more backup generation on standby. In the calculations above, wind going from 0.5 GW to 25 GW only saves 4 GW in conventional “capacity”. This is the meaning of capacity credit – adding 25 GW of wind power (under this simulation) provides a capacity credit of only 4 GW. So you can’t remove 25 GW of conventional from the grid, you can only remove 4 GW of conventional power.
Now the calculation of capacity credit depends on the specifics of the history of wind speeds in the region. Increasing the geographical spread of wind power generation produces better results, dependent on the lower correlation of wind speeds across larger regions. Different countries get different results.
So there’s an additional cost with wind power that someone has to pay for – which increases along with the penetration of wind power. In the immediate future this might not be a problem because perhaps the capacity already exists and is just being put on standby. However, at some stage these older plants will be at end of life and conventional plants will need to be built to provide backup.
Many calculations exist of the estimated $/MWh from providing such a backup. We will dig into those in future articles. My initial impression is that there are a lot of unknowns in the real cost of backup supply because for much potential backup supply the lifetime / maintenance impact of frequent start-stops is unclear. A lot of this is thermal shock issues – each thermal cycle costs $X.. (based on the design of the plant to handle so many thousand starts before a major overhaul is needed).
The Other Side of the Equation – Conventional Power
It will also be interesting to get some data around conventional power. Right now, the cost of displacing conventional power is new investment in renewables, but keeping conventional power is not free. Every existing station has a life and will one day need to be replaced (or demand will need to be reduced). It might be a deferred cost but it will still be a cost.
$ and GHG emissions
There is a cost to adding 1GW of wind power. There is a cost to adding 1GW of solar power. There is also a GHG cost – that is, building a solar panel or a wind turbine is not energy free and must be producing GHGs in the process. It would be interesting to get some data on this also.
Conclusion – Introduction
I wrote this article because finding real data is demanding and many websites focused on the topic are advocacy-based with minimal data. Their starting point is often the insane folly and/or mendacious intent of “the other side”. The approach we will take here is to gather and analyze data.. As if the future of the world was not at stake. As if it was not a headlong rush into lunacy to try and generate most energy from renewables.. As if it was not an unbelievable sin to continue to create electricity from fossil fuels..
This approach might allow us to form conclusions from the data rather than the reverse.
Let’s see how this approach goes.
I am hoping many current (and future) readers can contribute to the discussion – with data, uncertainties, clarifications.
I’m not expecting to be able to produce “a number” for windpower or solar power. I’m hopeful that with some research, analysis and critical questions we might be able to summarize some believable range of values for the different elements of building a renewable energy supply, and also quantify the uncertainties.
Most of what I will write in future articles I don’t yet know. Perhaps someone already has a website where this project is already complete and in my Part Two will just point readers there..
Articles in this Series
Renewable Energy I – Introduction
Renewables II – Solar and Free Lunches – Solar power
Renewables III – US Grid Operators’ Opinions – The grid operators’ concerns
Renewables IV – Wind, Forecast Horizon & Backups – Some more detail about wind power – what do we do when the wind goes on vacation
Renewables V – Grid Stability As Wind Power Penetration Increases
Renewables VI – Report says.. 100% Renewables by 2030 or 2050
Renewables VII – Feasibility and Reality – Geothermal example
Renewables VIII – Transmission Costs And Outsourcing Renewable Generation
Renewables IX – Onshore Wind Costs
Renewables X – Nationalism vs Inter-Nationalism
Renewables XI – Cost of Gas Plants vs Wind Farms
Renewables XII – Windpower as Baseload and SuperGrids
Renewables XIII – One of Wind’s Hidden Costs
Renewables XIV – Minimized Cost of 99.9% Renewable Study
Renewables XV – Offshore Wind Costs
Renewables XVI – JP Morgan advises
Renewables XVII – Demand Management 1
Renewables XVIII – Demand Management & Levelized Cost
Renewables XIX – Behind the Executive Summary and Reality vs Dreams
References
Renewable Electricity and the Grid : The Challenge of Variability, Godfrey Boyle, Earthscan (2007)


How important really is it to know capacity requirement? Consumer (obviously) pays and market determines its structure. Here we run on over 75% renewables for electricity, fortunately with lots of hydro and increasing amounts of geothermal. Given the way at least our electricity market works, what is important for a would-be generator to know is what is my costs (as you specified), and what proportion of the available energy will I be able to see at what price. (Market analysis). If renewable capacity goes down (drought, no wind) then electricity price on spot market goes through roof as grid tries to encourage generation to meet demand. Someone wanting to fill demand with say fast-start gas or new geothermal sees that opportunity and calculates whether they can make money from it.
The key elements are no subsidies, open access to market, price signals and access to market price data.
You can see live pricing http://www.electricityinfo.co.nz/comitFta/ftapage.main and more about market on good old wikipedia.https://en.wikipedia.org/wiki/New_Zealand_electricity_market#Wholesale_Spot_Market
Implementing things like carbon tax or carbon trading feed into market as higher costs for would be FF generators.
Phil,
The great country of NZ is blessed with renewables. Plus the All Blacks.
Imagine if you will a country with almost no hydro, that has signalled the desire within a few decades to transform from conventional coal, gas & nuclear to renewables. How does the pricing mechanism work?
Put it another way – if the pricing signal indicates the profit potential of more capacity how many years between the start of frequent power outages and the arrival new capacity?
I’m not sure how pricing mechanisms work for occasional outages. I’m sure smart operators see the opportunity. But the regulatory risk is also quite high, possibly deterring smart operators – politicians might change the rules, politicians might “over tax” the “greedy capitalists who made all that money last quarter from the energy bills of poor hard working [Americans/British/Germans/Australians/etc]“. New politicians might win elections on such a ticket, replacing politicians who had let the market produce new supply..
A few countries have gone for something quite different – massively inflated consumer feed-in prices for solar energy. This is more like a transfer of wealth from “the taxpayer” to “the reasonably affluent classes that can afford the investment”.
That’s one of my hot buttons. It is a transfer of wealth. You can add “ordinary ratepayer” to taxpayer as well. And it’s not just that the power companies are forced to effectively pay retail prices for the power. The cost of electricity includes the cost of the grid itself. Someone whose annual bill is zero because the power generated equaled or exceeded the amount used isn’t paying that cost but definitely gets the benefit.
Are you by any chance referring to e.g. Germany?
How is that different from not including the external costs of e.g. gas- and coal burning which benefit the affluent classes that can afford to invest in fossil fuel based generation capacity?
Or that citizens will never be able to buy and operate something like a nuclear power plant. At least small-scale renewables like solar, and to a certain extent wind, allow ordinary citizens to profit and have a say in the way their electricity is generated.
I think there is a lot more to renewables like solar than just cost and keeping the lights on.
“I think there is a lot more to renewables like solar than just cost and keeping the lights on.”
And that is why you are mistaken about renewables.
“Reasonably affluent classes”…
Bangladesh is installing about 100,000 new rooftop solar systems per month:
alan2102,
Interesting.
$78.4 million to finance 480,000 solar home systems, so about $160 per system. So maybe 80 W peak power and 0.5 kWh per day (2% of what we use in the developed world). That is likely a big improvement for people who have no other access to electricity because there is no grid. And it is likely much cheaper than building a proper grid. But it is not clear that these tiny solar systems are something that can actually be built on.
SoD is correct that the policies adopted in many developed countries constitute a transfer of wealth to the relatively affluent.
Mike M: ” the policies adopted in many developed countries constitute a transfer of wealth to the relatively affluent.”
True. Except when counter-policies do the opposite:
But actually it may not be a matter of “policies” at all. The technologies themselves may be fundamentally disruptive. They might (and increasingly it looks like they WILL) simply steamroller all these arguments, which will appear nit-picky in the rear-view mirror, 20 years from now. I fear that SoD’s green eyeshades and sharp pencil-points were appropriate and relevant 15 years ago, but no longer. They are being left behind by rapidly-unfolding events. Or so it seems to me. But WTF do I know, anyway? 🙂
http://tonyseba.com/its-a-one-two-punch-pv-magazine-4-page-interview-with-tony-seba/
http://tonyseba.com/letter-from-shanghai-the-solar-disruption-is-accelerating/
I heartily agree.
BTW, the arguments Professor Seba makes are illustrative, appropriate for his broad audience. Sometimes, from the perspective of those seeking investments, they are informative for guiding capital allocations, since investments are stochastic creatures anyway.
But the core arguments Professor Seba and others make have to do with key efficiencies, not only have to do with raw generation capacity of a solar material, but where the energy is generated. Simply by generating energy close to point of consumption, one gains tremendously. For instance, Professor Kevin Anderson of the UK Tyndall Centre points out that 1 watt-hour of energy consumed in a residence demands 12 watt-hours of generation at the power station to deliver it, due to losses all along the chain. Accordinginly, if solar is 8x more efficient than burning explosive methane to generate a watt-hour, doing it at point of consumption is almost 100x and surely 90x more efficient than doing it under the present model. Professor Seba’s point is that no business model can withstand that kind of discrepancy in the reality of producing energy, and the system will, eventually, move to one where solar of all sizes dominates, whether it is community solar or residential solar. Moreover, it incentivizes companies to overcome hurdles thrown in the way by regulatory agencies captured by utilities and, for instance, sellers and transporters of explosive methane. And by curtailing features like net metering, “the grid” and its consumers are depriving itself of all those electrons which are being generated by people who, more or less, are producing that power without the capital costs which “the grid” would otherwise need to invest.
I could say, for instance, that any experience in another country has no relevance whatsoever to that in the United States, or the experience in California has no relevance to that in Massachusetts nor in Hawaii. But, surely, that’s overstating it. Accordingly, students of technological adoption and especially the business end of it will point out some very strong tendencies within the developments. These may not be physical cause and effect, but they do, in many instances, have the predictive power of many quantitative laws in, say, ecology. As such, I think they are worthy of respect.
And I think the present discussion, apart from alan2102, ignores the capitalization and timing requirements for bringing new energy and new kinds of energy on, as well as the history of technological adoption.
And this doesn’t even begin to address the reenforcing technologies of all-electric vehicles and the self-driving which Professor Seba also rolls in. He is, after all, a professor of business specializing in disruption of markets, not energy.
But, hey, ignore it. The proof will be there soon enough.
Alan2102,
I’ll take SoD’s sharp pencil and green eye shade over magical thinking 365 days a year (366 in leap years). Make no mistake, the links you give rely on magical thinking:
“To understand this concept, think of how digital photography disrupted film photography. … Today energy is like film photography was in the 20th century.”
“The solar disruption has many of the same characteristics of the information technology disruption.”
The underlying logic is that if A and B share some characteristics, they can be assumed to share whatever other characteristics we like. I share a number of characteristics with successful professional athletes. But the characteristics we don’t share are far more important.
Alan2012 and Mike M: Alan is promoting disruptive technological change:
“But actually it may not be a matter of “policies” at all. The technologies themselves may be fundamentally disruptive. They might (and increasingly it looks like they WILL) simply steamroller all these arguments, which will appear nit-picky in the rear-view mirror, 20 years from now.”
A number of entrepreneurs who were major players in disruptive computer and internet businesses have invested in “clean energy’ or “CleanTech”. Have these potential visionaries accurately see real potential for disruptive change in energy, or were they merely optimists who happened to be in the right place when the time was right for disruptive change? Their track record suggest the latter. WInd and solar appear to be relatively mature technologies that are up against the fundamental limitations of our planet and society. See David MacKay’s book/website (withouthotair.com) to see how much power might be available from covering 10% of Great Britain with wind turbines or solar panels. How much intermittent energy can be stored? MacKay is an advocate of clean energy who does not focus on cost, merely feasibility.
I’ll admit that it is impossible to know when we are on the verge of truly disruptive advances that have suddenly made disruptive change practical: internal combustion engines for personal cars and planes, microprocessors for computers, fiber optic networks and personal computers for the internet. It also isn’t obvious when such disruption has reached its limits: The speed of passenger jets hasn’t increased in a half century. Likewise, we went to the moon a half-century ago, but that technology makes a two-year manned mission to Mars a dubious proposition based on the problems encountered on seven week-long trips to the moon. (Disruptive change was provided by rovers, which have probably learned more about Mars than astronauts did about the moon.)
hypergeometric
1. Can we get a reference for energy loss being 92% of energy generation. I don’t believe it.
2. “..if solar is 8x more efficient than burning explosive methane to generate a watt-hour..”
Solar energy itself is free. Therefore, it’s irrelevant to any economics what efficiencies there are in energy generation of methane vs solar conversion to electricity. The economic question is a comparison of investment of resources needed to create 1MWh from solar vs 1MWh from burning methane.
This number, however, despite its lack of relevance, doesn’t seem to be based on reality. So I don’t believe it either. A modern CCGT power station has a typical efficiency of 55-60% based on the MWh of energy in methane delivered at the flange divided by the MWh energy at the output of the HV transformer. Perhaps the energy cost of extracting and delivering the methane is factored in. References? By comparison solar PV cells deliver about 12% of the solar energy (given the high temperature of the PV cell when in operation) and then there’s local inverter losses taking it to about 10%.
3. If we consider the high cost of delivering a transmission network to all consumers and the large losses involved (whatever value they actually are) then solar will one day become the major power source as everyone will run “off grid”.. Really? Well, let’s say solar panels were actually free. Add up the cost of the electronics, the physical structure and the cost of storage. What do you get? The structure might last “forever”, the electronics perhaps 10 years, and the storage?
It is an interesting calculation. Right now, even with free solar panels, I believe running off grid will still be quite expensive. But I haven’t done the sums.
Of course, if you want to run “off grid” but still have “the grid” available on demand at the same prices as now, that’s a different equation (you need less storage).
The equation depends on where you live (annual solar insolation & length of continuous time no solar is available) and how much daily energy you consume.
So, while the fraction of cost for solar PV modules of a solar installation is dwindling — already most of the cost is cost of money to manufacture, design, build, maintain — the “cost” of a solar PV installation is whatever that is over its working lifetime. As good as they are, that is finite, and, as you suggest, that gives the cost per generated KwH.
As far as the loss for transmission go, I have read as low as a national average of 6%, with variations to, say, 9% (for Massachusetts) from EIA.gov per http://www.eia.gov/tools/faqs/faq.cfm?id=105&t=3, and as high as the 12% quoted from many of Professor Kevin Anderson’s presentations where he has a slide called “The Electricity System”, such as slide 81 of http://kevinanderson.info/blog/wp-content/uploads/2012/11/Cabot-Seminar-anderson-ppt.pdf. He is arguing for the efficacy of demand side reductions to solve carbon emissions.
I am digging for primary references *he* got those from, but that may take a bit. I will find them though, and get back.
Unless your figures are based upon some empirical in-field numbers which we do not have access to, the solar panels we have installed (X-series, 345w, SunPower) are spec’d at 21.5%. http://us.sunpower.com/sites/sunpower/files/media-library/data-sheets/ds-x21-series-335-345-residential-solar-panels-datasheet.pdf. Now, these are datasheets, not in field, but I would ask for similar references backing up your 12% numbers, as you asked for mine. The SunPower panels also have some complicated circuitry which optimizes them for shading. And we elected SunPower because they made #2 on a list of producers reflecting good environmental impact from manufacture and labor practices from the Silicon Valley Toxics Coalition (q.v.).
I should say that in our search for a solar installation, I found that even some of the solar companies did not get what we wanted to do, focussed as they were upon expected values. In our case we have a 10 Kw installation, which is at full insolation, *way* more than we need. But, then, considering that we have *some* shading issues, especially in winter, the game was to generate way, way more than needed at optimal times, and “bank” the energy, whether by net metering or SRECs (a Massachusetts thing), to use as credits against drawing from “the grid” at other times, or, conceivably, should the rates be adjusted lower in future, some mix of that and local energy storage. Note we already get 100% (as the accounting say) of our “grid” energy from wind, although with the same kinds of losses that explosive methane generation might offer.
For those who don’t want to sift through Anderson’s presentation to find the figure in question, I have extracted it and made it available at
https://goo.gl/HS6Uby
for your reference.
hypergeometric
You said:
Which I took to mean starting with 12 units, we lose 11 and end up with 1. That is, an overall efficiency of 1/12, about 8%, and a loss of 92%.
Then you said:
So that’s completely different. That is an overall efficiency of say 91%, with a loss of 9%.
Which one are you going with?
I’ll take the 2nd one as quite reasonable and the 1st one as completely unreasonable.
Those two were both numbers trying to get at the same thing. Part of the problem is definitions, I find. First of all, EIA is using net generation at the outgoing terminal as their starting point, not gross generation. The latter includes power lost due to using the energy generated to operate the generating plant itself. Second, as I said, I am continuing to look for data to back up Anderson’s claims, and I also said it could take a while …. days, in fact, since this is not my top priority. However, as I dig, I also find things which contribute to inefficiencies of up to 25% in the transmission grid … not the EIA’s mere 9% … due to something called “grid congestion”. As I understand it, this is because the spatial laydown of the grid does not necessarily coincide with what the demand pattern is at any given moment. Moreover there is another element called “demand response inefficiency” which has nothing to do with transmission inefficiency. I am not trying to confuse matters. I’m trying to explain that when these questions are addressed from the engineering side rather than from the physics side, it is important to tease out what is what. I’m in the process of doing that. As I said, it will take time. I continue to look for core references backing up the claims of Anderson and Bows claim.
You can buy solar panels with a range of efficiencies. The higher efficiencies are more expensive. But it’s a rapidly changing field. I’m going on papers which are a few years old and also the current notes in pro-solar blogs.
For example: Energy payback time and carbon footprint of commercial photovoltaic systems, M.J. (Mariska) de Wild-Scholten, Solar Energy Materials & Solar Cells (2013). The efficiencies given for the mono-Si panels are 14.8%.
If you tell me that the average solar panels being purchased in 2015 have a “nameplate” efficiency of 21%, I’ll accept your number. It would be a big jump, of course. (It doesn’t change the points I made). On the other hand if you tell me only that you bought one with 21% efficiency then that isn’t so relevant.
The nameplate efficiency is not what you actually get. It’s the 25’C value. At the time when you are generating a lot of electricity from solar, the panel is hot. I have seen figures of 10% loss at 50’C – a typical temperature when sitting in direct sunlight at midday. Inverter efficiency is around 90%. – So combining both losses you have about 15% nameplate efficiency x 90% x 90% = 12%.
Again, all of these numbers depend on the equipment you choose (and the location – for peak temperature of your panel). I don’t think any of the actual solar efficiency numbers are so relevant to the points you were making.
I have data from colleagues who have installed sets of panels for a year or two, and what the specs of their panels are and how much they generate compared to ratings. That, of course, depends upon insolation and such. I also don’t have the time right now to go through and do that.
Surely the panels are quite warm, so much so that here in Boston we don’t worry about snowcover on them.
Mike M: Please don’t confuse interpretative futuristic vision with “magical thinking” — unless you want to describe actual historical techno/social transformations as “magical”.
Some grist for sharp pencils is pasted below. The numbers are consistent with Seba’s (and other’s) suggestion of explosive, unstoppable build-out, and consequent transformation of energy and related spheres.
It sure will be interesting to see what happens over the next 10 years!
I suggest that you prepare, as I have, to be proved wrong. No matter what, it’ll be fun.
…………….
“The mean harmonized EPBT varied from 1.0 to 4.1 years”
“The mean harmonized EROI varied from 8.7 to 34.2.”
http://www.sciencedirect.com/science/article/pii/S136403211500146X
Renewable and Sustainable Energy Reviews
Volume 47, July 2015, Pages 133-141
Energy payback time (EPBT) and energy return on energy invested (EROI) of solar photovoltaic systems: A systematic review and meta-analysis
Khagendra P. Bhandari, Jennifer M. Collier, Randy J. Ellingson, Defne S. Apul
doi:10.1016/j.rser.2015.02.057
Abstract
There is a fast growing interest in better understanding the energy performance of PV technologies as evidenced by a large number of recent studies published on this topic. The goal of this study was to do a systematic review and a meta-analysis of the embedded energy, energy payback time (EPBT), and energy return on energy invested (EROI) metrics for the crystalline Si and thin film PV technologies published in 2000-2013. A total of 232 references were collected of which 11 and 23 passed our screening for EPBT/EROI and embedded energy analysis, respectively. Several parameters were harmonized to the following values: Performance ratio (0.75), system lifetime (30 years), insolation (1700 kWh m-2 yr-1), module efficiency (13.0% mono-Si; 12.3% poly-Si; 6.3% a:Si; 10.9% CdTe; 11.5% CIGS). The embedded energy had a more than 10-fold variation due to the variation in BOS embedded energy, geographical location and LCA data sources. The harmonization narrowed the range of the published EPBT values. The mean harmonized EPBT varied from 1.0 to 4.1 years; from lowest to highest, the module types ranked in the following order: cadmium telluride (CdTe), copper indium gallium diselenide (CIGS), amorphous silicon (a:Si), poly-crystalline silicon (poly-Si), and mono-crystalline silicon (mono-Si). The mean harmonized EROI varied from 8.7 to 34.2. Across different types of PV, the variation in embedded energy was greater than the variation in efficiency and performance ratio suggesting that the relative ranking of the EPBT of different PV technology today and in the future depends primarily on their embedded energy and not their efficiency.
Alan2102,
I am tired of searching for the “reply” tab, so I will answer by starting a new thread.
Frank: David MacKay appears to be little more than a pro-nuke activist, thinly disguised as an objective analyst. I emphasize THINLY, since his bias is obvious. He relies on numbers from back to 2005 and before, ignoring dramatic changes since then. His renewables scenarios are sophomoric and silly, probably consciously designed to disparage. Does his work have any value, anymore? I doubt it. He has his fans, among the pro-nuke hard core, but they grow fewer and less relevant by the year.
You can learn a lot about these guys by following the comments sections on cleantechnica and other blogs. Here’s a mini-critique of MacKay by David Foster:
conclusion: “…. He thus sets up RE to “fail” by dodgy assumptions and then lo, surprise, surprise there is a gap to be filled by nuclear.”
Right. Renewables set up to “fail”. I note that Foster might prepare a more systematic critique of and rebuttal to MacKay some time in the near future.
See also:
http://www.justmeans.com/blogs/no-hot-air-about-renewable-energy-while-blowing-smoke-david-mackay-plays-brutus-to-the-suns
…………………
I reserve a place for the possibility that renewable energy has some massive hidden energetic or cost or other “gotcha”, lurking in the background, which will cause everyone to suddenly — say, 5 years from now — abandon and dismiss renewables as a foolish fad, while flocking enthusiastically to nuclear. Possible, but unlikely. The tide is running in the other direction.
Also, from a planning perspective, at least in Massachusetts, the public utilities commission does not know what aggregate demand for either electricity or explosive methane are, since the companies are not required to report. They also do not know how much electrical capacity is being provided by installed solar, since there are no requirements to report residential PV generation or commercial PV generation back to them, apart from the excess generation which goes into net metering and SRECs.
alan2102
Here is one of the critiques by your commenter:
Do you want to run with this amazing analysis? Is David Foster right?
Someone so confused about absolute basics should be totally ignored. McKay explains in helpful detail on page 38 of his book the very basics behind calculating solar insolation at the ground in the UK. Solar insolation on a cloudless day at the equator is about 1,000 W/m2. Out in space it is about 1360 W/m2 but the atmosphere absorbs some solar radiation. If you are at 52’N you don’t get 1,000 W/m2. You are at an angle. Then you have clouds and so on.
I realize that the discussion in renewable energy, like climate, is mostly worked out by knowing in advance which side you are cheering for and then endorsing their comments.
But we are going for a different approach on this blog. Less cheering. More sums. More research.
With this approach you have to know what you are talking about. Or at least, when someone questions you, you have to calculate and then defend – or retract. What can we expect from you?
I look forward to your comments.
He wrote his book in 2009. I’m writing this blog in 2015 and I’m using many numbers from 2010. I try and get data as current as possible but any paper is best case from 2014, which was submitted latest in 2013, relying on numbers from the previous few years.
..I meant to include “at midday”.
Here is a graph of annual insolation in the UK from http://www.reuk.co.uk/Solar-Insolation.htm:
You can find the same data on wikipedia:
Then divide by 365 to get the value per day. Then divide by 24 to get the average per hour (and you have your value.
Science of Doom wrote: “Someone so confused about absolute basics should be totally ignored.”
Whenever I catch myself using words like “absolutely” and “totally”, I know that I have descended into hysteria (it happens, sometimes) and that I should start ignoring myself. That’s not to take anything away from noble emotion — the motive force behind all good work — only to say that when it gets out of control, it veers into hysteria.
My view of Mackay is an impression which could be wrong. We’ll see. We’ll know more in five years. I predict that Mackay and his (pro-nuke) ilk will have faded into even more obscurity by then, and that his extreme anti-renewables bias will appear laughable. I am fully prepared to be proved wrong, but not expecting it. It will be fun to see how things unfold!
@scienceofdoom,
And I am tired of trying to find a reference for the 8x-12x loss for generation/transmission that Anderson and Bows quoted. I also highly doubt that whatever I find will be accepted.
Accordingly for the purposes of this discussion, I concede your point. I therefore withdraw.
Of course, my personal behavior and pursuits will be starkly inconsistent from it, since your depiction of the question, from the perspective of the individual and, perhaps, ethically minded residence owner is markedly different.
Let’s check back in 15 years and see who was right, shall we? I’ll continue to invest according to my own determinations.
hypergeometric,
I must be misunderstanding your comment – it sounded like an insult – “no point looking up data because you’ve already made your mind up”.
In a recent textbook from a highly regarded publisher of technical textbooks: Electric Power Systems, BM Weedy et al, John Wiley & Sons (2012), the authors say:
From Combined-Cycle Gas and Steam Turbine Power Plants (3rd Edition), Rolf Kehlhofer et al, PennWell (2009):
– we see that for new large plants, CCGT are 55-60% and coal plants are in the 40% range. Smaller gas plants, e.g., open-cycle for peaking, might be 35-40%.
So in the industralized world, for conventional plants burning coal and gas, the overall efficiency from raw material in at the gate or gas in at the flange through to the electricity delivered to the consumer, is around 30-50%.
That’s from new plants.
I enjoy reading https://carboncounter.wordpress.com/ at the moment.
Marcel,
Thanks – it’s an interesting site. There’s some good data on California wind power variability.
SOD,
This is a huge undertaking. More power to ya, but whatever you learn and conclude will likely be surrounded by a thick fog of uncertainty, or at least likely will be if you don’t ignore the uncertainties you happen not to ‘like’ (which is, of course, what advocates of all stripes do). My guess is that the only analysis which really ‘matters’ in the end is the one done by people putting their own money on the table to build renewable capacity. Their verdict so far: They won’t normally invest unless there is a legally required subsidy to make the investment worthwhile.
There are developments on the horizon that could potentially drastically increase the cycle life of batteries. Battery storage becomes much less costly over time if that proves out.
DeWitt,
Can you provide a link/information on those developments? I have not seen anything very significant. You are right of course that longer life means lower cost…. you can figure the net storage cost by dividing the replacement cost for the battery by the total kilowatts stored during it’s lifetime…. the numbers I have seen are pretty high (>US$0.25 per KWH, and more typically ~US$0.50/KWH).
I don’t have any links. A fellow electrochemist was talking about it at lunch Tuesday and he was looking for better data too. I suspect it might be what Ron Graf was talking about at The Blackboard here. But he didn’t go into detail either.
There are some links here that may or may not be relevant. Details on the chemistry are lacking. A cost reduction of 85% is claimed for the new technology. The ‘standard’ A123 lithium ion battery technology is being used in Formula 1 and the Porsche WEC cars that won LeMans this year.
Battery costs are going down quite rapidly lately and improvements in chemistry/materials extends it’s durability. The two together bring down price/kWh quickly. LC-Chem’s RESU battery is rated at 6000 cycles 90% DOD and in Germany you can get these at € ~700/kWh capacity.
That gives € 0.12 per kWh
Woops, forgot that the cycles are 90%, not 100%. Compensating for that gives: € 0.13 per kWh.
ontspan
I checked the specifications and current price for the LG RESU battery. The end of life is specified at 60% of initial capacity. The lifetime is specified at 6000 cycles at 90% depth of discharge, and 10,000 cycles at 80% DOD. The available total lifetime storage capacity is much higher at 80% DOD than at 90%. That 80% DOD is applied to an ever declining maximum capacity. I can find no information about how the rate of decline changes with number of cycles. Assuming a linear decline, and limiting the DOD to 80%, the starting capacity is 4 KWH/cycle, and ending capacity (10,000 cycles) is 2.4 KWH/cycle, for an average over the battery life of 3.2 KWH per cycle; 32,000 KWH total stored over the battery life. The lifetime storage capacity at 90% DOD is ~21,000 KWH.
The current quoted price is ~4600 Euros (US$5060 at the current exchange rate), so 0.148 Euro per KWH stored over the battery lifetime (US$0.158) with an 80% DOD, and 0.219 Euro (US$0.243) with a 90% DOD; not the 0.13 Euro/KWH at 90% DOD you suggested.
Installed cost of solar panels per KWH generated per day depends on location, but in reasonably favorable (sunny) places, and assuming a 30 year panel lifetime (to 70% of initial capacity), it is in the range of US$800, or about US$0.086 per KWH over the lifetime of the panel. So if you paired 4 KW/day (starting capacity) of panels with one LG RESU battery and limited DOD to 80%, the lifetime cost of electricity generated would be about US$0.158 + US$0.086 = US$0.244 per KWH, or almost exactly twice the cost of what people actually pay for electricity in the USA (US$0.12/KWH).
From a practical standpoint, the above analysis does not consider that production and consumption vary independently (a cloudy day means not much electricity generated), so a system which “cuts the cord” to grid power probably needs ~100% extra battery capacity or more… placing the actual lifetime cost somewhere over ~US$0.40 per KWH, though you might do a little better because the bigger battery would (in theory) last longer than 10,000 cycles, due to a lower average DOD. You could modestly reduce battery size by shifting more power consumption to the period when solar power is being generated, but this may be difficult or impossible. You must also consider that some kind of emergency backup would be needed (a key system component could fail, and would take time to replace, or you might have 4 or 5 very cloudy days in a row), adding to capital investment and total lifetime cost per KWH. My SWAG is that a real-life stand alone system would probably have a lifetime cost of between US$0.40 and US$0.50 per KWH.
At present, stand-alone solar electricity remains not economically viable, except in locations where grid power is not available at all.
As DeWitt correctly notes, a grid-tied system (without batteries) with required back-feed credits is nothing more than using the grid as a battery of limitless capacity, infinite life, and zero purchase cost. It simply shifts the cost of grid distribution and grid generation capacity from some users (the relatively rich solar panel owners) to others (the relatively poorer people without solar panels). Tax subsidies for panel installation, which are common, only make the situation less fair… taxpayers funding rich people to shift their cost of electricity to others. Talk about regressive taxation…
ontspan,
Please keep in mind that the above calculations represent essentially the ‘depreciation costs’ of a solar system…. assuming you have the money in your pocket, and purchase the system on day 1. There is also “opportunity cost” of ~3% per year for the investment (you could have invested the money elsewhere), or financing cost of about ~5%+ per year if you borrow the money. These add to the true cost of the electricity a stand-alone system generates… likely somewhere between US$0.20 and US$0.40 per KWH, bringing the final cost to US$0.60 to US$0.80 per KWH. Stand-alone solar is economically crazy.
Steve,
Your comment made me think and redo the math again. It appears that our calculations differ in the residual capacity at end of life.
I’ll be only going with the 90% DOD scenario here. I think that the usual definition of ‘end of life’ after 6000 cycles is 80% of the original capacity. At least this definition is commonly used for EV batteries.
So the battery starts with 5.76 kWh capacity and ends up having 4.61 kWh capacity after 6000 cycles @ 90% DOD. Assuming linear degradation then the average capacity is: 5.18 kWh. This comes down to EUR 0.15 per kWh given the EUR 4600 system price in Germany.
Adding EUR 0.10 – 0.15 kWh for groud – rooftop solar (these are realistic system prices in Germany) then total system price comes in at ~EUR 0.30 per kWh which incidentally is also the electricity price for consumers in Germany.
Ofcourse this is the bare price without regard for cost of capital but both solar and battery cost will come down further in coming years. So when German power costs EUR 0.30/kWh to buy and FIT’s going down rapidly for new systems then self consumption of PV power is quickly becoming more economical than feeding it back into the grid.
Argh, the second paragraph got mangled up, it should read:
I think that the usual definition of ‘end of life’ is 80% of the original capacity. At least this definition is commonly used for EV batteries.
Another interesting candidate is Aquion: http://www.aquionenergy.com/
They claim 5000 cycles with virtually no drop in performance. I could not find pricing on the site, but, for what little it’s worth, I saw somewhere that they are competitive with lead-acid ($250 U.S. per kW-hr). So that works out to less than $0.05/kW-hr. That is getting into the range where opportunity cost starts to dominate.
For a reality check on what storage is worth, Ontario (Canada) has time of day pricing http://www.ontarioenergyboard.ca/OEB/Consumers/Electricity/Electricity+Prices. At present, there is a Can. $0.081 per kW-hr difference between peak and off peak. With a less political pricing system (off peak starts at 7:00 p.m.), the difference would be greater. So it may be that battery storage is reaching the point where it will make sense to install in areas with time of day pricing. That could be a huge step toward making the grid more tolerant of renewables.
The claim is indeed 5000 cycles at 100% DOD @ $200-250 kWh. At first sight this is great but there seem to be a few problems:
the chemistry appears to be really slow. They need 20 hours charge/discharge for maximum capacity and the roundtrip efficiency isn’t great either: 83%. At faster speeds capacity drops quickly.
– The volumetric/gravimetric capacity is terrible, you’d need a lot of space and a solid floor for even a small capacity (which might not be a problem per se for stationary batteries).
– Their sole UK distributor doesn’t even list the company or product on their website.
– The real purchase price (at the first link) is double the claimed price, I could not find other listings.
Hmm, this is not my day. Links are gone, here they are again:
https://www.altestore.com/store/Deep-Cycle-Batteries/Batteries-Saltwater-Technology/Aquion-Energy-S20P-Pre-wired-Battery-Stack-48V/p11629/
http://enipedia.tudelft.nl/wiki/Aquion_Saltwater_%28AHI%29_batteries
ontspan,
The battery specification sheet for a slightly larger LG model is here: (http://www.mg-solar-shop.de/media/products/111472_Datenblatt_lg_resu_6_4_de.pdf) (in German)
The initial capacity (~90% discharged) is stated at 5.76 KWH. The end of life from the specifications is 60% of initial capacity. Yes, 80% is the more common end of life figure, but they use 60%. The specs say 60% at 6,000 cycles for 90% DOD, and 60% at 10,000 cycles for 80% DOD. So this battery would have a useful capacity starting at 5.76 KWH and dropping over 6,000 cycles (90% DOD) to 0.6*6.4 = 3.84 KWH, or a lifetime average of about 4.8 KWH per cycle, and a total of 6000 * 4.8 = 28,800 KWH. The cost is 4600 Euros, so a net cost of 0.1597 Euros per KWH stored.
At 80% DOD, the power stored per cycle starts at 0.8 * 6.4 = 5.12 KWH and falls gradually to 0.8*0.6*6.4 = 3.072 KWH, for an average of 4.096 KWH, and 40,960 KWH over 10,000 cycles. The cost in this case is 0.1123 Euros per KWH.
But as I noted, disconnected from the grid, you need a at least 50% more battery capacity (and probably 100% more) so the above costs are much lower than the true costs for a practical system.
By the way, the high German electrical costs are wildly out of line with the cost to produce grid power.
ontspan,
Thanks for the links. It may be that the price I saw was a target for when production ramps up. My impression is that they are mostly selling to demo projects, OEM’s interested in testing, and very early adapters. Of course, if they can’t drop the price, production might never ramp up.
I think the 83% round trip efficiency is about normal for batteries. A 20 hour combined charge-discharge time would seem reasonable, but 20 hours each way, which is what it seems to be, does look like a problem.
The size is bad compared to Li-ion, but not so much compared to Pb-acid. I would think that for stationary storage the safety of Aquion would outweigh the size.
Economical electrochemical storage is not here yet, but it looks like enough is happening that it might not be far away.
Looks like I need to do an article on residential solar storage so we can run a few numbers.
I’ve written specification sheets / datasheets for a number of companies in a few technical industries. I’ve studied competitor datasheets and product manuals. (Never batteries). It’s always a game.
I downloaded their spec sheets – “S20-P08F Battery Stack” & “M100-LS82P Battery Module” and none of it is guaranteed. “Performance characteristics based on testing conducted by Aquion Energy. Performance may vary depending on use, conditions, and application.”
There is no temperature dependence for the performance or the life. If you stick it in your roof or some enclosure outside you might have a problem in some locations because it is only rated for -5’C to 40’C. If you keep it inside those parameters but not at a comfortable 25’C where they did their continuous testing of their best battery under the friendliest charge/discharge cycles you will find that the changing temperature causes deterioration.
It might be the leading battery in the field. I’m not trying to knock it. But “buyer beware”. If someone has had:
– 10 in the field
– ranging from -5’C to 40’C with typical diurnal and seasonal temperature variations (i.e. not sitting inside your temperature controlled living room)
– variety of charge/discharge cycles (you want to sell energy when the price is good and you don’t need the energy and often you want to use it when it’s half charged).
– and got those results then that’s a different story.
If the battery was a fraction of the price of the installed solar panel that would be different. But from what I understand from the comments it’s a significant price so the cost over 10 years might be twice what you expect from the “best numbers”.
Probably some battery experts can comment.
I messed up in my last comment, where I wrote:
“So this battery would have a useful capacity starting at 5.76 KWH and dropping over 6,000 cycles (90% DOD) to 0.6*6.4 = 3.84 KWH, or a lifetime average of about 4.8 KWH per cycle, and a total of 6000 * 4.8 = 28,800 KWH. The cost is 4600 Euros, so a net cost of 0.1597 Euros per KWH stored.”
That should have been: 0.6*0.9*6.4 = 3.54 KWH per cycle at end of life. This makes the average capacity over the battery’s life ~4.65 KWH per cycle, and 27,900 KWH stored over 6000 cycles. The net storage cost is then 4600/27900 = 0.165 Euros per KWH stored.
SoD,
The solar panels are the appetizer, the batteries are the main course, everything else is the dessert. What makes distributed solar economically impractical is the batteries: they dominate total cost, both initial and continuing.
stevefitzpatrick,
You wrote: “What makes distributed solar economically impractical is the batteries: they dominate total cost, both initial and continuing.”
I think you have made a convincing case for that if you mean standalone systems disconnected from the grid. But it is far from clear if that applies to distributed solar connected to the grid. In that case the required storage capacity, and cost, is greatly reduced. Storage at $0.05 to $0.10 per kW-hr may well be doable in the near future and could greatly alter the economics of grid-connected solar as more than a bit player.
I eagerly anticipate SOD’s future articles.
The grid doesn’t store power, with the rare exception of pumped storage facilities, unless you mean that the power companies would invest in bulk storage capacity. But in that case the individual with the rooftop panel would have to pay the power company to store his excess solar generated power plus standard rates for any additional power from the grid.
That’s not how it works now. It’s exactly the opposite. The power company pays the individual. I don’t see that proper expense accounting will replace this ratepayer wealth transfer ripoff any time in the foreseeable future. The outcry from the greens and the solar energy businesses would be deafening. More likely, it will be expanded.
We can’t even get rid of the stupid ethanol mandate. In fact, there’s a lot of pressure to force E15 down out throats because there’s more ethanol being produced under subsidy than can be used for E10.
DeWitt Payne,
Change is indeed hard, but not impossible. Ontario has time-of-day pricing. New Zealand has an even more market oriented system (see the links in Phil Scadden’s comment, the first on this article). With such systems, storage decouples from solar or from generation in general. When the price of electricity is low, the user (homeowner, factory owner, etc.) charges his batteries with power from the grid. When the price is high, the user gets power from from his batteries rather than the grid. Establish a market with price signalling and when storage gets cheap enough, storage will happen, to very nearly the exact extent that is economically justified. And price swings on the grid will match the price of storage. The market is a marvelous, though imperfect, thing.
DeWitt,
If battery storage cost actually did drop to under 0.08 per KWH, then the utilities would buy them to substitute for expensive load following capacity. I’m not going to hold my breath waiting. There does appear to have been some progress relative to lead-acid batteries, but how much is less than clear. Spec sheets are one thing, guarantees of actual performance are another.
If storage did drop that much, then lots of (isolated) places could immediately use solar or wind at lower cost that their existing generation (often medium size diesels). Once again, I’m not holding my breath.
BTW, there are a lot of people doing many different kinds of experiments with energy storage. There’s a list:
https://en.wikipedia.org/wiki/List_of_energy_storage_projects
I think the 10GW for Sizewell B is probably a typo. But seeing as you’re talking about the claims of wind turbine advocates, an order of magnitude here or there is par for the course 🙂
I second the usefulness of the Carbon Counter blog – a great deal of unfettered data can be found there.
I just looked. Sizewell B is 1.198GW, not 10.
Anteros, thanks – a typo – I fixed it.
This is a huge topic. You’ve hit on most of the salient points, but many of them are worthy of book-length treatment in their own right, can calculating the numbers associated with them is a non-trivial exercise.
There are a few other points to consider.
1. Transmission cost. The best utility-scale wind and solar resources are located at a considerable distance from the large load centers. This requires additional new transmission to be built, which in turn must go through a lengthy regulatory exercise to determine who should bear the cost (developers? Ratepayers? Taxpayers? In whose jurisdiction, if the project crosses political boundaries, utility boundaries or regional grid operator boundaries?) The environmental studies alone for a major T-line require years to complete. The permitting process is seemingly endless. The cost of constructing the line itself is only one item in a long list, and not necessarily the majority of the cost. And if you’re half-way into construction and discover 2 specimens of an endangered species of newt within a mile of one of your towers, well, god help you.
2. Subsidies. Federal and state subsidies, primarily in the form of tax credits, remain drivers of these projects. Wind projects die when the tax credits dry up, and get renewed when the credits get renewed. This alone makes a statement about the standalone economic viability of a large wind farm.
3. Backup power alone doesn’t quite cover the issue of reliability. There are serious concerns about grid stability in a situation where intermittent, highly variable, non-dispatchable generation sources make up a significant % of the supply. There are ways to address the issue (point-source grid support in the form of peaker plants or utility-scale storage, for example) but of course these aren’t cheap.
4. Solar plant performance deteriorates over time, typically 1% annually. Most comparisons against conventional plants do not factor this drop in performance.
Typically, none of these costs are considered when attempting to compare the LCOE (Levelized Cost of Energy) across sources (except perhaps #4, if the LCOE request comes from the off-taker). LCOE is a more-or-less standard way of determining lifecycle cost of energy but is limited to estimated capital, operating and fuel costs of specific plants. Each of these variables, of course, is subject to greater or lesser degrees of uncertainty which changes over the lifetime of the project.
I had a 30 year career in the energy business, ending as a Sr VP with one of the world’s largest engineering / construction firms. So I have some modest background, though I don’t consider myself an expert.
Judith Curry’s site recently hosted some data-rich posts on the costs of renewable energy. They make for good reading. They’re easily found in the Energy Category Archive.
SOD: I have David McKay’s “Sustainable Energy without the Hot Air”, which is also available for free online. It is very good about the basics and technical practicality and impracticality of renewable energy – but less candid about price and reliability. He is an academic physicist who spent 5 years chief science advisor to the British Dept of Energy and Climate Change,
http://www.withouthotair.com
Some favorite passages:
“The unit of energy I have chosen is the kilowatt-hour (kWh). This
quantity is called “one unit” on electricity bills, and it costs a domestic user
about 10p in the UK in 2008. As we’ll see, most individual daily choices
involve amounts of energy equal to small numbers of kilowatt-hours.
When we discuss powers (rates at which we use or produce energy),
the main unit will be the kilowatt-hour per day (kWh/d). We’ll also occa-
sionally use the watt (40 W ≈ 1kWh/d) and the kilowatt (1 kW = 1000 W
= 24 kWh/d), as I’ll explain below. The kilowatt-hour per day is a nice
human-sized unit: most personal energy-guzzling activities guzzle at a
rate of a small number of kilowatt-hours per day. For example, one 40 W
lightbulb, kept switched on all the time, uses one kilowatt-hour per day.”
“One kilowatt-hour per day is roughly the power you could get from
one human servant. The number of kilowatt-hours per day you use is thus
the effective number of servants you have working for you.”
The average Brit has 195 servants working for him around the clock – that is why energy makes modern society so affluent.
See, SoD, you venture out of the hard science into an area rife with value judgements and ideological/political beliefs. I wish you heaps of wisdom navigating these muddy waters.
Adding to your collection of datasources, here you can find external costs for various generation types in the EU.
Two questions:
1) I’m curious if you can think of a way to come up with a market model that:
a) allows generation sources with high marginal cost to survive the addition of large amounts generation capacity with very low marginal cost.
b) how a generation sources with high capital cost and very low marginal cost will be able to make a profit in a free market when they have a large market share.
2) When a market is already long established and the existing technologies have gained various benefits it is difficult for new technologies to enter the market without help, especially when these have welcome properties that are not priced for in the current market system while initial research/development costs are high. How do you see these newcomers gaining foothold or even transition the market to these new technologies? Usually this help is in the form of subsidizing research in, or by subsidizing production from, the new technologies or by including external costs to the existing technologies.
Or in short: how do you vision allowing technologies like wind and solar to enter a market that’s already not a level playing field?
ontspan,
I have no idea about the questions you ask. Regulator / policy questions are of vague interest to me but I’m not trying to address them here.
I’m more trying to understand the current (& short term future) reality of costs and technical difficulties involved in renewable integration. It doesn’t seem like such a difficult problem because I’m not trying to figure it out from scratch. Lots of research has been done. Lots of papers written. Some textbooks.
Obviously if you rely on reading newspapers, watching the news and reading (advocacy) blogs there is an overwhelming quantity of poor quality mush. Who could figure it out from that?
It’s not where I plan to dig for data. If the data doesn’t exist because companies don’t reveal it anywhere including in their annual reports (that would be surprising) then that’s a result in itself. I’m not looking for “a number’. I’m looking for “the reasonable range”, “the uncertainty”. I’m looking for “is the $X/MWh including backup generation, connection and based on current costs” or “is this a number that someone claims will be there next year, but by the way doesn’t include backup generation or the cost of grid connection”. You get the drift.
Let me compare it to figuring out atmospheric physics. Radiative transfer is well established. You find it in textbooks – the same equations have been established for decades and verified in innumerable ways. Obviously it takes time to understand the subject (the equations, the derivation, the experimental data). Luckily it turns out that current computing power allows the average person to verify the basic results and play around with the results. That’s nice. But even without the computing power there are plenty of textbooks/papers that allow a reasonable person to confirm that the theory and experiment match up. That’s a result.
On the other hand, atmospheric circulation.. is much more difficult. The theory is sound and fundamental but can’t be solved. Greatly over-simplified parameterizations have to be used. That’s a result as well.
Lots of people spend time trying to figure out radiative transfer by reading blogs written by people who don’t understand it, commented on by people who don’t understand it. It seems impossible (to them) to really get to the bottom of it. They are looking in the wrong place..
SoD, I now see that I misunderstood a portion of your ‘Introduction’ paragraph and you are right, there’s probably as much misinformation floating around on the topic of renewables as there is about climate science. There is indeed a large body of literature and try to read a few of then every year, Google Scholar is a great service.
I’ll be reading your articles with interest (like always, thanks!).
SOD: Before intermittent renewable sources of power were connected to the grid, the major reason for reserve capacity (which is probably emitting CO2) was to meet an unexpected increase in demand (which fluctuates minute to minute and hour to hour), not an unexpected loss of generation capacity. Now unexpected loss of renewable generation is becoming the major problem. In some locations grid operators are legally required to operate the system in such a way that they will meet demand 99.7% of the time. That means that they must consider their ability to forecast renewable power generation with 99.7% reliability.
FORECASTING output poses a huge, under-publicized problem for wind, whose potential power varies with the cube of wind speed. (In Denmark, hydroelectric power from Scandinavia provides the reserve and it can be brought online within minutes.) If Britain achieves its goal of 30% power from wind and average output is 30% of nameplate capacity, then wind power will be able to meet 100% of demand on the windiest days. If forecasting with 99.7% reliability predicts wind speed within +/-20% and therefore wind output within +/-50%, a shockingly large reserve – presumably emitting CO2 – may be necessary. National Grid has posted some information online about the “Gone Green” scenario that suggests +/-50% represents their current ability to forecast wind output 4 hours in the future. This forecasting problem can be addressed in a large number of ways: 1) Offering customers large discounts if they volunteer to be disconnected from the grid during a shortage. 2) A “smart grid” that suppresses demand (by raising prices) during a shortage. 3) Back up power generation that can be brought online quickly. 4) Tolerating less reliable power. All of these solutions have costs that aren’t directly attributed to wind power itself.
Frank
I don’t think this is the case.
The availability of conventional power stations averages out at 85%, sometimes for planned outages, but also unplanned outages. Reserve capacity in countries that I know about has been made in excess of maximum demand.
Here’s The intermittency of wind, solar, and renewable electricity generators: Technical barrier or rhetorical excuse?, Benjamin K. Sovacool (2009):
It’s an interesting paper that I will highlight in a future article.
Since I mention ethanol above, an article or two about biomass would probably be appropriate for this series. If you look at the IPCC SRES data, biomass is supposed to be a large part of future energy needs.
I am concerned that focusing upon costs and statistics on intermittent renewable energy can fail to address the issues of greatest relevance, namely the cost and effectiveness of CO2 mitigation.
In the public debate between say wind and solar vs nuclear we get a continued ill disciplined commentary that avoids the important issues, namely:
1) Define your energy system. For example in South Australia current generation exists as gas powered generators ramping up and down to match a lot of wind energy. They exist in unison.
2) What are your system emissions in terms of gr CO2/kWh and how are these trending? Are they flatlining with no prospect of reaching low levels of sub 50 gr CO2/kWh?
3) What is the historic and current marginal cost of mitigating CO2?
4) I want to know about the life cycle emissions of your generators. Currently the Australian manager of the energy market AEMO reports only on Scope 1 emissions, namely the combusted fuel and does not account for emissions in construction, maintenance or decommissioning – this gives a misleading impression. We know nothing about the emissions intensity of producing solar panels and inverters r wind systems in China.
Finally I have a sense from approximate calculations that gas burning emissions intensity is not 400 gr CO2/kWh as is commonly reported but is in fact closer to 650 due to the impact of fugitive emissions. This is never accounted for in AEMO data.
I seems that wind and solar plus gas turbines will not achieve system emissions much below 400 gr CO2/kWh and that we need a different source if we are to get down to around 50 gr.
Robert,
Once someone is measured on something, their energy is often expended in finding a way to look good against that measurement.
Governments can be expected to “juke the stats”. Take it as a given. They need to get re-elected and that’s not an easy feat.
“What gets measured gets done”.. or more often, “what gets measured gets faked”.
But people also write papers to try and dig out the real data.
I have been reading a few papers about the CO2 emissions of solar panels and there’s a pretty big range. The CO2 emissions of solar panels are all upfront, vs the year by year CO2 emissions of say “already-built” CCGT.
I doubt that solar panels are really 50g of CO2 per kWh. They might not even be 100g of CO2 per kWh. Of course, on a favorable set of assumptions they can look great. Change the assumptions to some equally reasonable assumptions and the numbers can look bad.
More on GHG emissions of solar panels in due course.
You are asking the right questions. But I can’t dig all this out by myself. Please research and put forward some of the numbers.
scholar.google.com is our friend.
In the meantime, costs and statistics of intermittency is actually a very big issue. If you provide “100% renewables” someone will still be generating energy using conventional methods. How much and at what reduced efficiency? That is, “100% renewables” is very unlikely and even if you built wind turbines and solar panels to produce this nameplate value, the voters’ choice would be whether to sit in the dark with no cooking, internet or TV on calm evenings or whether to fire up the various conventional methods.
A few interesing studies about integrating a large amount of wind in the Dutch grid. They provide e.g. grid integration models and load efficiency curves of various types of conventional plants.
Click to access Ummels_20090226_1_.pdf
Click to access B.C.Ummels_Conventional_Generation_for_Balancing_6_GW.pdf
A life cycle analysis of various thin film PV techs which also lists a huge amount of other LCA studies:
http://onlinelibrary.wiley.com/doi/10.1111/j.1530-9290.2011.00423.x/full
Looks like they generally arive at around 50 gram CO2/kWh.
What many consumers want to know is simply “how much is this going to cost me?”.
At the end of this great quest for knowledge should be some semblance of an answer to this question. Beyond the myriad attempts to skillfully hide this answer by using subsides, carbon trading schemes, assumptions of miracle cost saving technology, and uncountable clever indirect taxation schemes lies some actual numbers using today’s technology.
We all know renewable energy and better batteries have been five years away for the last 40 years. Certainly progress has been made, but miracle breakthroughs are hard to find. The biggest breakthrough has been natural gas.
Citizens are going to pay for this effort through rate hikes and taxation and I would like to know how much per year this is expected to cost me. So far I cannot answer this question to even within a magnitude and it is hard to trust anyone who runs the numbers. Advocates throw in costs savings like better health outcomes of (fill in any number you want) by (cite speculative study of your choice). We’ve all seen crazy studies that conclude this transition will save us money. Just assign a social cost to carbon and money start filling up consumer bank accounts magically.
Good luck in your efforts.
Tom,
Much like electricity from thermonuclear fusion, except there the number is usually 50 years.
When states sue the EPA for neglecting to consider costs on the new power plant carbon emission rules using the mercury emission precedent, we might get some idea. I doubt that carbon emissions are going to be a fait accompli for the EPA like mercury. The costs are too high and the technology isn’t there.
Interesting plot:

So why is the wind industry in Australia complaining bitterly about a proposal to limit subsidies to five years instead of to 2031?
If wind costs only $74/MWh and receives a guaranteed $120/MWh, why do they need other subsidies at all. The answer, of course, is that the numbers don’t reflect reality. And that’s not to mention low frequency noise pollution.
About numbers not reflecting reality. Last full year (13-14) average wholesale spot price in Australia was $55.6 per MWh:
https://www.aer.gov.au/node/9756
I see recent auction PPA’s signed for various wind farms at around $80 – $90 per MWh. E.g. Hornsdale, Ararat and Coonooer Bridge:
http://www.cmd.act.gov.au/open_government/inform/act_government_media_releases/corbell/2015/wind-auction-result-delivers-renewable-energy-and-economic-benefits-to-the-act
Thank you sod for turning attention to renewables.
The questions around renewables are the most important issue for the world economy and it is disturbing they are so ignored.
[…] Renewable Energy I […]
Okay. Trying again. To explain, I tried posting some of these a day or two ago, without luck, SoD recommended trying again. I have a detailed response to parts of this posting and the next, but I’ll hereafter try to put discussion here. Sorry for the inconvenience.
One thing I wanted to note for this post was that below.
Slightly misleading given the load scale is ten times the wind and solar scale. Also, that’s July, which is best case for both wind and solar. How about December or January?
I should have probably commented that the point of the figure is that wind and solar are anti-correlated, and not anything else.
In July. I’m still asking what about the rest of the year?
For various atmospheric reasons, it’s not likely it would differ, apart from effects related to dramatic local topography, but, as you request, there’s a pretty comprehensive 2008 report, although not for California, and another for Britain, although there does appear to be regional variation. The corresponding correlation plots are here and here.
And I guess the Widen study from 2011 is considered the most definitive on this subject. It also has a useful key figure which greatly informs the work of Jacobson and colleagues at Stanford. That’s not the correlation between wind and solar spoken of above (see main text for that discussion), but this shows the spatial correlation for each energy source. Jacobson and company argue that a grid integrated large-scale build out of wind can offer continuous base load power if overbuilt and if precision day-ahead forecasting is used. There is a reference I found (can provide it, with work) which suggests that even with transmission losses over distance it is a win.
Fraunhofer ISE has a couple of energy charts:
https://energy-charts.de/index.htm
NREL has issued a new report which claims to have data showing that the capacity factor for wind energy across the United States is comparable to that of fossil fuels. Some analysis and discussion at CleanTechnica.
[…] Part I we had a brief look at the question of intermittency – renewable energy is mostly not […]
Glad to see you posting on this! A few comments from my experience (I blogged on renewables etc. off and on for about 10 years, until I didn’t have time to work on it any more):
* Actual cost data can be very hard to find – there are pricey industry reports that have the details, but it is generally not available free and open. There have been some nice “experience curve” graphs for solar panels that show broad 10-20% decline in costs for each doubling of production capacity which has continued for some time, despite some bumps in pricing due to supply/demand issues. Moore’s law was to some extent a self-fulfilling prophecy; similar projections for solar PV may be having a similar effect.
* A substantial part of costs for solar is “balance of systems” – i.e. not the panels themselves, but the installation, inverters, and other components. This is very variable from place to place, partly due to differing regulations, and hasn’t been declining as fast at least in the US. But there’s great potential for savings in this particularly with installation on an industrial scale (rather than one homeowner’s roof at a time).
* Hydro is easily dispatchable and can act as a buffer for supply variations without explicitly having a “pumped hydro” system. If you match solar and wind with a similar capacity hydroelectric source you don’t have to worry about storage, just vary the hydro output to balance things. It doesn’t really help you get to 100% renewable except in locations where hydro is already a big part of the grid, but it’s something to bear in mind that helps.
See for example, Denmark and Norway.
[…] Renewable Energy I – Introduction […]
[…] Renewable Energy I – Introduction […]
[…] Renewable Energy I – Introduction […]
[…] Renewable Energy I – Introduction […]
[…] It’s not “dispatchable” so it doesn’t create baseload power – another way to say this is that wind power at significant grid penetrations gets very little “capacity credit” – something needs to provide power when the wind is not blowing, or not blowing much – we looked at this in IV – Wind, Forecast Horizon & Backups and in Renewable Energy I […]
[…] Renewable Energy I – Introduction […]
[…] Part I and IV – Wind, Forecast Horizon & Backups we looked at a few basics, including capacity […]
[…] Renewable Energy I – Introduction […]
Alan2102,
You wrote: “Please don’t confuse interpretative futuristic vision with “magical thinking” — unless you want to describe actual historical techno/social transformations as “magical”.”
When predictions are based on hard numbers (sharp pencil and green eye shade stuff) I respect them. When they are based on what people want to believe, it is magical thinking. When I see a phrase like “interpretative futuristic vision” I suspect the latter.
Wind and solar are extremely expensive relative to conventional power. Most of the market depends on large subsidies, both explicit and hidden. There is no prospect for that changing anytime soon, although with solar there is the possibility of a spectacular breakthrough. But even then solar will be no more than a minor player unless there is another spectacular breakthrough in storage. Those who believe in the imminence of a disruptive transition in the free market sense are engaging in magical thinking.
You wrote: “Some grist for sharp pencils is pasted below. The numbers are consistent with Seba’s (and other’s) suggestion of explosive, unstoppable build-out, and consequent transformation of energy and related spheres.”
So what? The numbers (similar to the ones SoD arrived at) only show thermodynamic consistency, not economic viability. Thermodynamic data are consistent with graphite turning spontaneously into diamond at ambient temperature and pressure. But that has never been observed to happen.
A disruptive transition only occurs when the new technology is economically superior. Digital cameras were invented in the 1960’s, but it took 40 years for them to displace film, since it took that long for the tech to get good enough, in spite of the fact that the rate of improvement of IC’s was spectacularly faster than solar or wind or batteries.
Maybe a transition to solar will eventually occur, but I am more and more inclined to think it unlikely (I used to think it inevitable). I see no way that wind can ever be more than a bit player.
I recognize that I might be wrong, unlike the advocates of solar and wind. They want us to commit to a path that could be a disaster if their wishful thinking turns out to be wrong.
Yeah, they may be more expensive, but the cost of capital is zero, since the public are paying for these.
“When predictions are based on hard numbers (sharp pencil and green eye shade stuff) I respect them. When they are based on what people want to believe, it is magical thinking.”
There are lots of things that I want to believe that actually have happened, and are now happening, and are very likely to continue happening. The dramatic drop-off of global poverty, for example. Or the dramatic drop-off of global fertility, and incremental slowing of global population growth, for another example. You think these things are “magical thinking”? At one time, not long ago, there was no basis for predicting them. And yet they happened. Same with renewables in general and solar in particular. 25 years ago, to suggest that solar PV would be in the position it is in right now — scores of GWs being installed per year — would have been laughable. And yet it happened.
For many years I have been arguing with people who have both feet in the 60s and 70s regarding population. At that time, the population explosion was in full swing and it looked for all the world like overpopulation was going to doom us all by the 80s at the latest. Then, things changed. Fertility dropped off a cliff, and population growth has been slowing markedly every year since. And yet, when I make these points, I am accused of something like “magical thinking”, or believing in what I “want to believe” in. Well, it is true to some extent: for many years I have wanted to believe, and I do now want to believe, that the population problem is solving itself. Who wouldn’t? And it so happens that it IS being solved, incrementally; this is a statistical reality. Does that make me a dreamy, deluded Pollyanna? Maybe so. Perhaps I refuse to accept the immutable laws of the Science of Doom, as they were expressed by Malthusian theorists circa 1970. Shame on me. OR, maybe it is THEY who are in the grip of what they “want to believe” about population, while REFUSING TO ACCEPT the HARD STATISTICAL REALITY of actual demographic events. And maybe the same is true of the self-styled renewables skeptics who — though they had a compelling, air-tight case in 1990 or even as late as 2000 — have been eclipsed by events, and are now in the position of believing what they “want to believe” about renewables, while refusing to accept the (new) hard statistical realities. Hmmm. That’s one to chew on.
“Wind and solar are extremely expensive relative to conventional power.”
It seems that the opposite is true. According to the IMF, fossil/conventional power sources are subsidized to the tune of 5.3 $TRILLION per year — far, far more than the piddling subsidies that renewables get. Plus, the situation for renewables gets better every year, whereas for fossil fuels it gets worse. Renewables become cheaper, with higher EROI, every year, while fossils are heading into the abyss of stranded asset-hood as big investors plan their exit strategies (or are already executing them).
“solar will be no more than a minor player unless there is another spectacular breakthrough in storage”
Why? Storage is of much less import than has been claimed, and (to the extent the issue exists) is being solved, incrementally, year by year. I don’t feel like arguing this one. You can learn about it on your own. Just read.
More likely: fossils, and maybe nuclear, will be no more than minor players, given a few more decades, unless there are spectacular breakthroughs in safety, clean-ness and externalities in general (i.e. true costs), as well as enormous changes in popular sentiment and general consensus.
“So what? The numbers (similar to the ones SoD arrived at) only show thermodynamic consistency, not economic viability.”
Energy payback times of 1-4 years do not indicate economic viability?! What the hell WOULD indicate economic viability? Payback in 3 months? 3 weeks?
Long energy payback times, and low EROI, were for a long time the big arguments against renewables. But in recent years the numbers have gone wildly in a positive direction, blowing those arguments out of the water. So now, it would appear that the goalposts are being moved. There is a pattern of what seems to be increasing desperation of the “skeptics”. It looks to me like the tide is rolling in, and they are struggling furiously trying to stop it. Rots of ruck with that.
The funny thing is that the case against renewables was much stronger 15-20 years ago, and yet renewables just kept marching forward. Renewables have overcome much stiffer resistance than the arguments now being marshaled against them. Is there some reason to think that renewables will just fall down, without even being tackled as before? Maybe. But I’m not seeing it.
Adding, this famous report
Click to access disruptivechallenges.pdf
from the Edison Electric Institute identified that not only will disruption happen, it is already happening, in terms of the relationship between investors in utilities and the utilities themselves.
How could renewables provide for an uninterrupted energy supply on demand without backup from fossil or nuclear?
I know the stories of magic batteries that last forever and I like science fiction up to the point it becomes science friction.
Proper use of models and stochastics:
http://arxiv.org/abs/1402.2833
Click to access HartIEEE2012.pdf
I don’t think you actually read Hart, et.al. There’s nothing in it that says that renewables can supply 100% of the electric power demand without backup from conventional, i.e. fossil/nuclear, generators or storage. Models and stochastics will help manage the grid, but they can’t generate electricity. The wind may always be blowing somewhere, but you won’t necessarily have the capacity and transmission capability where the wind is blowing to supply the entire demand for a country as large as the US.
Storage is economically still in the pie-in-the-sky stage.
And I don’t think you read Becker, Frew, Andresen, Zeyer, Schramma, Greiner, and Jacobson, which was the first reference and from 2014, not 2012. I offered Hart to back up some of the analysis done in Becker, et al. Hart is interested in emissions profiles, per http://www.sciencedirect.com/science/article/pii/S0960148111000371. The grand plan of 100% renewables is an argument that is it technically possible to do, not that the current economic structure can achieve it. The Becker, et al 2014 paper is a logical conclusion of the path that Jacobsen began with their 2009 exposition, https://web.stanford.edu/group/efmh/jacobson/Articles/I/susenergy2030.html
Hypergeometric,
From the Becker et al. paper that you have kindly linked to: “The optimal storage energy capacity shown in Fig. 7b is around two to three months of average load”. So 2000 hours times an average load of 500 GW is one trillion kWh. At $500 / kWh, that is $500 trillion. Pure fantasy.
Reference for $500/kWh? And what is NUCLEAR cost/kWh, including everything, including at-market cost for insurance borne by the U.S. taxpayer?
And to reiterate: Electricity generation currently only accounts for 32% of CO2 emissions. Electric ground surface transportation will require a huge increase in carbon free generating capacity. Good luck with that.
hypergeometric,
“Reference for $500/kWh?”
“And what is NUCLEAR cost/kWh, including everything, including at-market cost for insurance borne by the U.S. taxpayer?”
The Vogtle plants being built by Georgia Power are at about $16 billion (http://www.powermag.com/even-more-delays-and-cost-overruns-for-vogtle-expansion/ up from $14 billion when started) for 2.2 GW, so allowing for some more overruns, maybe $8000 / kW. So $4 trillion for replacing the entire U.S. generating capacity of 500 GW. Even if we double that to allow for hidden costs (unreasonably large) it is only 1.6% of the storage costs for all renewable.
Start with proper use of data.
You have to zero out all the values outside the turbine cut-in and cut-out range when using wind speed data.
Any method using “(annual) mean wind speeds” is seriously flawed by ignoring reality.
@DeWitt Payne: Ground transportation.
Self-driving electric vehicles. Once widespread, why have your EV parked at waste in the parking lot? It’s an expensive thing, after all. So, while one is at work, shop it out via Uber, as long as it comes back to pick you up after your work day. Fringe benefits? (a) Less need for parking lots. (b) Less need for cars overall. (c) Less need for public transport. (d) Safer travel per passenger: Even without self-driving, the Tesla is the safest vehicle on the road.
I can’t take credit for this: This has, as @alan2102 will tell you, also been spelt by Professor Seba.
The 800 pound gorilla is that there are too many cars, and most of the miles driven are unnecessary. Personal auto miles could be cut drastically, perhaps halved, with no loss of anything of real value or need for humans (though, granted, with a lot of temporary economic disruption). Over the long pull, with sane urban design (i.e. walkability), auto “requirements” could be reduced to perhaps 20% or 10% of the current level; of course that is looking forward a half-century or more. Short term, note that electrification will save a vast amount of energy currently being wasted by inefficient ICEs.
It is a great tragedy that China has pursued personal auto-based growth. They were on the right track for a smooth(er) transition to new energy/resource realities, but they blew it by copying idiots (i.e. us).
One bright spot is that young people are much less auto-centric than their parents, often preferring non-motorized transport, and very much preferring walkable environments. The personal auto is losing its hold on the American imagination. Sanity is breaking out! Only 40 years too late, and still too slow, but I’ll take it.
“Your comment is awaiting moderation.”
Oh, don’t worry. I’ll be gone in a couple days.
alan2102,
I don’t hold comments to approve them. WordPress does auto-moderation and is itself slightly erratic, even from my point of view. See Comments & Moderation. When I get an email that a comment is in moderation I take a look.
I hope that means you finally read the text of this article.
It’s not clear who’s correct or not, but there is a 4 orders of magnitude difference between the quoted $500/KwH and the tabulations here: http://cleantechnica.com/2015/05/09/tesla-powerwall-powerblocks-per-kwh-lifetime-prices-vs-aquion-energy-eos-energy-imergy/
Also, while billions of dollars seem large, remember that the individual residence owner may not think in terms of these efficiencies, and seek to make themselves as independent of the TOTAL IDIOCY which dominates decisions in the American energy marketplace, withdrawing themselves from the discussion and from participation. And they may well be willing to pay a high price to do that.
Of course, those who remain will need to bear the full cost. I wish them a lot of luck.
hypergeometric,
The numbers I cite from the Becker et al paper are OBVIOUSLY per kWh capacity. The prices I cite are OBVIOUSLY the same. And the link you provide clearly makes the distinction between capacity and power. So I am beginning to suspect that you are being deliberately dense.
Boels: see:
Also, we surely need more natural gas-based peakers (some of them converted from existing coal baseload crap which we need to get rid of, eventually, anyway) for the transition, next half-century or so. Plus of course pumped hydro and other gravity-based technologies will be coming along (already are), plus battery technology will improve, etc., etc. Bottom line: intermittency not a problem. Mostly a figment of pro-nuke/pro-fossil ideology-driven imaginations.
alan2102,
You talk about fantasies about possible future developments, no valid arguments given.
It seems you want to get rid of demand driven energy production
alan2102,
You wrote “Whenever I catch myself using words like “absolutely” and “totally”, I know that I have descended into hysteria”.
I submit that “whenever” is a word like “absolutely” and “totally”. You are wise to regard such words as ones that should be used with caution. But there are times when they are appropriate. SoD has used them appropriately in referring to a self proclaimed expert who can even get basic facts right.
I feel compelled to comment on this since, when it comes to calm restraint, SoD is as close to the ideal model as I have seen on the internet.
Sorry about not posting this as a reply, but I gave up trying to figure out how to do that in this case.
Alan2102,
You cited a critique of MacKay. I asked:
Your response:
a) Critique the use of the word “absolute”. Imply person using absolute has lost sight of reason.
b) No answer on solar insolation.
Unable to defend the critique by Foster, (or perhaps having no idea), but unwilling to admit your mistake.
Thanks for letting me know what we can expect.
However, as regular readers know, if people keep making confident pronouncements that are clearly flawed, and refuse to defend with actual evidence I am likely to keep pointing it out.
We are trying to have discussions based on data – “..you have to know what you are talking about. Or at least, when someone questions you, you have to calculate and then defend – or retract.”
My approach is probably a sign of hysterical behavior and an unbalanced mind.
[…] It’s quite possible that offshore wind will be much lower in 2020 than it is today. There are a lot of installation issues that might be improved with the combination of volume of installations, time on the job and engineering improvements. It’s also quite possible that offshore wind won’t be a lot lower in 2020 than it is today. (See points made in Renewable Energy I). […]
An exellent overview of energy production in differentt continents and countries from Willis Eschenbach at WUWT. From 1965 to 2017. Nice to have as a backgruond of the discussion.
Reblogged this on Climate- Science.
Lately disposal costs for old wind turbines turned out to be a huge deal.
https://www.cfact.org/2019/09/16/how-do-you-throw-away-a-dead-wind-turbine/