In The “Greenhouse” Effect Explained in Simple Terms I list, and briefly explain, the main items that create the “greenhouse” effect. I also explain why more CO2 (and other GHGs) will, all other things remaining equal, increase the surface temperature. I recommend that article as the place to go for the straightforward explanation of the “greenhouse” effect. It also highlights that the radiative balance higher up in the troposphere is the most important component of the “greenhouse” effect.
However, someone recently commented on my first Kramm & Dlugi article and said I was “plainly wrong”. Kramm & Dlugi were in complete agreement with Gerlich and Tscheuschner because they both claim the “purported greenhouse effect simply doesn’t exist in the real world”.
If it’s just about flying a flag or wearing a football jersey then I couldn’t agree more. However, science does rely on tedious detail and “facts” rather than football jerseys. As I pointed out in New Theory Proves AGW Wrong! two contradictory theories don’t add up to two theories making the same case..
In the case of the first Kramm & Dlugi article I highlighted one point only. It wasn’t their main point. It wasn’t their minor point. They weren’t even making a point of it at all.
Many people believe the “greenhouse” effect violates the second law of thermodynamics, these are herein called “the illuminati”.
Kramm & Dlugi’s equation demonstrates that the illuminati are wrong. I thought this was worth pointing out.
The “illuminati” don’t understand entropy, can’t provide an equation for entropy, or even demonstrate the flaw in the simplest example of why the greenhouse effect is not in violation of the second law of thermodynamics. Therefore, it is necessary to highlight the (published) disagreement between celebrated champions of the illuminati – even if their demonstration of the disagreement was unintentional.
Let’s take a look.
Here is the one of the most popular G&T graphics in the blogosphere:
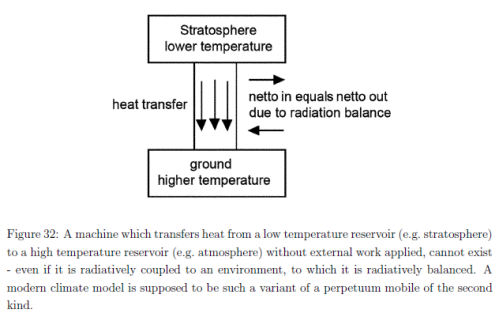
From Gerlich & Tscheuschner
Figure 1
It’s difficult to know how to criticize an imaginary diagram. We could, for example, point out that it is imaginary. But that would be picky.
We could say that no one draws this diagram in atmospheric physics. That should be sufficient. But as so many of the illuminati have learnt their application of the second law of thermodynamics to the atmosphere from this fictitious diagram I feel the need to press forward a little.
Here is an extract from a widely-used undergraduate textbook on heat transfer, with a little annotation (red & blue):
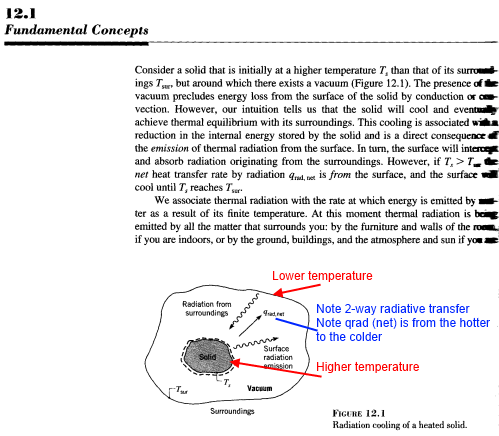
From “Fundamentals of Heat and Mass Transfer” by Incropera & DeWitt (2007)
Figure 2
This is the actual textbook, before the Gerlich manoeuvre as I would like to describe it. We can see in the diagram and in the text that radiation travels both ways and there is a net transfer which is from the hotter to the colder. The term “net” is not really capable of being confused. It means one minus the other, “x-y”. Not “x”. (For extracts from six heat transfer textbooks and their equations read Amazing Things we Find in Textbooks – The Real Second Law of Thermodynamics).
Now let’s apply the Gerlich manoeuvre (compare fig. 2):
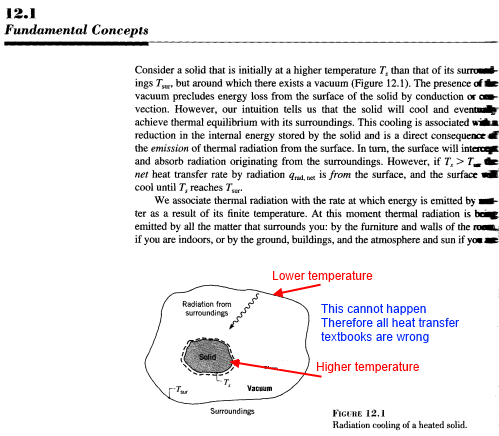
Not from “Fundamentals of Heat and Mass Transfer”, or from any textbook ever
Figure 3
So hopefully that’s clear. Proof by parody. This is “now” a perpetual motion machine and so heat transfer textbooks are wrong. All of them. Somehow.
Just for comparison, we can review the globally annually averaged values of energy transfer in the atmosphere, including radiation, from Kiehl & Trenberth (I use the 1997 version because it is so familiar even though values were updated more recently):
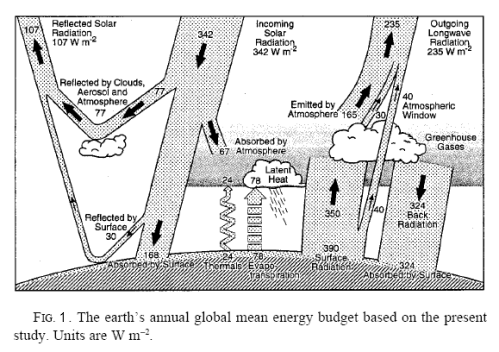
From Kiehl & Trenberth (1997)
Figure 4
It should be clear that the radiation from the hotter surface is higher than the radiation from the colder atmosphere. If anyone wants this explained, please ask.
I could apply the Gerlich manoeuvre to this diagram but they’ve already done that in their paper (as shown above in figure 1).
So lastly, we return to Kramm & Dlugi, and their “not even tiny point”, which nevertheless makes a useful point. They don’t provide a diagram, they provide an equation for energy balance at the surface – and I highlight each term in the equation to assist the less mathematically inclined:
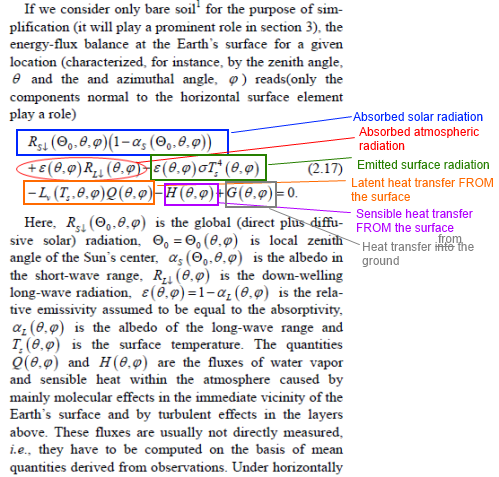
Figure 5
The equation says, the sum of all fluxes – at one point on the surface = 0. This is an application of the famous first law of thermodynamics, that is, energy cannot be created or destroyed.
The red term – absorbed atmospheric radiation – is the radiation from the colder atmosphere absorbed by the hotter surface. This is also known as “DLR” or “downward longwave radiation, and as “back-radiation”.
Now, let’s assume that the atmospheric radiation increases in intensity over a small period. What happens?
The only way this equation can continue to be true is for one or more of the last 4 terms to increase.
- The emitted surface radiation – can only increase if the surface temperature increases
- The latent heat transfer – can only increase if there is an increase in wind speed or in the humidity differential between the surface and the atmosphere just above
- The sensible heat transfer – can only increase if there is an increase in wind speed or in the temperature differential between the surface and the atmosphere just above
- The heat transfer into the ground – can only increase if the surface temperature increases or the temperature below ground spontaneously cools
So, when atmospheric radiation increases the surface temperature must increase (or amazingly the humidity differential spontaneously increases to balance, but without a surface temperature change). According to G&T and the illuminati this surface temperature increase is impossible. According to Kramm & Dlugi, this is inevitable.
I would love it for Gerlich or Tscheuschner to show up and confirm (or deny?):
- yes the atmosphere does emit thermal radiation
- yes the surface of the earth does absorb atmospheric thermal radiation
- yes this energy does not disappear (1st law of thermodynamics)
- yes this energy must increase the temperature of the earth’s surface above what it would be if this radiation did not exist (1st law of thermodynamics)
Or even, which one of the above is wrong. That would be outstanding.
Of course, I know they won’t do that – even though I’m certain they believe all of the above points. (Likewise, Kramm & Dlugi won’t answer the question I have posed of them).
Well, we all know why
Hopefully, the illuminati can contact Kramm & Dlugi and explain to them where they went wrong. I have my doubts that any of the illuminati have grasped the first law of thermodynamics or the equation for temperature change and heat capacity, but who could say.


SoD
Net heat flow implies a two way flow of heat.
But every physics textbook in the planet agrees with Claudius that spontaneous heat transfer cannot happen from colder to warmer objects.
In the case of a purely radioactive transfer.
The hot object emits far more energy than it absorbs.
The cold object absorbs more energy than it emits
There is a net transfer of energy from hot to cold.
This net transfer of energy is called heat.
Heat has the capacity to do work that is be transformed into non thermal energy or increase the internal energy of an object.
Heat is not electromagnetic radiation.
I have suggested in the past that to help you understand the physics behind the second law you should study the Carnot cycle but I fear that my advice has been ignored.
For simplicity sake lets say that the hotter object has no power source.
Then the presence of a colder object will not alter the fact that the hotter will be continuously losing internal energy as its temperature drops.
If there is a colder radiating object nearby then the loss of internal energy will be reduced but not reversed.
What we are describing is an insulating effect.
The colder object is not a new power source it merely reduces the heat loss from the warmer object.
Bryan,
This is correct.
And if the colder object (“the atmosphere”) reduces heat loss from the warmer object (“the surface”) then what happens to the surface?
a) Does it “heat up” compared with the case without “the atmosphere”?
b) Or does “the temperature of the surface” increase, compared with the case “without the atmosphere”?
c) is a=b? if a ≠ b what is the actual difference between a & b?
And if the hotter object (“the surface”) does have a power source (“the sun”), then all of the above points are still correct.
And if the temperature of the surface “just increases compared with the case without the atmosphere” in the presence of the colder atmosphere what can we conclude about the “greenhouse” effect?
It is real and it is not a violation of the second law of thermodynamics.
Alright then.
As already stated in 20 articles, I am with Kramm & Dlugi on this one.
G&T with their fictitious diagram have instead provided a fabulous data source for the field of experimental psychology. Were you part of the experiment?
SoD I said;
“For simplicity sake lets say that the hotter object has no power source.”
This would be equivalent to night time conditions and its always a good idea to deal with simple cases first.
During day time conditions the atmosphere may act as an insulator stopping illuminated surfaces reaching higher temperatures.
But that is a whole new topic.
Bryan,
As I have argued on this before, I make my point also clear on your latest post.
1) What you say about physics is correct. There’s nothing in the standard understanding of atmospheric physics that contradicts that.
2) No-one can prevent the use of the word heat in ways that deviate from the strictly defined and very limited meaning it has in Classical Thermodynamics. As such use takes place all the time, the only reasonable choice is to accept the fact and stop arguing that such use is wrong. More specifically such a use does not make an otherwise correct argument wrong. Words have the meaning users of the language give them. Heat is a commonly used word and it has many related but somewhat different meanings. All meanings that are in common use are correct. In some cases it’s important to stick to a specific definitions, but it’s wrong to insist on that more generally.
3) It’s very useful in practice to separate the two components of radiative energy transfer. Doing the separation makes many calculations much easier, as that allows for calculating the total emission and absorption of a body without the need of keeping track of the other end of the energy transfer for every photon separately. It’s possible to use only the expression radiative energy transfer, but the alternative expression radiative heat transfer does not lead to confusion and is totally acceptable even, when the components of opposite direction are discussed separately.
4) Carnot cycle is important in understanding some phenomena, it has no role in the calculation of radiative energy transfer.
Pekka says
“4) Carnot cycle is important in understanding some phenomena, it has no role in the calculation of radiative energy transfer.”
The source and the sink can be radiatively connected to the heat engine.
Rodrigo Caballero includes the Carnot Cycle in his lecture notes.
Several phenomena in climate science involve the Carnot Cycle
As you know I have been trying to insist on a bit more rigor by using the correct technical thermodynamics terms and since this is a science blog its surely no bad thing.
A bit more rigor. Excellent.
So you can start by confirming a few points long awaited by readers of this blog:
– The equation for temperature change
– The equation for energy balance in a body
Specifically, if a hotter body of heat capacity, 1 J/K emits 5J and absorbs 3J from a colder body is the change in temperature -5K or -2K?
And if the colder body increases in temperature so that the hotter body absorbs 4J from it (vs 3J), is the increase in temperature 1K or 0K because this 1K temperature change would be prohibited by the 2nd law of thermodynamics?
And if 1K – what the &$^% have you been going on about for the last 4 years.
And if 0K – what happened to that extra 1J of energy?
Waiting.. waiting..
SoD you say
“Specifically, if a hotter body of heat capacity, 1 J/K emits 5J and absorbs 3J from a colder body is the change in temperature -5K or -2K?”
Is this the only way that the hot body reduces its temperature?
It will radiate in all directions!
The only way I can envisage your example is if the colder object was surrounded by the warmer object and the warmer object was totally insulated on its outside surface.
Do you agree?
SoD with your ‘bare bones’ two body closed system problem.
In the absence of the colder body the hot body temperature would stay constant at (say) 300K.
With the presence of a colder body of the same heat capacity at a temperature of (say) 200K then as you suggest the hot body would lose 5J and the colder body returns 3J then the net energy change is 2J
The heat transfer is 2J
At the end of this exchange the temperature of the hotter body is now drops to 298K and the colder rises to 202K
The presence of the colder body has reduced the temperature of the hotter body .
This is in full agreement of the 1ist and 2nd LOT
I don’t think this contradicts anything I have said over the last few years.
Note that some greenhouse gas enthusiasts claim that the presence of the colder body would increase the temperature of the hotter body.
Bryan,
The presence of the colder body does most definitely rise the temperature of the hotter body, unless something warmer gets hidden behind the colder body. How can you question that?
Pekka
At SoDs request a problem with values is shown above and my interpretation of the situation used.
Without the colder body the warmer bodies temperature stays constant at 300K
With the presence of the colder body using SoD values it would drop to 298K
If left for sufficient time both bodies would end up at 250K both still radiating and exchanging equal quantities of energy but now with no further heat transfer.
Quite clearly the hotter object has lost a lot of energy all of which is gained by the colder object in raising its temperature.
Bryan,
You cannot just remove the cold body except by making the open space visible. Therefore your statement does not make sense. It’s better to avoid making such statements, and even more so when the statement has a wording very familiar from claims made by those who don’t accept standard physics.
Pekka
To answer SoDs question we require to know all possible heat transfers.
Since only two objects are given then that is what we have to deal with.
The other way its possible to interpret his question is by having the colder body surround the hotter one.
The colder one would need an outer surface that was a perfect insulator.
Then start out with hotter 300K and the colder at 200K as before.
The same results as above will be repeated.
The hotter will lose energy to the colder exactly as before.
Bryan
You can envisage the system exactly like it is drawn in figure 2 of the article.
I haven’t provided the heat capacity of the colder body so we can’t determine its new temperature.
I am focused on the specific question of the change in temperature of the hotter body.
Your answer specifically on my question is correct (note 1). As the net change (loss) in energy = 2J and the heat capacity is 1J/K the temperature change is -2K.
Note 1: This part of your statement is correct: “The heat transfer is 2J
At the end of this exchange the temperature of the hotter body is now drops to 298K..”
Case 2: Now let’s examine the same initial state for the hotter body but instead remove the presence of the colder body so that the hotter body is “exchanging energy” with deep space.
That is, remove the surrounding surface in figure 2 of the article.
Now the hotter body emits 5J and absorbs 0J from deep space.
What is the change in temperature of the hotter body in this case?
SoD’s questions were precise, and can be answered precisely. They were not set up as descriptions of any real system. They should be taken just as they were presented.
Much of the confusion in climate discussion originates from different extensions of what has been specified explicitly. Even when great care has been taken to be precise, people start to make guesses of what others have in mind and answer to those guesses without telling that they do that. Often they don’t realize that’s what they are doing.
Ah yes, the survival blanket analogy. Works well
Bryan,
The same physics that allows understanding the Carnot cycle is very important for climate science as the adiabatic lapse rate is closely related to that. Carnot cycle consists of two adiabatic and isentropic steps and two isothermal steps, the adiabatic steps are exactly the same that result in adiabatic lapse rate. Hadley cells are based on cycles that are essentially Carnot cycles, although highly non-ideal and therefore of low efficiency.
For the present discussion we need, however, only the outcome: the lapse rate. Including further details of circulation would only confuse.
What makes me dislike so much request for limiting the use of the word heat to that of Classical Thermodynamics is the fact that I have never seen any problems from more liberal use in anything related to climate science. Arguments against its use have been presented almost solely in the purpose of discrediting perfectly valid descriptions of the atmosphere, mostly as part of erroneous claims related to the Second Law.
SoD and Pekka
I can see where the questions are leading.
I view the radiation from the cold as often originating from the hotter object as a kind of radiative insulation.
So radiative transfer, conductive transfer and convective transfer have much in common.
The atmosphere can then be viewed as a passive blanket.
The hotter objects temperature will never increased beyond its original value but will decrease more slowly with more insulation than without.
Now how effective the insulating layer is and the many varied problems associated with these three methods not to mention latent heat and mass transfer in the atmosphere brings us round to the current dispute.
How much effect does increasing the CO2 atmospheric content have on global temperatures?
As I read it G&T are influenced by the work of Schack.
Page 71
Note here in passing that G&T obviously agree that at the temperature of furnaces the effect of radiating CO2 is significant but negligible at atmospheric temperatures.
So radiation is absorbed but does this give rise to a significant effect.
So all the comedians who read this paper and concluded that G&T were saying that radiation cannot move in the direction of a hotter object have a problem with reading.
Next we would look for evidence of a greenhouse effect and here again G&T opt for R W Wood.
As far as I know his experimental evidence has not been conclusively falsified.
Click to access 0707.1161.pdf
Bryan,
It’s time for you as well to forget G&T. It’s so full of wrong or confusing statements.
Take the reference to the work of Schack. That chapter contains the following sentence:
Here again they call correct physics absurd. That tells, how totally confused their paper is.
It was a plan so cunning you could put a tail on it and call it a weasel. Get you to answer specific very very simple questions to demonstrate very very basic physics. How did you figure it out so quickly?
As a leading light of the illuminati it is wonderful to see you “taking the fifth“.
Unfortunately, you took the fifth just a tad late. Usually, when asked whether the energy from the colder body is absorbed by the warmer body and thus changes its temperature, you start blathering on about Carnot cycles.
This time you answered that part first and then “took the fifth” on the wrong question.
The question you haven’t answered is:
I don’t think there can be any doubt by anyone that in case 2 the temperature change is -5K. And from your suggested starting temperature, which I am happy to run with, the final temperature is 295K.
So case 2 with no cold body, the warmer body temperature = 295K, and in case 1, with a cold body present, the warmer body temperature = 298K.
So the cold body has “increased the temperature of the hotter body” compared with the case when the cold body is not present.
Can we perhaps say that in case 1 compared with case 2, the body in question is “hotter”?
Or should we instead say that it is at a “higher temperature” due to the colder body but “not hotter” due to the colder body because that would be a violation of the second law of thermodynamics? I’m not sure what the right wording is here..
I suggest you continue to take the fifth, along with Gerlich & Tscheuschner and Kramm & Dlugi.
Bryan, I feel it’s only fair to warn you ahead of time about the continuation of my cunning plan.
You might realize that in both cases (above) the warmer body has ended up at a lower temperature than its starting point and so foolishly decide to agree to all points so far. But I have a super-cunning next step in my master plan.
In this proposed next step I will introduce a constant heating rate into the hot body from inside (like say solar heating of a planetary surface through a transparent atmosphere, but I won’t call it that so as not to give the game away).
And then a cooling rate from the hot body based on its temperature to deep space.
From that, we will work out the equilibrium temperature of the hot body.
And then.. add a colder body between deep space and the hot body (like say an atmosphere above a planetary surface but I won’t call it that so as not to give the game away) and take account of the radiation absorbed from the colder body by the hot body, and vice versa (exhibit “July 20, 2014 at 2:49 pm”, your Honor) and find..
..with amazingly complicated equations like:
“energy in” – “energy out” = “increase in energy”, and
“increase in temperature” = “increase in energy” / “heat capacity”
..that the new equilibrium surface temperature of hot body has increased. As some might say, the hot body is “hotter” than it was before.
Best for you to continue “taking the fifth”..
Exactly. If you know about atoms, you need to modify your understanding of energy flows.
Hi guys,
once again the same discussion on an old face.
May I should rephrase the central questions once more:
What else other than the DLR could warm the earth’s surface up to an average of about +15 ° C?
Which energy or radiation flux in the diagrams known are so grossly incorrect?
Are the claimed 162W / m² absorbed solar radiation by the surface totally wrong?
Is there significantly more solar radiation absorbed?
Is there any alternative explanation for the measured mean temperature?
Bryan?
Exactly….and if there was another explanation….why would that not violate the 2nd law of thermodynamics? If it could be argued that the back radiation does.
+1 for both above. Despite years of argument no one has presented a credible alternative.
Pekka
Same quote but with block capitals for heat.
.” He did not get the absurd idea to HEAT the radiating warmer ground with
the radiation absorbed and re-radiated by the gas.”
This comment is correct in the technical language of physics.
SoD,
I am very surprised you get involved in this kind of nonsense. There are lots of reasons to doubt that climate sensitivity is high. There zero reasons to doubt radiative transfer is accurate. Honestly, why do you engage people who understand nothing, but believe they understand everything?
Interesting question. Why do we choose to do the things that we do?
I engage Bryan and the illuminati not because I expect Bryan to change his mind. That’s a ridiculous idea.
But I believe there are many people who have genuine questions and are easily taken in by flawed arguments. My objective in debating with the non-physics fringe is only to help the (usually silent) ones with questions.
Who knows if I have made a useful contribution in that area.
As you say there are many more constructive questions to ask but it’s good to sharpen the mind by finding and writing about the flaws in papers by apparently well-educated professors. Given that I was wading through the turgid volumes of chapter 9 & 10 of AR5 at the time of thinking about this article, it was a pleasant diversion. I still struggle to understand what the IPCC believes about ensembles of climate models and the reasoning behind the high confidence of anthropogenic climate change attribution after 200 pages.
SoD
Certainly if there was a prize for sneering and empty rhetoric it would be a close run thing between youself and stevefitzpatrick
you are right and you do a great job. Many questions can be found answered at this blog pages. Thank you for this work, SOD!
Plus, when I think about it some more, it is very entertaining.
Asking people to provide a simple formula and watching them never provide one. They are caught on the horns of dilemma. If they don’t provide one it shows they probably don’t understand the basic physics they claim to have mastered. If they were to provide one it would have to be either the one in textbooks that instantly proves them wrong, or an invented one..
Asking people to explain how the earth’s emissivity can average 0.7 when the oceans cover more than 70% of the surface and have an emissivity of around 0.96. The only reason they have decided the earth’s emissivity must be so low is because it has finally dawned on them it is the only way to “make the greenhouse effect go away” (actually it wouldn’t anyway) and they’ve spent the last few years telling everyone the greenhouse effect is rubbish because they never understand even the most basic idea behind it..
Life is full of rich irony. And it’s a beautiful thing.
“We could, for example, point out that it is imaginary. But that would be picky.”
It’s not every science blog that gets you to laugh. I hope you’re a teacher: your classes would be fun and instructive.
SoD you will need to tone down your manic rhetoric if the climate fails to live up to the predictions of your greenhouse conjecture.
As seems to be happening………
http://hockeyschtick.blogspot.co.uk/2014/07/new-paper-unexpectedly-finds-diverging.html.
What was it Feynman said about nice theories and reality?
Nice theories?
The first law of thermodynamics: Energy in – energy out = ΔQ ?
where ΔQ = change in internal energy
Or the formula for change in temperature: ΔT = ΔQ/Cp?
where Cp = heat capacity of a body
I think they are pretty well established.
SoD
Its the greenhouse theory that has no theoretical and apparently no experimental support.
As if you didnt know.
KR perhaps thinks you will need your patience to cope with the disappointing climate failing to match up with your predictions.
Bryan,
I have made no predictions about climate.
Bryan,
you annoy!
If you think the IR radiation flux of greenhouse gases is only towards the universe, then that’s your problem and it is enough if you’re looking to paint your problems for the hundredth times repeated.
I believe that there is a perpetual motion machine – in that Bryan’s denial of basic physics appears to never end…
Bryan, you are simply wrong. And attempting to keep redefining terms so that in some fashion the ‘newspeak’ makes you correct just emphasizes _how_ wrong you are.
SoD – you have more patience than I can imagine.
An interesting point is that at the surface, the effective distance that photon on line center of a greenhouse gas molecule can travel is so small, that that energy can simply return to the surface via turbulent flow rather than emission.
I was really surprised to see this topic raised again. I didnt think there would me many physicists who believed that the 2nd law of thermodynamics was violated by back radiation. I have recently written a simple straightforward blog on this thinking this claim was well dead. I really see that as a simple confusion of macroscopic net flow of energy with the random emission of photons that increases with temperature as in the Stefan-Boltzmann equation.http://thermodynamicsandgreenhousegases.blogspot.co.uk/2014/07/violation-of-second-law-of.html
Bryan,
Your problem seems to be that you think that radiant flux is 100% heat (in the classical sense) flow. It isn’t. It would only be 100% heat flow if the absorbing surface was at absolute zero. That is, there was no incoming radiant flux. There is zero heat flow in radiation exchanged between objects at the same temperature by definition. For black body radiation, the heat flow between two objects at different temperatures is, ignoring view factors and emissivities, proportional to T1^4-T2^4. In principle this is no different than the fact that a Carnot cycle cannot be 100% efficient unless the low temperature sink is at absolute zero.
Going back to basics gets rid of a lot of problems.
(1) The Greenhouse Effect is the mechanism which explains why Earth doesn’t lose all it’s heat overnight (which the other planets do)
(2) Back-radiation is a useful term comprising the amount of heat which isn’t lost to space due the Greenhouse Effect
Folk can argue about the details of GHE, but they can’t provide an alternative, then is a no-goer.
SoD, do you think you could give me a simple explanation for part of your Figure 4., the one derived from Kiehl & Trenberth (1997)?
Why is the IR flux from the atmosphere asymmetric so that 324 W/m2 goes downward and 235 W/m2 goes outward?
DocMartyn,
The DLR – the atmospheric radiation measured at the surface, also known as “back radiation” – is mostly emitted from the lower part of the troposphere which is much warmer.
The TOA contribution from the atmosphere (less than 235, as 235 is the total including the surface radiation not absorbed by the atmosphere) is emitted more from higher up in the troposphere, which is colder.
The complete picture is complicated because the “absorptivity” and “emissivity” are a very strong function of wavelength.
If you take a “thin slice” of the atmosphere it emits the same flux upward and downward, because it is at one temperature.
To calculate the actual values from theory is not too complicated but it needs the HITRAN database of absorption lines (a couple of million lines, from memory) and solving the radiative transfer equations. These are the equations of absorption and emission.
Here is a calculated graphic from Visualizing Atmospheric Radiation – Part Two which shows how the upward spectrum changes as move up through the atmosphere:
Of course, theory matches measurement.
The CERES satellites (and previously ERBE) measure OLR continuously.
We have continuous measurements of DLR from around the globe – see The Amazing Case of “Back Radiation” -Part One.
SoD, I find it pretty counter intuitive as in an ‘onion-type’ model one would predict that IR going upward is going to have a longer path-length before being absorbed by water/CO2/GHG than IR going downwards as 1) the density of absorbers is less and 2) the absorption lines tighten allowing more BBR radiation bypasses the wings.
If the simulation is indeed true, then the actual downward and upward radiation is dependent on latitude, water vapor pressure and also on the where you are in the diurnal and seasonal cycles.
Pretty astonishing that the numbers for upward and downward flux can be nailed down with such precision.
DocMartyn,
IR going upwards does have a longer path length than IR going downwards. That bit of your intuition is correct. Something else must be “off” in your intuition.
This is correct. It is completely dependent on knowing the temperature profile (surface and atmospheric temperature as a function of pressure or height) and GHG concentrations (mainly water vapor) as a function of pressure or height.
Not really. Radiative transfer is an “easy” field compared with atmospheric and ocean circulation. Computationally demanding but no chaotic solutions.
This graph of 130,000 measurements vs theory is from Theory and Experiment – Atmospheric Radiation:
So about +/- 3.5 W/m2 at a single local, yes?
DocMartyn,
Most of the variability in that graph is from the CERES instrument itself. It’s likely that with a higher precision instrument, which we don’t have, that the spread in the figure would be smaller. Most of the rest of the variability is caused by not knowing the temperature and humidity profile precisely at the point of measurement.
I accept that it should be possible to calculate the emission of a cloudless sky, in all dimensions, if ones knows the temperature, pressure and composition of all points in altitude; difficult, but doable by brute force calculation based on phenomenological spectroscopy performed on control gas mixtures.
Without these things it is rather trickier, more so when one is dealing with an actual 3D dynamic atmosphere with air currents, clouds and a diurnal cycle.
If you think that the discrepancy between a model and state of the art instruments is due to the limitations of the instruments, then estimating an ‘imbalance’ between incoming and outgoing flux is rather tricky.
I would also like to see the same plot for atmospheric IR during a full diurnal cycle .
DocMartyn,
Essentially what you write is correct. What many people don’t understand about radiative transfer is it is not the radiation calculations that are questionable. There are many decades of measurements on “control gas mixtures” by spectroscopy professionals and a few decades of comparing high resolution measurements with theory in real atmospheric conditions.
The bit that causes difficulty is knowing the temperature profile and the humidity profile.
We can’t measure the imbalance between incoming and outgoing flux – well, we can, but the absolute accuracy of the instruments is less than any likely imbalance. Lack of drift and repeatability of course are more important.
There is also a bit more of a problem of measuring reflected solar radiation because of the directional component being more of an issue than with OLR.
I started to write an article about the TOA radiative balance one time but it was too boring to finish.
With CERES we now have more accurate measurements of the temperature and humidity profile. These are necessary for a calculation of radiative transfer.
There is one part of the radiation calculation which has some uncertainty and that is the continuum absorption of water vapor, which is basically a function of water vapor concentration squared but the theory is not completely understood – so there is no “first principles approach” that we have for line by line absorption – and measurements in the lab therefore are not so useful. The “lab” for doing these measurements is the atmosphere so much work has been done in this field and many spectral measurements and comparisons with theory have been aimed at quantifying water vapor continuum uncertainty.
We would need to dig into the paper a bit, possibly track back into other papers to confirm but some categories of satellite measurements are reported as averages of a location & time, which reduces the noise from an individual measurement. Some categories of measurement are reported pre-averaging which means you can have significant error on an individual measurement. General instrument theory under repeatability.
Also this particular comparison to theory is not from a “line by line” calculation.
So to return to your Figure 4, derived from Kiehl & Trenberth (1997).
SoD, you think that the annual outgoing IR is 235+/-0.5 W/m2 and to have back radiation at 324+/-0.5 W/m2 or do you think this is an attempt to mislead the level of precision of the estimated fluxes?
DocMartyn
Where did you find this level of precision? Anyone who quotes this level needs to provide additional explanation.
This is not the level of precision in KT1997. Have you read their paper?
SOD: In Figure 23 (p59), G&T show a diagram with power fluxes (like KT) and criticize it. I think Figure 23 is more relevant the Figure 32 (an obvious strawman) that you show in this post. http://arxiv.org/pdf/0707.1161.pdf
Would you care to comment on their criticism? I assume the problem is that G&T don’t recognize that the numbers are power fluxes perpendicular to the surface and that the plane parallel (approximation?) has been applied. There are obviously differences in how “point sources” (like GHGs) and “plane sources” (like blackbody radiation) are treated, but everything in climate science seems to involve plane sources.
Frank,
It’s hard to work out what they are criticizing. Their own lack of understanding of what such a diagram represents? Their laziness in not even reading the paper said diagram was extracted from? Who knows..
Well everyone know this. It’s basic physics.
For readers unfamiliar with radiative physics, the intensity is a function of wavelength. It’s an “infinitesimal portion” of the flux.
Conservation of energy applies to “energy”, i.e., flux summed (integrated) over a period of time, not to “the small portion of energy within the wavenumber portion dv” which needs to be integrated over all wavenumbers and over a period of time.
What is done? You don’t see intensity diagrams. You see flux diagrams. What are they talking about?
It would be nice to think they have some relevant point and would show up to explain it. The obvious explanation is they are having a laugh (comedy/opera) or have not read any atmospheric physics papers (lazy). A possible, but very unlikely, explanation is that there is some principle that needs to be applied that is not being applied. They should explain what it is. They haven’t explained it here.
Personally, I think they are having a laugh. at the expense of all the people taking the paper seriously while having a secondary laugh at the ruckus they are causing.
Have they read any literature? Seriously. A standard textbook on atmospheric radiative transfer will explain the plane-parallel assumption, comment on its limits and applicability and derive the formula based on its use.
Here’s a question for G&T and the illuminati: can you calculate or measure the TOA longwave flux (i.e. the upward flux from the climate system, not the reflected solar flux) ?
Do you say:
Really? Scientific misconduct because no one can measure or calculate or estimate total flux from a body.
Or does scientific misconduct mean:
It’s pretty simple.
These are globally annually averaged fluxes. The paper tells you that.
It’s not complicated. Do fluxes not exist? Is averaging a flux globally annually some kind of scientific misconduct? Can we not measure something and average it.
G&T should devote themselves to getting all books on radiative heat transfer struck off the university curriculum.
They are clearly having a laugh.
No, Eli does not think, as G&T do, that real physics requires a Feynman diagram instead of Trenberth’s sketch. If nothing else that comment shows that they are two clowns with large red noses.
SOD: I re-read “having a laugh” and agree with many of the weaknesses of the G&T paper. I had forgotten how bad some parts were.
To some extent, G&T’s paper is written like a legal brief for a judge – it discusses every possible argument and weakness hoping the judge believes one of the author’s twenty arguments, even though the author himself may not personally believe in the argument that convinced the judge. Surely no one in their right mind would believe that limited discussion of conduction is an important weakness of climate science (even though it is important near interfaces). Ethical scientists are supposed to abide by higher standards than ambulance-chasers, but that has been violated by both sides (IMO).
G&T prompts me to ask: How do we know AOGCMs aren’t perpetual motion machines? Answer: Summaries of AOGCM output like the KT diagram show heat flowing from hot to cold. My next question was: Is there anything behind G&T’s vague criticism of such diagrams? Answer (based on your reply): G&T say the values can’t be intensities, but they aren’t meant to be intensities. They are intensities integrated across all relevant wavelengths to produce power fluxes, but only after calculating the change due to absorption and emission at each wavelength separately.
DocMartyn asked: So to return to your Figure 4, derived from Kiehl & Trenberth (1997). SoD, you think that the annual outgoing IR is 235+/-0.5 W/m2 and to have back radiation at 324+/-0.5 W/m2 or do you think this is an attempt to mislead the level of precision of the estimated fluxes?
The problem with radiative transfer calculations is that the results vary with the surface and atmosphere you input into the calculation. The height (ie temperature) and possibly the nature of cloud tops is a particular problem. The Fu-Liou vs CERES fit shown above is only for clear skies. The fit for cloudy skies (more than half the atmosphere) would be significantly worse.
One of Trenberth’s papers reviewed all published observed and calculated values (and confidence intervals) for the fluxes in his model and the likely errors. His numbers come from radiative transfer calculations after fine tuning the composition of the atmosphere (within a range consistent with observations) to produce the best fit to observed TOA LWR and SWR! So you aren’t looking at calculations and observations that independently confirm each other within a few W/m2. You’re looking at a composite from various sources anchored to the TOA fluxes measured from space.
In Trenberth’s diagrams, the radiative imbalance is calculated from the rate of increase in OHC and the flux of simple heat is chosen to balance the fluxes at the surface. I remember thinking that the simple heat flux could easily be off by about 10 W/m2. Checking just now, I find that the more recent version has a simple heat flux of 17 W/m2 whereas the 1997 version shown above has 24 W/m2.
Frank,
Just to repeat a point, the fit would be significantly worse because the temperature and humidity profile can’t be determined by CERES in the presence of cloudy skies.
As KT1997 also say:
[Emphasis added].
SOD: I never meant to imply that KT or you hid the uncertainty in these fluxes. I was just noting that the diagrams I usually see can be (and appear to be by DocM) interpreted as being more definitive than they really are. A simple heat flux of 24 W/m2 has been reduced to 17 W/m2 with newer data.
And Trenberth does openly discuss tuning his clouds so his RT calculations give a better fit to TOA LWR and SWR, the most accurately measured fluxes. There is nothing wrong with this, except that many people probably assume that two independent lines of evidence led to his numbers. And I hope that you recognize I’m not challenging RT calculations themselves, just the “model” for the surface and atmosphere input into those calculations
Whenever I do read primary literature that you have discussed and find something that surprises me, I can usually go back to what you wrote and find some hint or comment that should have warned me about the surprise. It seems like you take great care in presenting information that is as accurate a possible. This is one of the reasons I trust what I read here far more than what I read anywhere else. (Elsewhere, I find that I’ve been told a biased half of the story.) When I’m surprised, other may be also, so I comment to share insights (and sometime have them corrected).
Frank,
In their comments on the Figure 23 G&T make their first serious error, when they state that the Figure represents one cornerstone of “climatologic proofs”. Neither their Figure 23 nor any of the similar figures presented others (including Trenberth) is part of any proof. Those presentations are nothing more than an overview of some fluxes presented to help getting a general picture of what’s going on. They have an educational value, but they are not part of proof of any scientific result. (This observation is relevant also for the above comments of DocMartyn).
Their points 2-4 are pure nonsense, as I would guess that no one had ever thought along those ideas before they invented them just to discredit the ideas immediately, strawmen in the extreme. Their point 1 refers to 2.1.2 and 2.1.5. Their main argument in 2.1.5 seems to be the one that refers to Poynting vectors. This is the same point you brought a couple of days ago up and whose error I explained in my answer to your comment (incoherent fields cannot be added up as fields). The other points of 2.1.2 and 2.1.5 change nothing and contradict nothing of the standard understanding.
Pekka: The most distressing thing about G&T (and Krammer?) is that they present a morass of seemingly irrelevant physics and hidden somewhere in there are a confusing or vague paragraph or two that allegedly “falsify” the GHE.
Doesn’t climate science rely on the KT energy balance diagram to demonstrate that GCMs and other models produce results with a net flux of heat from hot to cold? The KT energy balance diagram therefore demonstrates that the machinery hiding inside an AOGCM does not behave like a perpetual motion machine. If there is something seriously wrong with presenting power fluxes in this format (as G&T claim), this “cornerstone of climatologic proofs” would be missing. Like it or not, G&T obviously believe that AOGCMs are perpetual motion machines. The KT energy balance diagram – if based on reliable physic – would prove them wrong.
I don’t fully understand the purpose of the material in section 2.1.2 to 2.1.5. Can atmospheric radiation can be reduced to fluxes perpendicular to the surface for most climate science applications not involving scattering (adding a cosine term for any flux not perpendicular to the surface)? G&T’s discussion based on a more rigorous approach doesn’t appear to demonstrate fluxes give a wrong answer for the atmosphere. If two formulation of a theory give different predictions, then the discrepancy can be resolved by experiment. If they make the same predictions in this case, it doesn’t make any difference which theory you apply.
“In classical radiation theory radiation is not described by a vector field assigning to every space point a corresponding vector. Rather, with each point of space many rays are associated (Figure 3). This is in sharp contrast to the modern description of the radiation field as an electromagnetic field with the Poynting vector field as the relevant quantity [99].”
Frank,
I agree that KT energy balance diagrams explain on general level, how various flux components combine without any obvious problems with the 2nd law.
It’s common in physics that there are several equivalent formulations that are known to give the same final results. In other cases only part of the formulations lead to simple enough calculations, while others are difficult to apply to practical calculations, but believed to be equivalent without an explicit direct proof. In this case the simple approach of counting photons is the one most suitable for practical calculations. While the Feynman diagrams have no connection to the KT diagram, it’s precisely QED and Feynman diagrams that prove the argument of 2.1.5 false in theoretically most convincing way.
SoD, here is the latest Trenberth-style Earth Energy Budget;
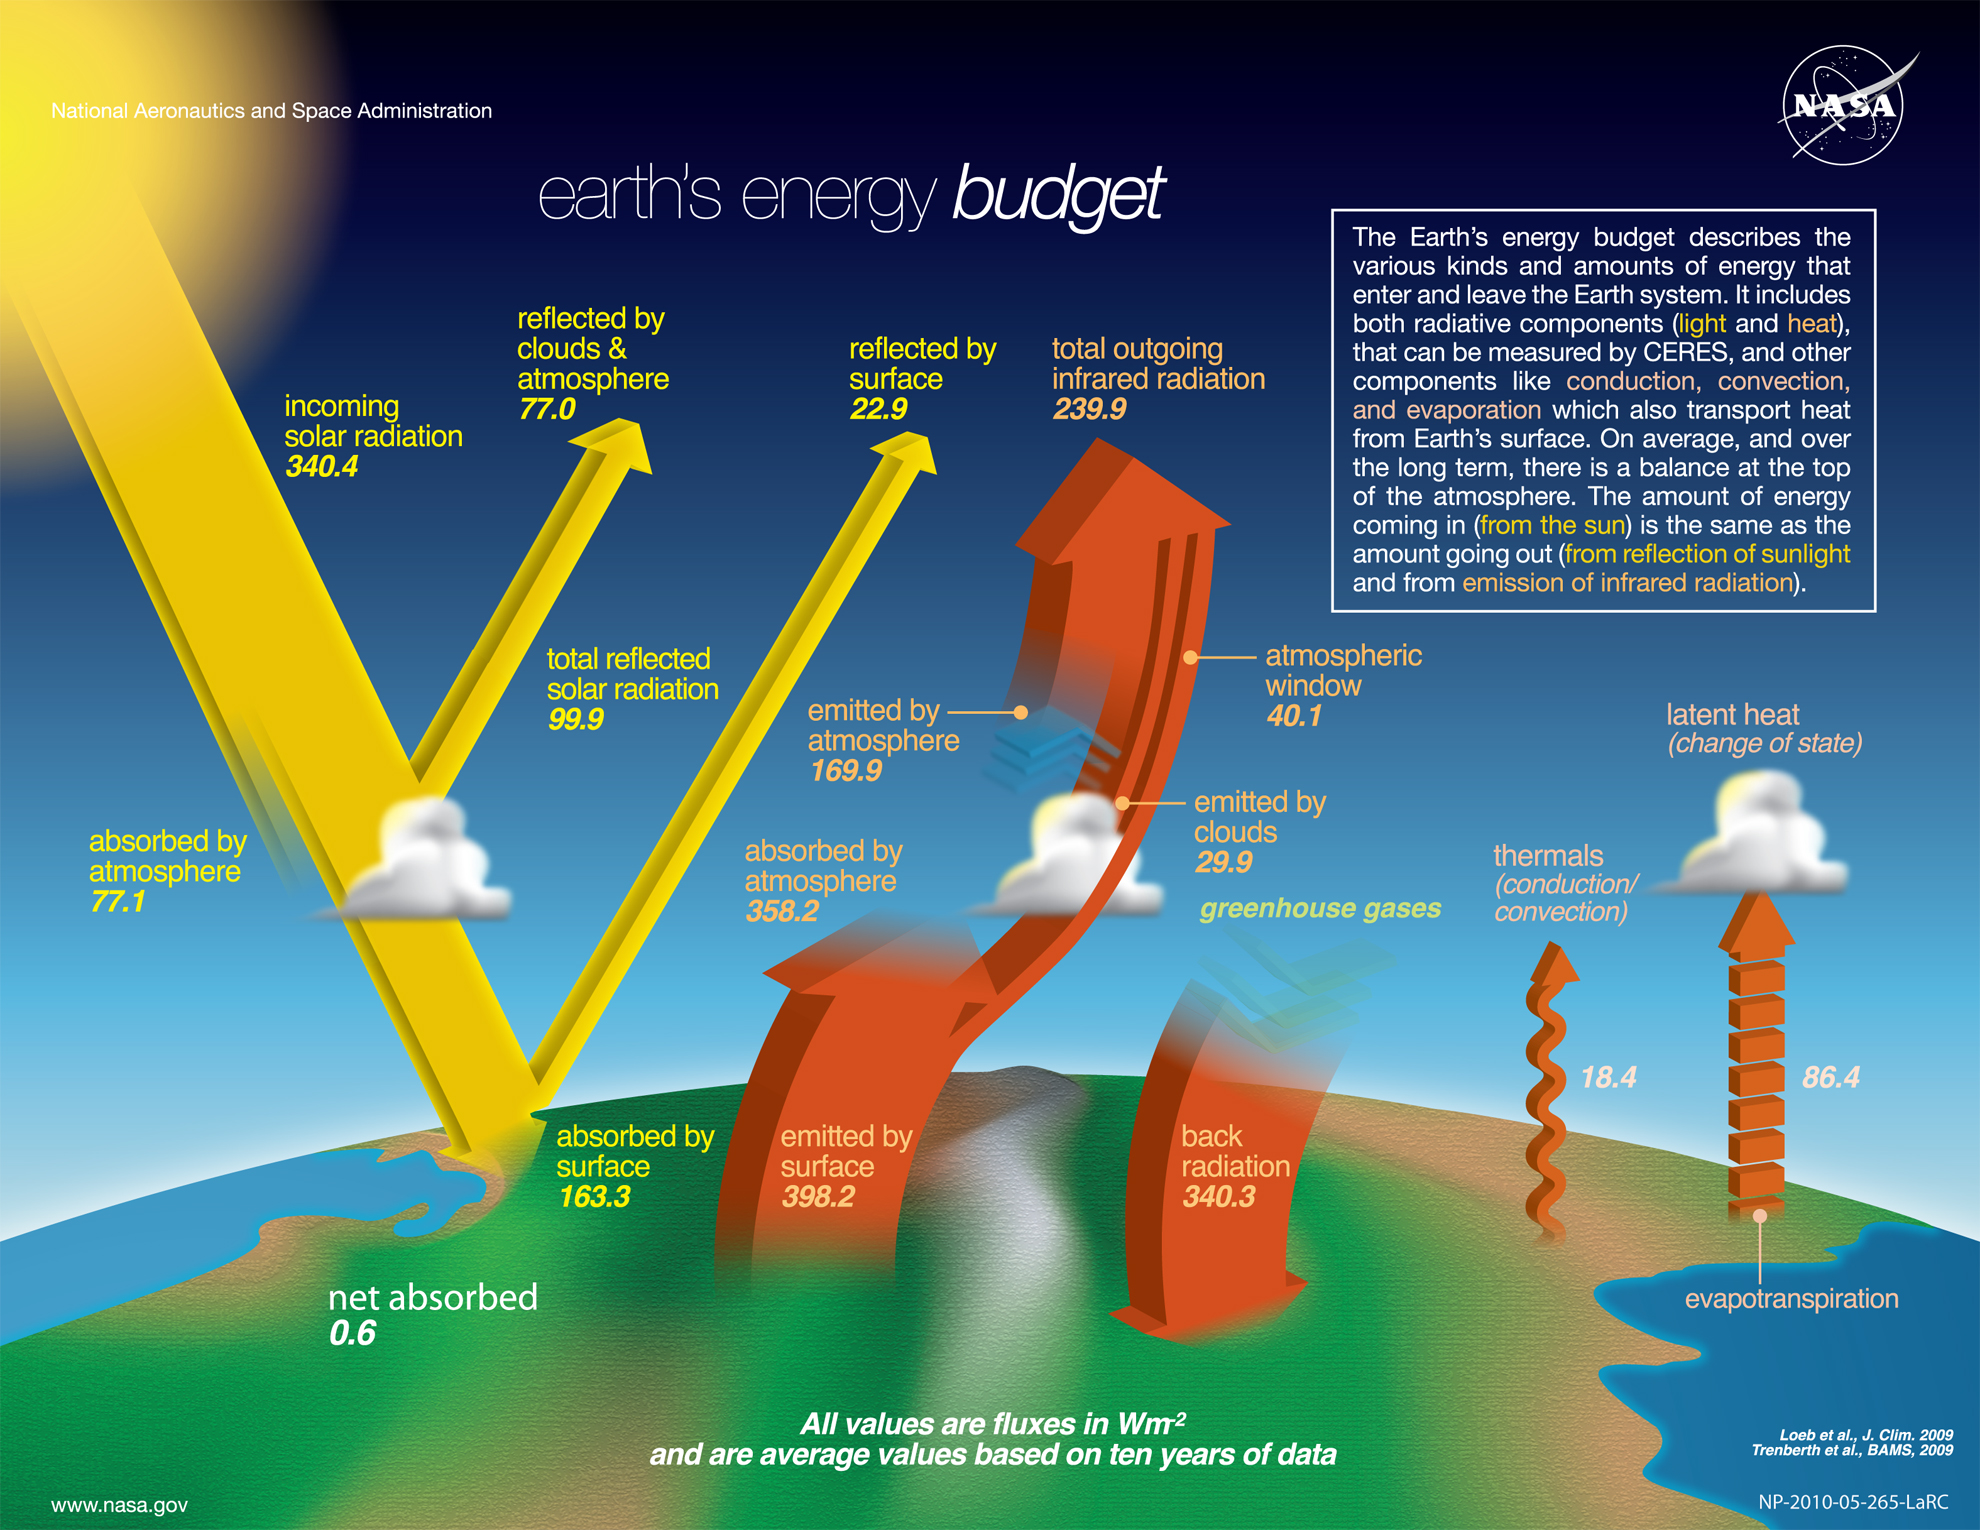
The major difference that 17 years have had is the implied 10-fold increase in accuracy of the flux measurements; from an implied +/-0.5 to +/-0.05 W/m2.
DocMartyn,
You seem to interpret the NASA figure to imply that all numbers are correct up to the last decimal shown. That’s certainly not at all the case, but some of the differences calculated from the numbers are thought to be correct more accurately than could be calculated without the first decimal.
Looking at the actual publications tells that some of the numbers may still in error by 10-20 W/m^2.
The figure should be taken as an illustrative presentation, not as a document for getting correct numbers or to learn, how well they are known.
So you not think the use of the decimal place is misleading Pekka?
Here is “Tracking Earth’s Energy” 16 APRIL 2010 VOL 328 Science
Click to access T_SciencePerspectiveApril10.pdf
They quote an imbalance of 0.9 W/m2 in Earths energy budget based on
Trenberth K E, J T Fasullo and J. Kiehl (2009), Earth’s Global Energy Budget. Bull. Amer. Meteor. Soc., 90, 311-323.
Kevin E. Trenberth, John T. Fasullo use exactly the same number and source in
“Tracking Earth’s Energy: From El Niño to Global Warming”
Surveys in Geophysics July 2012, Volume 33, Issue 3-4, pp 413-426,
http://link.springer.com/article/10.1007%2Fs10712-011-9150-2
“The TOA energy imbalance can probably be most accurately determined from climate models, and Fasullo and Trenberth (2008a) deduced the imbalance to be 0.9 W m−2, where the error bars are ±0.5 W m−2. ”
But obviously this was just a sketch and I am simpleton who is misled by the use of decimal points.
DocMartyn,
Pekka had said:
So yes, you aren’t making a whole lot of sense.
If you read the whole paper you would find out that top of atmosphere measurements aren’t accurate enough to determine whether there is an imbalance so either they are going to assume it is zero, like in KT1997, or use the value calculated somewhere else.
So yes, they cite this particular number as a decimal. Seeing as it is less than 1 they might as write down the amount it was determined to be, otherwise with the accuracy available they might write it as 0. It’s also clear this is deduced from climate models and ocean heat content. We can work this out because they explain it in the paper (relies on reading the paper). Here is one extract:
Reading more of the paper we find statements like:
How anyone can read the paper and come to the conclusion that they are claiming an accuracy of 0.05 W/m2 in all their measurements is a mystery to me.
SoD, I am sorry that I am being so understandable with regard to Trenberth-style Earth Energy Budget’s, like this one from 2011, and my reading of the text
http://link.springer.com/article/10.1007/s10712-011-9150-2/fulltext.html
So when Trenberth states;
“With the successes of CERES, variability in the net radiative incoming energy at the TOA can now be measured to within 0.1 W m−2 year−1”
I am misunderstanding the meaning of the cartoon usage of decimal points in outgoing radiation, incoming and reflected radiation.
I apologize for wasting your time.
DocMartyn,
This paper you just cited was published in 2011 and a different and later paper than the one we were discussing from 2009.
What did the authors of the paper say about CERES accuracy in 2009?
In 2011, with further work on CERES (a decade of measurements), you correctly cite the authors:
The key word is variability.
This is a different concept than absolute accuracy.
And if perhaps some researchers find a way in 2014 to confirm absolute accuracy of CERES to 0.1 Wm-2year-1 will this somehow prove your point about the 2009 paper’s use of a decimal place?
So, it seems that you are convinced that Trenberth, Fasullo & Kiehl in 2009 were misleading people by “overprecision” in numbers and your proof of this is a paper in 2011 where Trenberth & Fasullo make a statement about one measurement and its repeatability and drift, but not its absolute accuracy.
Therefore, readers of the 2009 paper will be misled?
Or are you saying they really believed all along the accuracy was to this precision and just covered it up by making all the statements (and many more) than I just quoted from the 2009 paper?
Or are you saying you don’t believe the value in 2011?
Or simply that no matter what people write in their paper about the accuracy of different measurements and estimates, when someone extracts the graphic from the paper it proves the authors of the original paper were a bunch of charlatans overplaying their knowledge of the climate system?
Or something else?
DocMartyn,
When accurate values are presented without error ranges, a misinterpretation is surely possible, but those familiar with scientific practices know that accuracies are not implied, but specified, when there’s a purpose to tell something about them.
Presenting the diagram in that form is a compromise where simplicity and uniformity of presentation is given more weight than telling more about the accuracy by including error ranges or using a variable number of decimals.
DocMartyn,
Just to comment that I agree with Pekka’s reply.
Read the actual paper.
Just the fact that the diagram is a set of averages over places with wildly varying temperatures tells a clued in bunny that Trenberth is sketching, not writing in stone.
DocMartyn,
Constructing an energy balance imposes an additional constraint on the numbers. Energy in must equal energy out. When you pick values for, say DLR and solar absorbed by the surface, then you have constrained the sum of the fluxes leaving the surface to be equal to the sum of DLR and solar. less any small imbalance absorbed by the surface. Stating the values to the nearest W/m² in this case does not imply that you know those values to that precision. That’s because any variation in one component must be balanced by opposite changes in the other components.
For example, if you reduce the direct radiation to space from the surface from 40 W/m² to 20 W/m², there must be a corresponding increase of 20 W/m² in the radiation from the atmosphere to space. The individual components can have large uncertainty, but the sum of those components cannot.
Worth recalling that doubling CO2 is modeled to DECREASE net radiance at the surface, on average:
I have a strange feeling that, at a this particular step of this kind of crazzy endless reflexion, unlike most of the time, I share the view of the vast majority of my brothers and sisters…
… And curiously, this feeling tells me two things completely different… : 1) there’s something entirely ridiculous, here, but 2) maybe not, maybe it’s very important, and maybe one of the most important thing is to seriously ask ourselves why so many people come back to what they seem to find simply ridiculous. And one target of this post is to kindly urge SoD, and all of you, to consider this paradox and think about what it could itself reveal.
Basically, each time I hear people ask the question you ask here (or each time, for example, I’ve read G&T bits about the 2nd principle, of course), my first thought is: this is just ridiculous… Everybody can understand that a pullover doesn’t heat my skin; it simply prevent its temperature from getting lower (if it’s colder outside, which is generaly the case); it’s something inside me (transforming energy I mainly get from the food I eat) that heats my skin. So we have the sun heating the surface, the (hotter) surface heating the (colder) atmosphere, and so what?
So once again, when discovering this thread, I heard me thinking loudly: “oh no, on va pas encore enculer les mouches…” And once again, my second thought was: …. wait, maybe neither G&T or whoever “illuminati” (1) nor all those people are not just that stupid.
And this time, just because I had try and sincerly admit this hypothesis, it happend that the sequence led me to two other steps, which clues I’ll let you with.
First. By extension of the second step in this curious thought experiment… I sincerly had a moment thinking that my felow PP is probably not silly at all. (I swear…) But I then I thought:
wait, but this guy exactly says, first tale a no “GHGs” condition, the surface would be at, say, -18°C, and then you switch on the “GHE”, this same surface temperature climbs to, say, +15°C. What else is it that we call “heating”? Litteraly, he seems to say that the GHE heats the ground. No?
But this time something new came to my mind, so simple I had never thought of before:
guy! We use the same word, heating (2), to describe both the “action” of transfering heat to a body and the “effect” of an temperature elevation in a body.
Then of course I came back to the pullover… (3) And this time, again, back to the sincere feeling that those guys, whoever (not to mention high level physicists), cannot just be that stupid. Then I came back to another idea, which I had of course for long:
the difference between the pullover and the GHE, is that the former I can put on and off whenever I want, the latter you’ll never put it away, and also probably you won’t even be able to test if any effect change (4) when you change the amplitude. Which led me to the second (third) clue I had also thought of before, but this time with a partly new point of view:
so many guys are so sure that G&T focused not on the real good unified theory of the GHE but only on storys for kids (and citizens, and politians), but they just don’t see that there is simply not any good real unified GHE theory, exactly for the same reason that one cannot demonstrate that ghosts doesn’ exist, and that, for that very same reason, every explicit exposé of what anybody think this this stuff is will inevitably lead them to drop the verdict of lack of proof, even “glimpses of contrary evidence” (which would always be an illusion, of course), and even to claims which are nonsense here and there.
Which is why high level physicists have no solution but the alternative between shutting their mouths and runing behind “theories” everybody will be able to say are not the real one.
And even the most brilliant among them can spend his life thinking many others, including top level physicists, are idiots, and for the same reason, go on thinking somebody on the top has a good explanation… Welcome to your new sect, my dear followers (for this first time it’s free…). Sorry it’s rude, I know… it always is.
Of course, SoD and others will try for the thousandth time to expose the theory, and of course people will have no choice but to contradict bits of that (who knows what’s the contrary of a ghost), and of course our friends will say that those bits of an error are only because it was oversimplified. Next week, a new thread, the “subject”.
(1) Beurk. I’ve been studying and fighting what some call NWO for years, so you may understand I don’t appreciate to see people using that horrible word even to describe my worst “ennemy” in a sceintific debate…
(2) In French, at least, we do: “chauffer“. But also curiously, we can add a prefix in one of those case and say “réchauffer“, but it also happen that litteraly the connotation indicates that you heat something that has cooled before, which could also be translated by the idea of “re-heating”, which means that the heat source may be the same before and after the cooling.)
(3) Only for this occasion, I’ll drop the fact that the surface is one thing, the entire mass of the Earth is another (and the fact that the latter contains a heat source).
(4) Not to mention “global mean surface temperature” and its correlation between its possible (?) meaning with its mening in the world of any model.
Samedi,
Don’t use the term ‘heat’. It will avoid much confusion. Bryan to the contrary, the term ‘heat’ has multiple meanings. The correct meaning may not always be obvious from context.
The flux density upward from the surface must be greater than the flux density downward from the atmosphere to the surface on average. Adding CO2, all other things being equal, will increase the downward flux density from the atmosphere. The only way to increase the upward flux density from the surface to compensate for this increase is to increase the surface temperature. The source of energy to do this is the sun. All else follows from this.
Its not just the quantity of energy moving from a higher temperature source to a lower temperature sink that is important.
The higher temperature source provides energy that has a higher quality.
That is it contains photons with a fraction at higher frequency than lower temperature stream.
This is very important as is illustrated by the photoelectric effect.
With radiation falling on a clean zinc plate there is no electron emission unless the frequency is greater than the work function.
10,000Joules of low frequency photons will do nothing whereas one joule of higher frequency photons will allow electrons to flow.
This quality aspect of radiation is very important to the efficiency of solar cells
Bryan,
That’s important for photoelectric effect, and that’s important for photochemistry more generally, but that has absolutely no influence on radiative energy transfer, when chemistry is not involved and when emissivity/absorptivity is already taken into account.
A photon carries a certain amount of energy, that’s all that counts.
Bryan is probably hard at work on a new theory for temperature change.
Back in October 15, 2010 I asked Bryan for the equation for temperature change.
To assist the process I put forward a possibly heretical version I find in all thermodynamics textbooks:
Many time since I have asked him for the equation.
More recently I commented:
The problem if he provided an equation – it would either be laughably unsupportable by any textbook, or would fall into the trap I have cunningly prepared.
Bryan is wisely not answering the question. He is taking the 5th, along with G&T. I commend him on his course of action.
DeWitt Payne,
hard not to use the term “heat” when the whole thing is about… heat transfer.
“Adding CO2, all other things being equal, will increase the downward flux density from the atmosphere”
Which is what remains to be demonstrated, quantified, and observed in the real world.
From where in the atmosphere to where?
Almost everybody knows absorption of CO2 is saturated in about 10 m above the ground. Photon re-emission needs about one second, enough for CO2 molecules near the surface to colide around 100 000 times with N2 and O2 in the meantime. So it’s almost all thermalized, and then you swich to convective transfer, latent heat transfer – you just cannot part things.
So at first glance, in a big part of the lower troposhere you’re very far from conditions where one can play with Beer-Lambert’s law to derive delta T. Maybe this is just one example of GHG story for kids. Now the question is: then why do they apply Beer-Lambert?
“all other things being equal” is an approach which doesn’t make sense in the real world, only in models where one try and isolate radiation from the general heat transfer system.
When, at a given place, surface temperature gets higher for whatever reason, it’s no surprise you mesure a significant increase of DLR, in particular, around 15 um: it shows that the surface emit more, simply because it’s hotter, then, as everybody would expect, that the near surface air is also getting hotter, so CO2 re-emits more (even if “saturated”). Of course, this doesn’t tell you that the surface temperature elevation comes from CO2 (in this example, CO2 concentration is by construct among those “other things being equal“).
Bryan,
yes but see the context… If the surface is assumed to be a grey body and its temperature changes, for example, from 240 K to 300 K, the peak emission will move from around 12 microns to 10 um, being now less close to 15 um, which “horizontal translation” alone would involve somet tenths hing like one tenth of W/m² less at 15 um, but the general increase in power (“vertical translation”) will be very important, so that, all in all, you get about twice more power at 15 um…
PP,
it’s sometime hard to understand what you’re thinking about… What’s that radiative heat transfer system “where emissivity/absorptivity is already taken into account“?… There is no such thing as radiative energy transfer out of absorption/emission: radiative heat transfer is precisely all about absorption/emission. To say it another way, the existence (and the amplitude) of a given radiative flux tells you absolutely nothing about its thermal effects here or there. You don’t need me either to knwo that CO2 absorbs nothing out of a few bands (15 um mainly). Mmm, what was your point, there, anyway?…
There is not much point in answering SoDs questions.
This is because he cannot (or will not ) read what is there black and white.
For example just look at fig 2 above.
Here SoD claims that G&T say that radiation cannot move towards or be absorbed by a higher temperature surface.
Yet here is what G&T actually say
“(a) We never claimed – allegedly with reference to Clausius – that a colder body does not send radiation to a warmer one. Rather, we cite a paper, in which Clausius treats the radiative exchange [19, 20]. The correct question is, whether the colder body that radiates less intensively than the warmer body warms up the warmer one.
The answer is: It does not.”
Page 12
Click to access 1012.0421v1.pdf
Will SoD desist in misrepresenting G&T …..I think not
Now previously I have carefully worked out for SoD two examples of heat transfer from a higher temperature object to a lower temperature object.
This is really only covered in the Ladybird book of Thermodynamics.
The heat lost by the hotter object equals the heat gained by the colder.
The hot object drops in temperature and the cold object increases its temperature.
Really simple isn’t it!
But SoD and other AGW advocates just don’t get it
Pekka
The quality of radiation is very important to life and climate on this planet.
The media is full of news of advances recently made in the efficiency of photocells.
The claim that perhaps soon they will reach the efficiency of plants.
This is put at 30%
So green plants convert 30% of radiation energy landing on them to chemical energy (starch) via the process of photosynthesis.
There are vast areas of forest and grassland and seaweed converting the solar radiation into stored energy rather than immediately thermalising it as is claimed by climate science.
Diagrams like KT97 totally ignore the photosphere,biosphere and other chemical effects induced by solar radiation.
Indeed if we were to take such diagrams seriously the radiations budget quoted would not permit frequencies capable of photosynthesis.
Samedi
I consider the ‘science’ behind AGW to be no more than cherry picking to arrive at an previously agreed outcome.
So many variables are present that by exaggerating some and minimising others you can reach almost any outcome desired
Bryan,
Bringing photosynthesis into this discussion is as misleading as essentially everything else you write, because what happens for the solar SW is not part of the controversy. Nothing comparable takes place for LWIR.
When confronted by your serious lack of understanding in some area you bring in something totally disconnected, probably hoping that some readers don’t notice, how you evade real questions.
Pekka
” because what happens for the solar SW is not part of the controversy. Nothing comparable takes place for LWIR.”
So a major fraction of solar radiation is unaccounted for in KT97 and other AGW ‘science’.
That does not seem to worry you.
Also the ‘pause’ in global warming lasting almost 20 years despite increasing atmospheric CO2 is not a cause for concern to AGW advocates like yourself.
Previously you indicated that even if the pause was much longer you would not be concerned.
Kuhn would understand where you are coming from.
This lack of confirmation of your conjecture yet fervent belief in the mysteries of climate dogma makes me care very little for your comments on ‘science’
Bryan,
That’s the maximum theoretical efficiency for the photosynthesis of glucose The actual number is much, much less, less than 1% on average for crop plants..
No, it isn’t. It’s a very small fraction that is equal to the rate of change of total biomass. It’s not at all clear whether this rate is positive or negative, but it’s small in terms of the total solar energy absorbed by the surface.
As usual, this attempt at deflecting from the main issue just demonstrates further your lack of knowledge.
DeWitt
This comment is just one part of the conveniently ignored reality that cobbles together to produce the AGW hoax
Heres where the 30% theoretical efficiency comes from.
“It takes 114 Kcal to reduce one mole of CO2 to hexose, so the theoretical efficiency is 114/381 or 30%. ”
http://hyperphysics.phy-astr.gsu.edu/hbase/biology/ligabs.html
So once again you open your mouth and put your foot in it.
Last time I had a look at the documentation for HITRAN database, I was surprised to see that they had something like 3 times more lines for CO2 than for water vapor. I’ve got a doubt, but if I well remember, there was also a much larger wavelengths range for water vapor than for CO2.
I was also forced to note that it’s really difficult to find online information about the absorption spectrum of water vapor. But one thing which few people seem to know is that basically, this is very hard to determine.
I was told that, in general, the information on bandwidths is often doubtful in the “electronic” domain of higher wavelengths values – there is an uncertainty something like 30% on the absorption of incoming solar radiation by the atmosphere (or, rather, an unexplained gap), and this is probably due to the fact that absoption by water is significantly higher than simulated. This was certainly one important study on that issue.
Anyway, it’s thougth that the results are generally rather good in the IR, as far as line positions and bandwidths, but there are real difficulties, also in the IR, when it comes to evaluate the intensities, i.e. the absorbtivity VS wavelength. Of course it’s pretty tricky to correctly measure spectra in the general case, but in the case of H2O, a big “silly” reason is simply that water vapor condenses on the walls of the tubes, especially at the temperatures and pressures ranges one would want to consider… So that one can hope to rather correctly get curves for transmittance but this is very difficult to derive molar absorptivities.
(I’m afraid it’s not at all impertinent to add that this “big silly” issue you’ve got in the lab is also what you’ve got as soon as you try and study the real world, were phase change is so common for water.)
There is a second aspect which seems not to be often noticed: not only liquid water spectrum shows a “continuum” but it shows an absorptivity minimum at 15 um (where everybody knows CO2 has it’s main radiative action relatively to the radiation emitted by the surface), with a “relative transmittance” a bit higher than 0,25 only. See. While it’s very different for the gaseous form, water vapor.
I’m quite sure other people have better information on that. Just asking.
By the way, I found it even much harder to find information about variations of the total emissivities of CO2 and H2O VS temperature.
The only thing I’ve found online is curves from Hottel. Reproduced e.g. in Lapp’s thesis (1960), showing that the total emissivity of CO2 decreases with temperature around 500 degres Rankine = 4,°C.
I’m sure this also have been discussed in such a famous blog, so here again, I’m just asking.
The equation for total emissivity is here. Total emissivity varies with temperature because different bands of CO2 have different energies, but the denominator always increases with temperature. As you can see from this diagram, the total emissivity decreases, then increases and finally decreases. But the emissivity at any given temperature increases with increasing CO2. It also doesn’t go high enough. A vertical column of the atmosphere has a pressure times path length for CO2 of ~300 bar cm. The equation and graph are from Modest, Radiative Heat Transfer.
From 0-35°C, the total emissivity changes very little. This was calculated using MODTRAN and zeroing out everything except CO2. The total emission with CO2 = 0 was subtracted from the total emission with CO2 = 400 ppmv to eliminate other emission.
Thanks, but so that’s the same data I’ve found, I was wondering if you can find other (more recent) sources.
The equation for total emissivity hasn’t changed. Modest, second edition is recent as those things go. Its publication date is March 21, 2003. As far as I know, there hasn’t been a revolution in radiative heat transfer theory since then. The major advance has been the replacement of Hottel’s empirical graphs with calculations (Leckner, e.g.) using either full line-by-line or moderate resolution band emission calculations all traceable back to HITRAN.
Samedi,
“Doubting” the work of 1000s of spectroscopy professionals or the professionalism of Journal of Quantitative Spectroscopy and Radiative Transfer because of something you remember isn’t a great approach. Maybe what you remember wasn’t correct. If you find the source then you can confirm the discrepancy. Report back when you find this information.
Water vapor absorbs via absorption lines, and via the “continuum absorption”. The relationship is approximately proportional to the square of the water vapor concentration, whereas normal absorption lines absorb in proportion to the concentration.
If you try a website called Google Scholar you can find lots of information.
I typed your search phrase “absorption spectrum of water vapor” into Google Scholar:
The absorption lines are simple, so long as you have the right equipment and lots of time. Lots of painstaking work, as recorded in journals like the above.
The continuum absorption is not simple, and is the subject of many papers. If you use Google Scholar for “water vapor continuum absorption” you will learn about that also.
About HITRAN db, see versions 2004, 2008 and 2012 of Rothman et al. (JQSRT indeed), given for documentation on the Harvard.edu HITRAN website.
My memories (and doubts) were from (about) lecture of the 2008 version.
Taking the totals for all the isotopologues, they had 314 919 transition lines for CO2 and 69 213 for H2O.
Taking only the few isotopologues which represent almost 100% (see 2004 paper for respective percentages), also in the 2008 version, they had:
H2O:
161 (0,99732): 37 432
CO2:
626 (0,98420): 128 170
636 (0.01106): 49 777
Total 626+636: 177 947
Ratios: 4,55 – 4,75. Sorry, maybe “something like 3 times more” was a bit conservative…
It would certainly be wrong to estimate that this comparison between 2004 and 2008 versions gives an idea of the effort:
H20 161: change from 36 114 (2004) to 37 432 (2008)
CO2 626+636: change from 36 815 (2004) to 177 947 (2008)
Now with the same a priori, Rothman et al. 2012 seems to indicate that they have done much better since 2008. See table 2:
H2O:
161 (0,99732): 142 045
CO2:
626 (0,98420): 169 292
636 (0.01106): 70 611
Total 626+636: 239 903
Ratio: 1,69.
Obviously my remark about the spectral range was very certainly pointless, no question they concentrate the lines on the relevant bands.
Now please don’t reinterpret what my “doubts” were about, people can read: I precisely meant this doubts were simply about my own ability to have correctly reminded this bit of an information.
Page 9, par. 2.1.1, in the 2012, they wrote:
(1) Due to the difficulties associated with measurements of water-vapor line intensities, some values given in HITRAN were reported to have problems. For instance, intensities in the 8000 – 9000 cm-1 spectral region were reported to have been systematically in error (10 – 15%) by authors of more recent experiments [4], theoretical calculations [5], and atmospheric retrievals [6, 7]. Less dramatic, but still noticeable (5 – 10%) inconsistencies were identified below 8000 cm-1 (see, for instance, Refs. [8 – 10]) where a majority of intensities down to 1750 cm-1 (for stronger lines) originated from the unpublished SISAM database of Toth [11]. It is worth pointing out that the SISAM database tabulates intensities obtained both experimentally and using a semi-empirical model. However, only the calculated ones were adopted into the HITRAN database, and it was later determined that the experimental values were often superior to the calculated ones.
Also sorry to mention that HITRAN synthetisers have been and still are themselves not that confortable with the intensities, and that’s no secret. See for example this 2000 paper.
I think I’d been very clear about the difficulties I’ve mentionned, for measurements for water vapor.
First, I’ve clearly distinguished between locating lines and measuring wandwitdths, but your answer indicates that this kind of detail doesn’t bother you much. Or that you don’t bother discussing those aspects. “The absorption lines are simple” is a meaningless statement.
Second, water droplets formation on experimental tubes at relevant temperatures and pressure levels is not a problem you solve by just spending “lots of time” repeating “simple” experiment, it’s just unavoidable.
You’ll think once again I’m a nasty guy if I remark that, when I click on the link
indicated for source [11] in the 2012 realease paper, the page says it’s forbiden (for me) to access the corresponding data on this server. Nevermind.
Apart from those silly difficulties, where have you seen that I expressed doubdts about the seriousness of JQSRT people?
Now who are those “1000s” of “professionals” you’re talking about? I let your readers judge if it’ serious to handwave that much. Not sure you don’t really care spending two minutes with a cntrl+F / “water” and cntrl+F / “H2O” in the list of HITRAN references.
I don’t think it’s a noble tribute to the work of scientists if you feel some kind of scorn whenever people raise any question. Nobody’s talking about the Bible, keep cool. Needless to say I don’t find it a very respectable attitude and basis for debate either if you start from the point I can’t even use a web research engine for scholars. When someone asks someting and you cannot help provide information, not sure it’s worth answering anyway…
This time it wasn’t clear (first time it was): the main expected errors are not on line locations but on intensities, i.e. molar absorptivities.
Samedi
Then I didn’t really understand your point. It seemed you doubted the accuracy of the HITRAN database because your remembered something different.
But now to confirm what you remember you refer to the HITRAN database:
Your doubt about the ratio of lines in the HITRAN database is confirmed by the ratio of lines in the HITRAN database? This leaves me confused.
So if you have a point, please explain what your point is. If you have a doubt, don’t mention “I’ve got a doubt”. Hinting at doubts is only adding to my confusion.
Samedi,
The line width of a typical absorption line has this relationship with pressure p and temperature T:
w = w0 . (p/p0).(T0/T)1/2
where w0 is the line width at a reference pressure, p0 and reference temperature T0.
So if you decrease the temperature of the gas from say 300K to 250K the line width increases by 10%. If we increase the temperature from 300K to 350K the line width decreases by 9%.
The total line strength stays constant. So you are “spreading out” the absorption line, but the area under the curve stays constant.
If we think about typical atmospheric temperatures and pressures it becomes clear that pressure has a much larger effect.
Move up to the tropopause from the surface and in the tropics the temperature drops from maybe 300K to 220K, while the pressure drops from 1000mbar to 200mbar:
w=0.23 x w0 – that is, the line width shrinks to one quarter of its surface value.
Hottel studied furnaces. Leckner updated his work.
Here is a paper by Leckner: Spectral and Total Emissivity of Water Vapor and CO2 (1972). In it his curves for emissivity go down only to 300K, whereas the atmosphere is mostly below 300K
Leckner says:
and cites RM Goody, Atmospheric Radiation, vol 1, Theoretical Basis
The updated edition of this is by Goody & Yung (1989). This is kind of a standard text in atmospheric physics.
If you want to work out the emission of radiation from a body of gas you need the emissivity and the temperature.
The emissivity depends on the concentration of the radiatively-active gases, the pressure and temperature (as shown above) and is a strongly-dependent function of wavelength (as shown in the many articles on this blog).
I(λ) = ε(λ).B(λ,T)
where I(λ) = spectral radiance, ε = emissivity, B(λ,T) = Planck function, T = temperature
Thanks, I knew about Leckner’s curves and their limits. Of course the question was: it’s been a long time since that, so forcibly scientists have spent lot of time and efforts not only to try and reproduce these results, but also to complete them in the missing ranges; where are their peer-reviewed published papers?
“If you want to work out the emission of radiation from a body of gas you need the emissivity and the temperature.” Thank you… Don’t let your readers think you mock me, I know what emissivity is and they also know.
Maybe your readers also wonder sometimes if one is not prisonier of the conventions when emissivity is defined relatively to a black body whereas gases are completely different from grey bodies. As you may have noticed yourself, my question was about total emissivities VS temperatures, and Hottel and Leckners curves are mainly decreasing, which is not exactly comparable to a fourth power law. Could you try and be serious sometime?
Samedi,
Peer reviewed papers are written in fields, where new scientific knowledge is created, not in fields, where nothing essential changes from the earlier knowledge. Issues that I have seen discussed in relatively recent papers include details of the line shapes, in particular the far tails, and properties of continuum absorption/emission. These two issues are actually strongly linked as both are dependent on the interaction of molecules that are very close to each other either during a collision or because the molecules stick to each other for a while.
Continuum absorption of water vapor has a significant effect on the atmosphere, while the far tails of CO2 lines get really important only, when the concentration of CO2 is much higher than it is in the Earth atmosphere.
HITRAN database gets improved all the time, but it’s likely that by far most of the changes are either small adjustments in the values or addition of very weak lines that have almost no effect in the atmosphere. A small fraction of all the lines produces 99% of the effect, or 99.9%.
Samedi
Gases are completely different from grey bodies.
What’s your point?
Gases are not black bodies – which means emissivity = 1. Gases are not grey bodies – which means emissivity(λ) = constant.
Emissivity is a physics definition. It is a wavelength dependent property which defines how a body emits radiation compared with a black body.
You were unhappy with me explaining the difference between emissivity and emission, because “Don’t let your readers think you mock me, I know what emissivity is and they also know.”
If you have a point, what is it?
Emissivity is not emission. Emission will change exactly to the 4th power of temperature if total emissivity is a constant:
Rout = εtotalT4.
Usually total emissivity, εtotal, is not a constant as a function of temperature. Therefore emission will not change exactly as the 4th power of temperature.
What is constant is ε(λ) and Planck’s law. The rest follows naturally.
I am being serious. I cited some equations. Your questions that follow indicate you don’t understand the implications of these basic equations. That’s not mocking you. It just seems like you don’t understand them.
– The fact that emissivity varies with temperature is something that everyone in atmospheric physics already knows.
– The fact that atmospheric radiation does not vary exactly according to the 4th power of temperature is something that everyone in atmospheric physics already knows.
– No one in atmospheric physics uses Hottel’s empirical curves because they were calculated for a different application and aren’t usable in atmospheric conditions.
SoD,
sorry my sentence about decreasing emissivity and fourth power emission was indeed very badly turned… Too much in a hurry this morning. Just wanted to say, yes, it’s a bit like having the exponent less than 4.
You say, they well know that. Maybe, but what in practice?
You seem to confirm that nobody bothered to experimentaly determine those total emissivities under 300 K? Do you think it’s worthless? Why?
Take another example of things which are even more well known: how many people say that, as the surface has an albedo of 0,07, you put away the 7% reflected part, but when they compute their BB emission, do they consider a grey body emissivity of 0,93? Basic question, but I’m sorry this is not clear at all in most papers, litterally they seem to have their objects absorbing like grey bodies but emitting like black bodies. So the reader is suppose to guess what they actually have done?
You replied with a formula, OK but it’s not measurement. Besides, you’re talking about line width alone. We still miss two dimensions to get to absorbtion.
“The total line strength stays constant. So you are “spreading out” the absorption line, but the area under the curve stays constant.”
I’m are still missing something? Conservation of the area is not conservation of the total emissivity, it all depends on where you put the mean level. Integrating something between 0,2 and 0,4 or between 0,7 and 0,9 won’t give you the same. In terms of emissivity, one mm² on the bottom has not the same weight as one mm² on the top. Hmm I’m having difficulties, and English after 11 pm…
And of course, as you well noticed yourself, the change in emissivity – a fortiori your one quarter mention (bandwidth ratio) – still gives a fain idea of the change in terms of emission.
Take a look, e.g. at pages 32-33 (190-191) of this set of papers, I’m sure you’ll see what i mean this time…
PP,
I don’t want you to waste your time on that, my remark about HITRAN line numbers was certainly on a marginal issue.
Samedi,
Do you understand what total emissivity is?
Emission of thermal radiation, E:
E = ∫ ε(p,T,λ).B(λ,T)
where the integration is across all wavelengths
where the variables are as previously described. From this calculation you can work out a “total emissivity”.
E = εtotalT4
many decades of work have confirmed that ε is primarily a very strong function of λ with a dependence on p,T that I previously noted.
When you have these you can calculate total emissivity for the specific conditions under consideration.
If you are asking has anyone validated the measurements in the real atmosphere the answer is yes, lots of measurements.
Because the atmosphere absorbs and emits radiation knowing “total emissivity” for a given path length with changing pressure and temperature is not actually very useful.
If you had a table of “total emissivity” from the surface to TOA as a function of surface temperature, atmospheric temperature profile, concentration of GHGs how would you use it?
The reason people don’t build these massive tables is because they don’t serve any use. Instead the useful building blocks for atmospheric emission are the extensive tables of absorption coefficients for each gas at each wavelength. These can be used.
You can see more about that question at:
Visualizing Atmospheric Radiation – Part Six – Technical on Line Shapes – I’ve extracted a few pages from a textbook and explained in some detail
Understanding Atmospheric Radiation and the “Greenhouse” Effect – Part Twelve – Curve of Growth
As the line spreads out at higher pressures the absorption in the middle of the line is reduced. As the line “sharpens” at lower pressures the absorption in the middle of the line is increased. There is a formula for it and the calculations of radiative transfer – numerical integration across all wavelengths – takes this into account.
In the HITRAN database:
S = intensity is the total absorption strength under the curve
γair = Air-broadened half-width – this parameter allows you to plot the curve
nair = temperature-dependence exponent for γair (this is usually the power 0.5 for T0/T as explained in the earlier comment)
DeWitt
Remember I was making the point that instead of instant thermalisation photosynthesis stores energy.
This can be in a readily useable for like sugar or in the unusable roots.
You say
“No, it isn’t. It’s a very small fraction that is equal to the rate of change of total biomass. It’s not at all clear whether this rate is positive or negative”
The only meaning I can put to this statement is that perhaps photosynthesis wastes radiation energy that could otherwise be used to instantly thermalise.
What a back to front way of thinking
Many people have studied the total biological production. Estimates of the total amount of energy that’s first converted to biomass tell that it’s less than 0.2% of all solar radiation that reaches the surface. Oxidation of biomass releases essentially the same amount, but the timing is not identical. Most obviously photosynthesis takes place only during the day while decay of biomass occurs also during the night.
Bryan brings up an interesting point.
I had not read the followup paper to G&T’s Magnum opus – “Falsification of blah blah blah”.
In their Magesterium of 100+ pages they simply showed half a diagram of normal atmospheric radiation and pointed out this was not physics.
Somehow this meant (to the faithful) that atmospheric physics as currently practiced in climate science was not physics.
I correctly reproduced the diagram from their paper in this article – contrary to what Bryan states.
Given they claim to understand physics and do double integrals I naturally – along with the rest of the world – took it for granted that they believed the first law of thermodynamics. So I assumed that they didn’t believe the atmosphere radiated to the ground, or the ground didn’t absorb the radiation.
From the followup paper, which Bryan has kindly alerted me to, they take the fifth.
They obviously don’t believe the first law of thermodynamics even though they don’t clear up this point. Possibly they haven’t heard of the first law of thermodynamics. Interested students of G&T (which doesn’t include me) can go and check their paper and report back.
Bryan happily believes anything they say.
Given that this is a science blog I provided a simple calculation which disproves G&T’s claim – this is laid out in The Three Body Problem which Bryan has yet to find the fault with – other than he doesn’t like the conclusion. My calculations do rely on the first law of thermodynamics. I provide the entropy calculation which proves the second law of thermodynamics is not violated.
G&T perhaps are trapped in some 19th century paradigm where they – like Bryan – can only envisage two bodies inside a closed system exchanging energy with each other.
Unlike G&T’s 19th century idealization the sun provides a constant source of energy to the surface of the earth – that is, it’s not a closed system – and when you swap deep space at 3K for an atmosphere that is colder than the surface and warmer than 3k it increases the surface temperature of the earth.
No more complicated than lagging a pipe although it is a different set of heat transfer equations.
G&T carefully avoid the trap of:
a) doing a calculation to prove their erroneous claim
b) stating what happens the energy from the colder atmosphere when it “reaches” the surface
My conclusion is either:
a) they think the energy disappears
b) they are having a laugh (my personal choice)
That’s why Bryan is – almost 4 years on – still trying to find the formula for change in temperature with change in energy, and in the meantime keeps changing the subject.
You can expand your teaching a little further – A Challenge for Bryan
Bryan says:
I’m not sure where this calculation is. But it’s probably just like the many explanations I have already provided, e.g. in The Three Body Problem:
Resulting comments on this blog and elsewhere about those articles frequently contain comments of this form:
Yes, if anyone was saying that it would be ridiculous. I agree. To take one example from many, in The Real Second Law of Thermodynamics I said:
So it’s clear that, as with G&T, Bryan has not been able to conceive of a problem where body A is provided with a continual separate source of energy (e.g. the sun on the surface of the earth).
Once you have a continual source of energy “internally” heating body A, when you increase the temperature of body B that it is exchanging energy with A, the temperature of body A must increase.
This is the first law of thermodynamics.
I’ve already explained this to Bryan.
My challenge to Bryan – as always – given your amazing expertise in this field – provide a calculation of body A with constant internal heating, and take 2 cases for body B with 2 different temperatures.
Provide your calculations of the equilibrium temperature of body A under these 2 cases.
But remember, don’t forget the constant internal heating of body A.
I look forward to the calculations and what they demonstrate. I sadly expect never to see this calculation from Bryan. When he does it at home, cognitive dissonance will set in.
[…] has been trying to teach me some basics on heat transfer from the Ladybird Book of Thermodynamics. In hilarious fashion we both already agree on that particular […]
SoD, you say: “The latent heat transfer – can only increase if there is an increase in wind speed or in the humidity differential between the surface and the atmosphere just above” but the latent heat transfer will also increase with increasing surface temperature. This obviously doesn’t affect any of your subsequent arguments but I think it should be noted.
Susan,
You are correct, but the humidity differential is a function of temperature. So it’s implied in the description.
It might be clearer in the formula..
The “bulk aerodynamic” formula:
LH = LρCDEUr(qs-qa)
which says Latent Heat flux = latent heat of vaporization x density x “aerodynamic transfer coefficient” x wind speed at the reference level x ( humidity at the surface – humidity in the air at the reference level)
And the “real formula”:
LH = Lρ<w’q’>
Latent heat flux = latent heat of vaporization x density x covariance of upwards velocity variations with specific humidity variations
Obviously, the specific humidity changes at the surface due to the temperature increase.
Thanks SoD. I see what you mean.
Aw, this was a very nice post. Finding the time and actual effort to produce a very good article… but what can I say… I hesitate a
lot and don’t seem to get anything done.
“yes the surface of the earth does absorb atmospheric thermal radiation”
No it doesn’t. The back radiation is pseudo scattered without any of its energy being converted to thermal energy in the warmer surface.
Hi Doug,
Long time no see.
SoD,
I suspect you need to add ‘pseudo scatter’ to your screening criteria.