In Part II we looked at various scenarios for emissions. One important determinant is how the world population will change through this century and with a few comments on that topic I thought it worth digging a little.
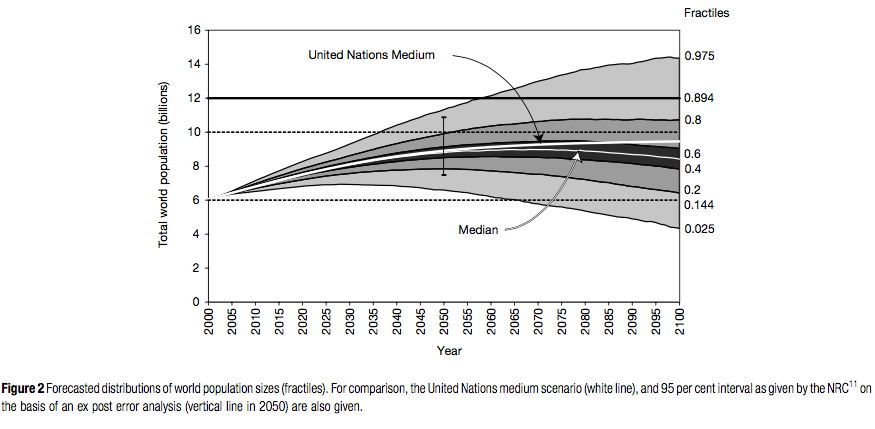
Here is Lutz, Sanderson & Scherbov, Nature (2001):
The median value of our projections reaches a peak around 2070 at 9.0 billion people and then slowly decreases. In 2100, the median value of our projections is 8.4 billion people with the 80 per cent prediction interval bounded by 5.6 and 12.1 billion.
From Lutz 2001
Figure 1 – Click to enlarge
This paper is behind a paywall but Lutz references the 1996 book he edited for assumptions, which is freely available (link below).
In it the authors comment, p. 22:
Some users clearly want population figures for the year 2100 and beyond. Should the demographer disappoint such expectations and leave it to others with less expertise to produce them? The answer given in this study is no. But as discussed below, we make a clear distinction between what we call projections up to 2030-2050 and everything beyond that time, which we term extensions for illustrative purposes.
[Emphasis added]
And then p.32:
Sanderson (1995) shows that it is impossible to produce “objective” confidence ranges for future population projections. Subjective confidence intervals are the best we can ever attain because assumptions are always involved.
Here are some more recent views.
Gerland et al 2014 – Gerland is from the Population Division of the UN:
The United Nations recently released population projections based on data until 2012 and a Bayesian probabilistic methodology. Analysis of these data reveals that, contrary to previous literature, world population is unlikely to stop growing this century. There is an 80% probability that world population, now 7.2 billion, will increase to between 9.6 and 12.3 billion in 2100. This uncertainty is much smaller than the range from the traditional UN high and low variants. Much of the increase is expected to happen in Africa, in part due to higher fertility and a recent slowdown in the pace of fertility decline..
..Among the most robust empirical findings in the literature on fertility transitions are that higher contraceptive use and higher female education are associated with faster fertility decline. These suggest that the projected rapid population growth could be moderated by greater investments in family planning programs to satisfy the unmet need for contraception, and in girls’ education. It should be noted, however, that the UN projections are based on an implicit assumption of a continuation of existing policies, but an intensification of current investments would be required for faster changes to occur
Wolfgang Lutz & Samir KC (2010). Lutz seems popular in this field:
The total size of the world population is likely to increase from its current 7 billion to 8–10 billion by 2050. This uncertainty is because of unknown future fertility and mortality trends in different parts of the world. But the young age structure of the population and the fact that in much of Africa and Western Asia, fertility is still very high makes an increase by at least one more billion almost certain. Virtually, all the increase will happen in the developing world. For the second half of the century, population stabilization and the onset of a decline are likely..
Although the paper doesn’t focus on 2100, but only up to 2050 it does include a graph for probalistic expectations to 2100 and has some interesting commentary around how different forecasting groups deal with uncertainty, how women’s education plays a huge role in reducing fertility and many other stories, for example:
The Demographic and Health Survey for Ethiopia, for instance, shows that women without any formal education have on average six children, whereas those with secondary education have only two (see http://www.measuredhs.com). Significant differentials can be found in most populations of all cultural traditions. Only in a few modern societies does the strongly negative association give way to a U-shaped pattern in which the most educated women have a somewhat higher fertility than those with intermediate education. But globally, the education differentials are so pervasive that education may well be called the single most important observable source of population heterogeneity after age and sex (Lutz et al. 1999). There are good reasons to assume that during the course of a demographic transition the fact that higher education leads to lower fertility is a true causal mechanism, where education facilitates better access to and information about family planning and most importantly leads to a change in attitude in which ‘quantity’ of children is replaced by ‘quality’, i.e. couples want to have fewer children with better life chances..
Lee 2011, another very interesting paper, makes this comment:
The U.N. projections assume that fertility will slowly converge toward replacement level (2.1 births per woman) by 2100
Lutz’s book had a similar hint that many demographers assume that somehow societies on mass will converge towards a steady state. Lee also comments that probability treatments for “low”, “medium” and “high” are not very realistic because the methods used assume a correlation between different countries, that isn’t true in practice. Lutz likewise has similar points. Here is Lee:
Special issues arise in constructing consistent probability intervals for individual countries, for regions, and for the world, because account must be taken of the positive or negative correlations among the country forecast errors within regions and across regions. Since error correlation is typically positive but less than 1.0, country errors tend to cancel under aggregation, and the proportional error bounds for the world population are far narrower than for individual countries. The NRC study (20) found that the average absolute country error was 21% while the average global error was only 3%. When the High, Medium and Low scenario approach is used, there is no cancellation of error under aggregation, so the probability coverage at different levels of aggregation cannot be handled consistently. An ongoing research collaboration between the U.N. Population Division and a team led by Raftery is developing new and very promising statistical methods for handling uncertainty in future forecasts.
And then on UN projections:
One might quibble with this or that assumption, but the UN projections have had an impressive record of success in the past, particularly at the global level, and I expect that to continue in the future. To a remarkable degree, the UN has sought out expert advice and experimented with cutting edge forecasting techniques, while maintaining consistency in projections. But in forecasting, errors are inevitable, and sound decision making requires that the likelihood of errors be taken into account. In this respect, there is much room for improvement in the UN projections and indeed in all projections by government statistical offices.
This comment looks like an oblique academic gentle slapping around (disguised as praise), but it’s hard to tell.
Conclusion
I don’t have a conclusion. I thought it would be interesting to find some demographic experts and show their views on future population trends. The future is always hard to predict – although in demography the next 20 years are usually easy to predict, short of global plagues and famines.
It does seem hard to have much idea about the population in 2100, but the difference between a population of 8bn and 11bn will have a large impact on CO2 emissions (without very significant CO2 mitigation policies).
References
The end of world population growth, Wolfgang Lutz, Warren Sanderson & Sergei Scherbov, Nature (2001) – paywall paper
The future population of the world – what can we assume?, edited Wolfgang Lutz, Earthscan Publications (1996) – freely available book
World Population Stabilization Unlikely This Century, Patrick Gerland et al, Science (2014) – free paper
Dimensions of global population projections: what do we know about future population trends and structures? Wolfgang Lutz & Samir KC, Phil. Trans. R. Soc. B (2010)
The Outlook for Population Growth, Ronald Lee, Science (2011) – free paper


A personal note: I used to teach an elementary college course “Physics of the Environment” before I finally retired. When the class came to population issues, then countries such as Japan or Italy became a focus. The populations of such developed countries tend to follow an S shaped “logistic curve”. See
http://ec.europa.eu/eurostat/statistics-explained/index.php?title=Archive:Population_projections&oldid=59474
The above URL shows a logistic curve for aging, economically developed countries in Europe, relative to some previous reference year in the past. See Fig. 3. in the URL
The situation these countries are in is that their economies are suffering because of the population logistic curve!
So, in regards to the students in such a course as I taught, are these students to think that a stable population is a good thing or a bad? There is even a political point of view, one that I disagree with, that people in such aging, developed societies should be discouraged from practicing birth control. My belief is that, rather, there ought to be a way to have a developed society that does well whilst not pushing people into buying so much stuff….
There is good reason to believe that human population will peak sooner and lower than the UN Median variant. Namely, fertility rates ( annual data from the CIA ) are lower and falling faster than the UN median variant. Current rates of change imply fertility at less than replacement ( somewhere between 2.1 and 2.3 globally ) within a decade and falling population within a generation. Population in 2100 will likely be lower than present.

Given that CO2 emissions appear to already have peaked, and that some 72% of CO2 emissions are from countries with already less than 2.1 TFR, falling CO2 rates of emission growth would also appear likely.

This is somewhat ironic, given that some of the global warming emphasis was on restraining growth, but economic development leads to population decline. So, increasing economic development benefits humans and the environment.
Things are not necessarily rosy though, because population growth is itself a term of economic growth. Some of the populism and political upheaval may result for reduced growth and a growing disaffection with being a less viable human in a slowing but robotic led world.
Eddy: I believe the SRESs broke the World up into regions and looked at population, economic, and technological growth in each region separately. In theory, they have taken into account the fact that the largest emitters would have stable or decreasing population. So far, total CO2 emission has followed the most pessimistic estimate.
The situation may look slightly different today that when the SRES were created. If we have fewer people than they expected in 2100 (pick 10% fewer for simplicity); how much will that reduce the forcing in RCP 8.5? Since forcing accumulates over time, their forcing might be 5% too high from a population that is 10% too high. Changing RCP 8.5 to RCP 8.0 isn’t going to help much.
The increase in Chinese GDP/capita and their rise to #1 emitter (2X the US and growing in total emission; equal to the EU in emissions per capita) tells me that economic growth and the carbon intensity are far more important factors than population. Economic growth is good and population growth is a minor factor. That seems to leave ECS and carbon intensity as the best reasons for optimism. (Carbon intensity of the economy sounds too much like mitigation for my taste, but change doesn’t have to be effected by inefficient mandates.)
So far, total CO2 emission has followed the most pessimistic estimate.

I don’t believe that is true.
Here are the NOAA GHG index values, shifted to a common 2000, versus the RCP scenarios as published by the IPCC AR5:
That’s forcing, not emissions, of course, but indicates we are at the low end of projections.
The increase in Chinese GDP/capita and their rise to #1 emitter (2X the US and growing in total emission; equal to the EU in emissions per capita) tells me that economic growth and the carbon intensity are far more important factors than population.
Population and economic growth are linked of course, but China is a good case in point. China’s population hasn’t yet begun declining ( though they’re close ). However, China’s population, like that of most of countries, is aging rapidly. So much so that China’s working age population is declining:

This slows down growth and demand ( old farts just don’t spend as much and certainly don’t produce as much ).
The trend toward falling fertility is based on the pill, economic development ( from agrarian where children were a working asset as early as age 5 to an information economy where children are an expense and may not work until age 25 or later ). These trends are global and are occurring even in the face of government policy ( paying parents to have children, or religious governments forbidding contraception ). Assuming they continue, populations will be lower than it is now in 2100 and much older. CO2 emissions will be at the low end of projections.
TE,
Emissions may or may not have peaked. What hasn’t happened is for the rate of increase of atmospheric CO2 to slow. The recent El Nino caused a spike in the year over year rate, but it looks like it’s returning to the trend line. I’ll put up a plot as soon as photobucket comes back on line.
DeWiit, these are monthly through 2016?
It will be interesting to see what happens past the recent El Nino.
Yes. It’s the year over year difference to minimize seasonality. That is it’s December 2016 – December 2015, etc.
I expect a dip below the trend line. in the next year or so. That looks to be what’s happened after the 1998 El Nino.
One conclusion from Gerland’s PDF is the RCP2.8 population assumption for 2100 is <10% probability and RCP8.5 is slightly <90% probability, putting both well within the unlikely category on this dimension.
Angus Deaton introduced David Lam:
The paper Lam gave is very interesting, well worth reading and freely available. I expect to cite from it again:
How the World Survived the Population Bomb: Lessons From 50 Years of Extraordinary Demographic History, David Lam, Demography (2011).
Here’s an interesting graph on changes in fertility rates in China and some other countries, from The Evolution of China’s One-Child Policy and Its Effects on Family Outcomes, Junsen Zhang, Journal of Economic Perspectives (2017):