I was re-reading Missing iris effect as a possible cause of muted hydrological change and high climate sensitivity in models, Thorsten Mauritsen and Bjorn Stevens from 2015 (because I referenced it in a recent comment) and then looked up other recent papers citing it. One interesting review paper is by Stevens et al from 2016. I recognized his name from many other papers and it looks like Bjorn Stevens has been publishing papers since the early 1990s, with almost 200 papers in peer-reviewed journals, mostly on this and related topics. Likewise, Sherwood and Bony (two of the coauthors) are very familiar names from this field.
Many regular readers (and I’m sure new readers of this blog) will understand much more than me about current controversies in climate sensitivity. The question in brief (of course there are many subtleties) – how much will the earth warm if we double CO2? It’s a very important question. As the authors explain at the start:
Nearly 40 years have passed since the U.S. National Academies issued the “Charney Report.” This landmark assessment popularized the concept of the “equilibrium climate sensitivity” (ECS), the increase of Earth’s globally and annually averaged near surface temperature that would follow a sustained doubling of atmospheric carbon dioxide relative to its preindustrial value. Through the application of physical reasoning applied to the analysis of output from a handful of relatively simple models of the climate system, Jule G. Charney and his co-authors estimated a range of 1.5 –4.5 K for the ECS [Charney et al., 1979].
Charney is a eminent name you will know, along with Lorentz, if you read about the people who broke ground on numerical weather modeling. The authors explain a little about the definition of ECS:
ECS is an idealized but central measure of climate change, which gives specificity to the more general idea of Earth’s radiative response to warming. This specificity makes ECS something that is easy to grasp, if not to realize. For instance, the high heat capacity and vast carbon stores of the deep ocean mean that a new climate equilibrium would only be fully attained a few millennia after an applied forcing [Held et al., 2010; Winton et al., 2010; Li et al., 2012]; and uncertainties in the carbon cycle make it difficult to know what level of emissions is compatible with a doubling of the atmospheric CO2 concentration in the first place.
Concepts such as the “transient climate response” or the “transient climate response to cumulative carbon emissions” have been introduced to account for these effects and may be a better index of the warming that will occur within a century or two [Allen and Frame, 2007; Knutti and Hegerl, 2008; Collins et al., 2013;MacDougall, 2016].
But the ECS is strongly related and conceptually simpler, so it endures as the central measure of Earth’s susceptibility to forcing [Flato et al., 2013].
And about the implications of narrowing the range of ECS:
The socioeconomic value of better understanding the ECS is well documented. If the ECS were well below 1.5 K, climate change would be a less serious problem. The stakes are much higher for the upper bound. If the ECS were above 4.5 K, immediate and severe reductions of greenhouse gas emissions would be imperative to avoid dangerous climate changes within a few human generations.
From a mitigation point of view, the difference between an ECS of 1.5 K and 4.5 K corresponds to about a factor of two in the allowable CO2 emissions for a given temperature target [Stocker et al., 2013] and it explains why the value of learning more about the ECS has been appraised so highly [Cooke et al., 2013; Neubersch et al., 2014].
The ECS also gains importance because it conditions many other impacts of greenhouse gases, such as regional temperature and rainfall [Bony et al., 2013; Tebaldi and Arblaster, 2014], and even extremes [Seneviratne et al., 2016], knowledge of which is required for developing effective adaptation strategies. Being an important and simple measure of climate change, the ECS is something that climate science should and must be able to better understand and quantify more precisely.
One of the questions they raise is at the heart of my question about whether climate sensitivity is a constant that we can measure, or a value that has some durable meaning rather than being dependent on the actual climate specifics at the time. For example, there are attempts to measure it via the climate response during an El Nino. We see the climate warm and we measure how the top of atmosphere radiation balance changes. We attempt to measure the difference in ocean temperature between end of the last ice age and today and deduce climate sensitivity. Perhaps I have a mental picture of non-linear systems that is preventing me from seeing the obvious. However, the picture I have in my head is that the dependence of the top of radiation balance on temperature is not a constant.
Here is their commentary. They use the term “pattern effect” for my mental model described above:
Hence, a generalization of the concept of climate sensitivity to different eras may need to account for differences that arise from the different base state of the climate system, increasingly so for large perturbations.
Even for small perturbations, there is mounting evidence that the outward radiation may be sensitive to the geographic pattern of surface temperature changes. Senior and Mitchell [2000] argued that if warming is greater over land, or at high latitudes, different feedbacks may occur than for the case where the same amount of warming is instead concentrated over tropical oceans.
These effects appear to be present in a range of models [Armour et al., 2013; Andrews et al., 2015]. Physically they can be understood because clouds—and their impact on radiation—are sensitive to changes in the atmospheric circulation, which responds to geographic differences in warming [Kang et al., 2013], or simply because an evolving pattern of surface warming weights local responses differently at different times [Armour et al., 2013].
Hence different patterns of warming, occurring on different timescales, may be associated with stronger or weaker radiative responses. This introduces an additional state dependence, one that is not encapsulated by the global mean temperature. We call this a “pattern effect.” Pattern effects are thought to be important for interpreting changes over the instrumental period [Gregory and Andrews, 2016], and may contribute to the state dependence of generalized measures of Earth’s climate sensitivity as inferred from the geological record.
Some of my thoughts are that the insoluble questions on this specific topic are also tied into the question about the climate being chaotic vs just weather being chaotic – see for example, Natural Variability and Chaos – Four – The Thirty Year Myth. In that article we look at the convention of defining climate as the average of 30 years of weather and why that “eliminates” chaos, or doesn’t. Non-linear systems have lots of intractable problems – more on that topic in the whole series Natural Variability and Chaos. It’s good to see it being mentioned in this paper.
Read the whole paper – it reviews the conditions necessary for very low climate sensitivity and for very high climate sensitivity, with the idea being that if one necessary condition can be ruled out then the very low and/or very high climate sensitivity can be ruled out. The paper also includes some excellent references for further insights.
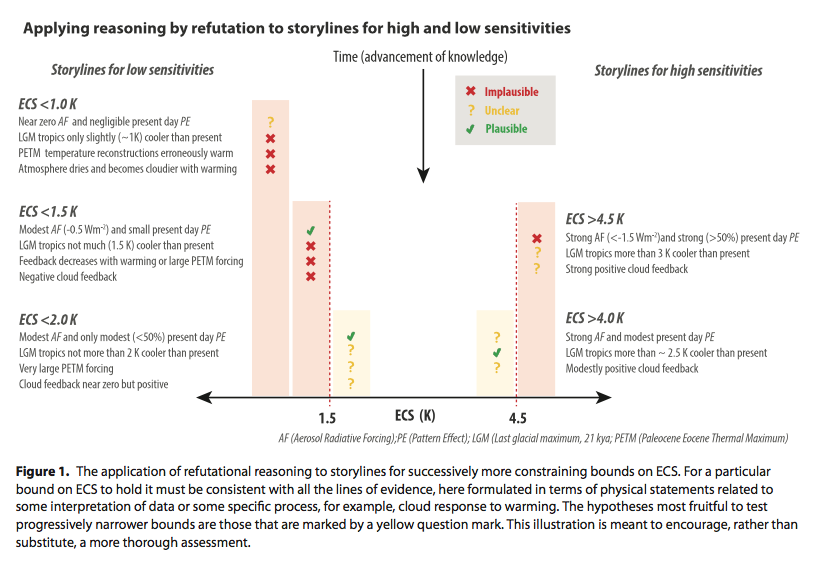
From Stevens et al 2016
Click to enlarge
Happy Thanksgiving to our US readers.
References
Missing iris effect as a possible cause of muted hydrological change and high climate sensitivity in models, Thorsten Mauritsen & Bjorn Stevens, Nature Geoscience (2015) – paywall paper
Prospects for narrowing bounds on Earth’s equilibrium climate sensitivity, Bjorn Stevens, Steven C Sherwood, Sandrine Bony & Mark J Webb, Earth’s
Future (2016) – free paper


Problems with “transient climate response to cumulative emissions”
https://ssrn.com/abstract=3000932
Corollary? Problems with unverified and unverifiable “equilibrium” estimates.
Transient response has been about 1.8K per doubling, near the low end:
At some time, if ECS is really higher than this, there must be an acceleration.
But RF and AGW are slow, global, and top down.
It’s difficult to see the case for rapid change, and so, for higher ECS.
SoD,
“One of the questions they raise is at the heart of my question about whether climate sensitivity is a constant that we can measure, or a value that has some durable meaning rather than being dependent on the actual climate specifics at the time.”
It is almost inevitable that there is no exactly fixed sensitivity… the sensitivity to a change in forcing at the depth of the last ice ace was unlikely the same as the sensitivity to forcing today. So yes, the sensitivity almost certainly is not a constant. Which is one of the reasons why I discount estimates of equilibrium sensitivity based on ice age to interglacial temperature changes. The Earth would take at least several hundred years to approach equilibrium after a doubling of CO2 to a constant value, and of course, that can never happen, because the level of CO2 (and many other factors) will not remain constant for several hundred years. So we will never be able to directly measure equilibrium sensitivity. But as a first order approximation, a value of ECS, starting from today’s conditions, seems to me a useful concept.
Stevens studied electrical engineering before moving to climate science, and did his thesis work under William R Cotton (who has expressed doubt about climate alarm) at the university of Colorado. Both these things probably give him a somewhat different perspective than many in climate science. Stevens has consistently worked on narrowing the uncertainties which limit our ability to constrain climate sensitivity. I doubt that makes many friends for him.
I doubt that makes many friends for him.
He was made an IPCC lead author on Chapter 7 of AR5. He’s also a co-lead on the WCRP Grand Challenge on Clouds, Circulation and Climate Sensitivity.
I don’t think modelers who depend on assumed aerosol offsets that are higher than best estimates… for which Stevens is at least in part responsible… are very pleased.
It does seem that lower aerosol forcing estimates have been pretty slow to penetrate GCM modeling groups. That might be an important figure of merit for GCM’s to use in the future however.
Not many friends. 🙂 There are not many scientists higher up the food chain than Bjorn Stevens. He is a highly respected and influential scientist.
Different perspective? I love this interview he had with Michael White. If I had more time, I could write ten blog posts based on that material.
I just wish I was smarter so that I could be just as contrarian without making a fool of myself. New ideas and a deep engagement with existing thought is highly appreciated in the scientific community, that is what brings science forward.
What brings ire and well deserved ridicule are the zombie myths and complete bullocks sprouted by the mitigation sceptical movement as part of the US culture war. Myths and bullocks that are so stupid that the culture warriors claiming to believe them have to bypass the scientific literature because no scientists would fall for them and directly go to the public that does not have the time and expertise to assess their value.
Victor, thanks for sharing that. A really interesting and inspirational interview
That is a really good interview. It’s pretty clear why Stevens is “high up the cood chain”. He is asking the right questions…. let’s hope the field is up to generating sone solid answers.
Victor,
Thanks for highlighting it – I recommend it highly to all our readers. You may want to skip the less interesting stuff (history, career etc) and kick in a little before 1/2 hour into the interview.
Lots of great comments, and once again, people who have a jaded view about climate scientists from media blather and confused blogs may well find a renewed appreciation for the scientists who work in the field.
The interview also highlighted this paper that I read a while back: Rethinking the Lower Bound on Aerosol Radiative Forcing, Bjorn Stevens, Journal of Climate (2015) – free access and very interesting.
Of course, jaded views of science have become very common having appeared in the Economist, Nature (several times), and the Lancet and many other places. What is annoying is science fundamentalists who try to pretend that nothing is wrong and that no fundamental reforms are needed. Junior scientists are really often not experienced enough to know what is happening and so focused on their next soft money grant that they can’t be blamed for not caring very much. I could post at least 20 links to top flight journal articles on these subjects including a really compelling one about pre-registration of medical trials that resulting in a plunge in positive findings from 67% to about 10 % if memory serves me correctly. And that’s a really big problem. Scientists like to show they have advanced the state of the art and can be reluctant to publish puzzling or seeming contradictory results or results that put them on the wrong side of a politicized issue. Negative modeling results for example are just chalked up to “I didn’t run the code right.” Thus negative results are seldom published.
Experienced and senior scientists in many fields know what the issues are very well, but are often reticent about expressing them in public. In private they are more honest, and after retirement sometimes in public too. But then science fundamentalists dismiss them as “having gone emeritus.” We do the public who after pays for most science when we refuse to acknowledge the need for reforms to improve quality and honesty.
One can think of several huge failures in medical sciences for example having to do with saturated fat and healthy diets that became public policy and industrial marketing tools that resulted in an increase in carbohydrates that actually caused more disease. This is not an isolated instance either. As science claims more control over people’s lives and government’s policies, it needs to adopt higher ethical standards and more self policing mechanisms. Above all else people need to be trained to have a strong sense of honesty and skepticism.
A good example of how this can work is Roger Pielke Jr. who is relentlessly attacked by science fundamentalists who don’t like the public to hear the IPCC position on extreme weather used to reign is popular press scare stories. The DNC hack revealed an email that shows how Joe Romm and the Center for American Progress targeted Pielke and then bragged to Steyer that they have gotten Pielke fired by Nate Silver. Here’s an article documenting these facts:
http://www.nationalreview.com/article/441438/wikileaks-john-podesta-silenced-climate-change-dissent
I’m afraid that Victor is an example of someone who denies the politization of science and keeps blaming dark forces of ‘mitigation skepticism” that are in fact very weak compared to the vast funding available from billionaires to enforce the consensus, which of course they don’t understand. It’s really nothing but a modern left wing version of witch hunting. The fact is that fossil fuels are very beneficial to everyday people and that fact accounts for the fact that mitigation has flagged in the political arena. The analogy is very apt. Mitigation fundamentalists know what is best based on their ideology and if people don’t adopt their ideology and its consequences, the cause must be evil individuals who are keeping them from doing so.
For General Release:
A paper that I recently wrote, entitled ‘Rethinking the lower bound on aerosol radiative forcing’ has been accepted for publication in the Journal of Climate. …
Experienced and senior scientists in many fields know what the issues are very well, but are often reticent about expressing them in public. …
This is highly unlikely. People in general are not that cowardly.
JCH, The problem here is that science is big business and people’s financial well being is at stake. It’s not a question of being cowardly. It’s a question of wanting to not have people mad at you, especially those fellow scientists who can affect your future ability to bring in the soft money, easily publish papers, etc. Particularly for the large science research groups, those in charge have huge stakes in successfully selling their group’s work.
Then in climate science, there is the desire to not get involved with the “enforcers” in the media and political propaganda organizations who can cause you great inconvenience and harm. Legal action is rare but becoming more of a threat. (Jacobson, Mann)
JCH, The letter you linked to is an extraordinary rear end covering exercise and is basically a political document. It tarnishes Stevens a little bit for me. The science is what it is. It seems obviously true that if aerosol forcing is at the lower end of the range, that would indicate that ECS is probably below the median estimate as well. Nic Lewis makes that point for example and has some good arguments.
The best explanation for this letter is that activist colleagues (or perhaps even a political smear outfit like Center for American Progress) contacted him and asked him to set the record straight so that “mitigation skeptics” wouldn’t score any points. Stevens is very well connected and has a lot of co-authors. It’s a sad commentary on this field of science that even top of the field scientists feel the need to write such things.
Ridiculous and wrong.
JCH, Your meaningless response is not convincing.
dpy6629,
When a critique hits too close to home, those on uncertain ground sometimes react badly. I agree, that letter was as sorry case of CYA as I have seen. I imagine the pressure from ‘enforcers’ was considerable. It is really pretty simple: all legitimate science is permitted, but the public must not ever hear “It’s not as bad as we thought’, no matter what ‘the science’ says.
Lol. Pressure from enforcers? How ridiculous can silly folks get.
JCH,
Ask Judith Curry, Roger Pielke, Jr. and the other five people on his list about Representative Raul Grijalva’s attempted witch hunt. Or look up where professors at George Mason University wrote a letter to the Obama Justice Department asking for a RICO action against the so-called merchants of doubt. The emails from the authors discussing the George Mason letter are now public record. The Climategate emails are also relevant.
Here’s Curry’s post on the RICO letter: https://judithcurry.com/2015/09/17/rico/
JCH wrote: “Lol. Pressure from enforcers? How ridiculous can silly folks get.”
Lennart Bengtsson apparently thought so when he decided to communicate with some rational skeptics. He found out otherwise. “I have been put under such an enormous group pressure in recent days from all over the world that has become virtually unbearable to me.” See
All you have to do is as Bjorn Stevens if enforcers forced him to write that. He has an email address. I suspect he’ll laugh in your face because the notion is preposterous.
You trust Professor Curry; I do not. Not one bit.
Steve, Your point about ECS is well taken. The glacial cycles are really bad examples because subtle feedbacks like ice sheets and albedo play a big role. Effective CS is a much more meaningful number.
For a more basic but instructive overview:
Bates, J. R. (2016), Estimating climate sensitivity using two-zone energy
balance models, Earth and Space Science, 3, 207–225, doi:10.1002/2015EA000154.
TE: “ECS is really higher than this, there must be an acceleration.”: as far as I remember the adjustment should be fast if the ECS were low but very drawn out if it were high. So this won’t be help much.
instructive in various ways, certainly, but not really as to the range of ECS.
Response to an earlier version by Andrew Dessler is informative.
https://www.dropbox.com/s/wr7nr8m4v4kwhc8/BatesResponse.docx?dl=0
TE: “ECS is really higher than this, there must be an acceleration.”: as far as I remember the adjustment should be fast if the ECS were low but very drawn out if it were high. So this won’t be help much.
Only if the unproven postualte that large adjustments are slow is correct.
Compounding one unproven theory by adding another is similarly unhelpful.
SOD: The statement below seems somewhat dubious. Stocker et al 2013 is AR5 WG1, so the evidence (possibly a primary source) can be found somewhere in 1000 pages.
“From a mitigation point of view, the difference between an ECS of 1.5 K and 4.5 K corresponds to about a factor of two in the allowable CO2 emissions for a given temperature target [Stocker et al., 2013] ”
A 3X difference in ECS is a 3X, not a 2X, difference in equilibrium warming. So the authors must be referring to the transient warming from doubling CO2. The most common TCR for models (mode) is 1.8 K/doubling. A warming of 1.8 K isn’t a catastrophe.
ECS = F_2x * (dT/(dF-dQ))
dT = ECS * (dF-dQ)/F_2x
So models with high ECS must have greater ocean heat uptake (dQ) to make warming (dT) increase by only 2X while ECS increases by 3X. However, ECS is physically independent of ocean heat uptake: ECS is determined by the increase in net flux across the TOA with rising temperature (climate feedback parameter). A 1 W/m2/K increase is an ECS of 3.7 K/doubling while 2 W/m2/K is an ECS of 1.85 K/doubling. The physics of heat transport below the mixed layer has no connection with the physics of heat transport across the TOA, so this appears to be tuning.
Frank,
A late reply on your comment – I haven’t dug into the data on this one but I think it is a different point than the one you make.
I phrase it like this:
– if we want to keep warming under 2K from pre-industrial levels and ECS=4.5K then we can only emit Y Gt of CO2.
– if we want to keep warming under 2K from pre-industrial levels and ECS=1.5K then we can emit 2Y Gt of CO2.
The relationships aren’t linear so it’s definitely plausible. I haven’t checked.
SoD wrote: “The relationships aren’t linear so it’s definitely plausible. I haven’t checked.”
That was my thought. But the non-linearity takes it in the wrong direction: twice as much CO2 is less than twice as much warming.
I want to add that as far as i understand it, the feedback theory as portrayed by Bates has actually be developed with the assumption of linearity, that is constant
coefficients in the transfer and feedback functions.
This corresponds to the thermodynamic “linear regime” where Prigogines Entropy Minimisation Principle holds. But fluid systems don’t behave linearly in a meaningful way. Nonlinearities make instabilities possible (convection, eddies, hurricanes) that simply shortcut any linear processes and thus speed up dissipation. The Maximum Entropie Production Principle covers this and this has been shown to hold for the earths atmosphere.
So there’s no reason to expect the coefficients in those transfer functions to be constant. The tendency should be to increase the dissipation rate with the gradient (forcing) which should result in a rather low ECS.
There are actually people who try to model things this way. To get “scientifically correct” results they have to (re)introduce constraints to dissipation. If I remember it right an early simple model without constraints found an ECS of 0.6°C.
From Mauritsen, Stevens, et al, “Tuning the Climate of a Global Model”, 2012.
“One of the few tests we can expose climate models to, is whether they are able to represent the observed temperature record from the dawn of industrialization until present. Models are surprisingly skillful in this respect [Räisänen, 2007], considering the large range in climate sensitivities among models – an ensemble behavior that has been attributed to a compensation with 20th century anthropogenic forcing [Kiehl, 2007]: Models that have a high climate sensitivity tend to have a weak total anthropogenic forcing, and vice-versa. A large part of the variability in inter-model spread in 20th century forcing was further found to originate in different aerosol forcings. It seems unlikely that the anti-correlation between forcing and sensitivity simply happened by chance. Rational explanations are that 1) either modelers somehow changed their climate sensitivities, 2) deliberately chose suitable forcings, or 3) that there exists an intrinsic compensation such that models with strong aerosol forcing also have a high climate sensitivity. Support for the latter is found in studies showing that parametric model tuning can influence the aerosol forcing [Lohmann and Ferrachat, 2010; Golaz et al., 2011]. Understanding this complex is well beyond our scope, but it seems appropriate to linger for a moment at the question of whether we deliberately changed our model to better agree with the 20th century temperature record.”
This I think tells us roughly that GCM’s with high ECS have to have unrealistically high negative anthropogenic aerosol forcing to give realistic 20th Century warming. In other words, the aerosol model can be used to keep a model with high ECS from appearing falsified by the 20th Century temperature record. Another vindication of something Lindzen has been saying for at least a decade.
that GCM’s with high ECS have to have unrealistically high negative anthropogenic aerosol forcing
Seem to be inserting your own biases there. Nothing in the text suggested those higher negative aerosol forcing magnitudes were unrealistic.
The obvious problem with the idea that large negative aerosol forcing magnitude is simply a retroactive “fix” in order to fit historical observations is that aerosol models which weren’t being used for historical simulations were producing essentially the same numbers for indirect aerosol effects back in the 1990s. If anything CMIP5 aerosol indirect effects appear to be generally slightly weaker than are seen in more dedicated full-featured aerosol GCM simulations.
As noted in Isaac Held’s post on tuning, the best empirical match in terms of matching cloud behaviour would have produced a stronger negative aerosol forcing than featured in the CMIP5 version of the model. If there was tuning to fit historical temperature trends the direction was to weaken the effect, not strengthen it.
The much-vaunted correlation between aerosol forcing and ECS reported for CMIP3 was really all about which models did (AF ~ -1 to -1.5W/m2) and didn’t (AF ~ -0.1 to -0.5W/m2) include aerosol indirect effects. It turned out that models which included indirect effects tended to have the highest climate sensitivities. It could be that decision making about whether or not to include indirect effects was influenced by knowledge of the model climate sensitivity. It could be that choices affecting climate sensitivity were made in the knowledge that they were/weren’t including indirect effects. But either way, the indirect effects included were comfortably realistic in comparison to independent estimates.
Of course, that correlation seems to have disappeared in CMIP5, with some lower sensitivity models including indirect effects and some higher sensitivity models omitting them.
paulski0 wrote: “Nothing in the text suggested those higher negative aerosol forcing magnitudes were unrealistic.”
Many models use aerosol forcing that is unrealistic in comparison with satellite data.
paulski0 wrote: “The obvious problem with the idea that large negative aerosol forcing magnitude is simply a retroactive “fix” in order to fit historical observations is that aerosol models which weren’t being used for historical simulations were producing essentially the same numbers for indirect aerosol effects back in the 1990s.”
In the 90’s, aerosol forcing was very poorly constrained. When modelers started to include it in models, they treated aerosol forcing as a tunable parameter that could bring the models (which were obviously running hot) into line with observations. They managed to simultaneously solve two problems: bringing the overall warming in line with observations and explaining why the SH was warming more than the NH. Killing two birds with one stone convinced the modellers that they had the right stone.
But in this century, satellite data has constrained aerosol forcing to values that are inconsistent with what is needed to match high sensitivity models to observation, especially considering the pause. And the hemispherical asymmetry has, I think, turned out to be a transient (maybe someone else here can confirm). So it seems that both dead birds got up and flew away. But many models still use the larger magnitude aerosol forcing.
SoD claims that climate science is a real science with people asking the proper questions and addressing them in a scientific manner. He is correct. Others claim that climate science is heavily politicized, with people warping what they do to accord with the political program. They are correct. It is a mixture of both, with one being relatively more predominant in the primary literature and the other predominating in public statements and the IPCC.
MikeN, I would argue that climate science is right up there with medicine in terms of low quality work and undisclosed political and activist interests. As in any field, there are many good and honest scientists, but it really is hard to resist the culture of keeping your job even if it means omitting adverse data or simply ignoring it.
Outsiders cannot appreciate the immense pressures generated by the huge growth of the science workforce and the rapid decrease in truly “hard money” funding. It’s an appalling development over the last 30 years. The Economist article is a good start. Bear in mind that when the official organs of science such as Nature and the Lancet admit there is a serious problem, there is a serious problem. My experience is that its worse than those publications are willing to admit.
If you want to see what is going on look at the senior or retired scientists. They no longer have large groups to support. One can easily list at least 10 senior scientists who are prominent skeptics.
My own experience is that our leading Universities are really getting shockingly poor in terms of the quality of their work in CFD. There is a lot of “selling,” colorful fluid dynamics, selecting only “good looking” results. The soft money culture has brought to imminence those who can support hordes of graduate students and postdocs and that means bringing in multimillions every year. I’m not going to name any names, but even a passing acquaintance with the literature will reveal a lot of selection bias.
Steve McIntyre’s recent post on comparing GCM’s and temperature data illustrates the problem in climate science. “Selecting” the data or an output measure you want to use can dramatically influence the result. People of course know that and its shameful that someone like McIntyre seems to be necessary to point it out.
I inadvertently replied to Paulski0’s comment in the wrong place. It’s below.
Mike M,
In the 90’s, aerosol forcing was very poorly constrained.
It still is, and indirect effects in CMIP3 and CMIP5 models are/were consistent with independent estimates.
Many models use aerosol forcing that is unrealistic in comparison with satellite data.
In total magnitude, no. Not any in CMIP5 anyway. There are certain aspects of aerosol-cloud interaction modelling in most standard GCMs which satellite data suggests are wrong, Liquid Water Path response being the main one, in a direction which appears to cause too much negative forcing (a good example of simple empirical models going wrong). Though Cloud-Resolving Models – independent models which aren’t used for historical simulations – produce realistic LWP response while still having an indirect effect magnitude similar to the CMIP5 average.
There are also aerosol responses identified in satellite data which GCM aerosol models seem to underestimate compared to satellite data, such as change in cloud fraction. There are also processes such as described here which have been observed using a specific use of satellite data, but the consequences of which may not be captured by standard satellite-based correlation studies due to the time-evolving nature of the phenomenon.
But in this century, satellite data has constrained aerosol forcing to values that are inconsistent with what is needed to match high sensitivity models to observation
No, it hasn’t. If there were a simple strong constraint supplied by satellite data, why do you think Bjorn Stevens abandoned satellite data in favour of a simplistic linear inverse model when arguing for a change in the lower bound from the -1.9 reported in AR5?
I wrote: “In the 90’s, aerosol forcing was very poorly constrained.”
paulski0 wrote: “It still is, and indirect effects in CMIP3 and CMIP5 models are/were consistent with independent estimates.”
I wrote: “Many models use aerosol forcing that is unrealistic in comparison with satellite data”
paulski0 wrote: “In total magnitude, no.”
That is only if you ignore actual observational data and replace it with models.
In AR4, the satellite range was –1.7 to –0.1 W m–2 (as cited in AR5), in AR5 it is -0.45 to -0.95. That is a significant tightening of the range. For models, AR4 gave –2.3 to –0.2 W m–2, which was not too much wider than observational data available at the time. But in AR5, the model range is -0.6 to -2.4 which extends far beyond the constraint based by the observations.
—————
I wrote: “But in this century, satellite data has constrained aerosol forcing to values that are inconsistent with what is needed to match high sensitivity models to observation.”
paulski0 wrote: “No, it hasn’t. If there were a simple strong constraint supplied by satellite data, why do you think Bjorn Stevens abandoned satellite data in favour of a simplistic linear inverse model when arguing for a change in the lower bound from the -1.9 reported in AR5?”
Because there is no satellite data from early in the 20th century. What matters is actually the difference between aerosol forcing now and aerosol forcing in the past. That can not be larger in magnitude than forcing now, but it can be much smaller. Stevens argues that the forcing pre-1950 was larger than what is used in the models, making the change smaller.
Mike M,
In AR4, the satellite range was –1.7 to –0.1 W m–2
No, those figures refer to a range based on inverse methods, not satellite data.
in AR5 it is -0.45 to -0.95.
Those figures are not as reported in the original papers. They’ve been substantially altered partly by ‘ignoring actual observational data and replacing it with models’. There was a mysterious +0.2W/m2 longwave adjustment applied to most of those estimates which was described as coming from a model range, though it’s never cited what model range exactly.
There were further alterations involving at best questionable choices, always in the direction of making them less negative. For example, the smallest estimate in your quoted range relates to Quaas et al. 2008. The actual paper gives observational estimates for the direct effect and first indirect effect, totalling -1.1W/m2 (-0.9 and -0.2 respectively). Based on the Chapter 7 stated method they should have taken that, added assessed “rapid adjustment” effects of -0.2, then added that model longwave adjustment, resulting in a final -1.1W/m2 estimate. Instead they completely removed the direct effect estimate, replacing it with the AR5 best estimate, and neglected to account for it only being only a first indirect effect estimate, resulting in a stated figure of -0.45W/m2.
(Should note that study was replicated a few years ago with an elongated data period. The stated result in their abstract was a total effect of -0.93W/m2, though with a more negative first indirect effect of -0.34. In fact that first indirect effect is outside the stated uncertainty of the original paper despite it using the same method, which makes clear most of the uncertainty estimates in satellite-based studies are extremely minimal considerations of potential error. In the replication paper itself they run basic sensitivity tests, simply swapping in two other estimates of anthropogenic aerosol fraction. That change alone resulted in a range of -0.89 to -1.6W/m2 total (-0.37 to -0.76W/m2 first indirect effect) over a consistent time period, with the abstract estimate at the least negative end.)
Near the other end of the stated AR5 satellite range, Sekiguchi et al. 2003 actually gave a multi-faceted satellite-based indirect estimate of -1.2 to -0.6 (including longwave effect) plus a direct effect of -0.4W/m2 (over ocean). It should have been reported with a best estimate of -1.3, perhaps -1.4W/m2 to account for rapid adjustment effects. Instead it was reported as -0.93W/m2. Why isn’t clear at all. Nearest I could figure is that the Chapter 7 authors ignored the stated central value and instead added a total shortwave estimate of -1.4 to a very large longwave effect of +0.87W/m2, even though Sekiguchi et al. explicitly stated that was a maximum possible upper bound.
While satellite data constraints do appear to make the strongest negative model aerosol forcings (e.g. that -2.4W/m2 lower bound) very unlikely, none of the models in CMIP5 are near that level, and appear to very much consistent with satellite data overall.
Just to make sure paulski0 that you read the entire thing:
“A large part of the variability in inter-model spread in 20th century forcing was further found to originate in different aerosol forcings. It seems unlikely that the anti-correlation between forcing and sensitivity simply happened by chance.”
More on the Iris Effect:
Revisiting the iris effect of tropical cirrus clouds with TRMM and A-Train satellite data
A new paper of Nic Lewis and Judy Curry could be of interest: https://journals.ametsoc.org/doi/10.1175/JCLI-D-17-0667.1 . More here: https://www.nicholaslewis.org/wp-content/uploads/2018/04/LC18_LewisCurry_The-impact-of-recent-forcing-and-ocean-heat-uptake-data-on-estimates-of-climate-sensitivity_2018_article1d.pdf .
Discussion is open at Judy’s and CA.
I love that this blog page exists. For an ardent scientific skeptic such as myself, who doesn’t have a very strong background in climate science, it’s really a gift to have a place to go for rational discussion of legitimate scientific issues relating to climate change
I first discovered this site years ago, when I was investigating whether there was any merit to the argument that Earth’s atmosphere was already “saturated” w.r.t. IR absorption, and that adding more GHGs would have no further warming effect. (It was this question, I believe, that gave birth to this site in the first place.)
Petroleum geologists, such as myself are, for the most part, ill-prepared to tackle this sort of question–both from the standpoint of lacking the appropriate knowledge base as well as being burdened with (in many cases) incapacitating cognitive bias. These limitations did not prevent many of my colleagues from reaching a strongly held conclusion that the “saturated gassy argument” was valid. Of course, at the same time, just for “good measure”, they also believed a great many other things about climate science, ALL of which (by sheer coincidence, I’m sure) seemed to show that AGW is false. In any case, I found your treatment of the topic to be of immense value, and I cannot recall whether I ever wrote to thank you, so I’m doing that now.
I’ve just now “re-discovered” the site by way of investigating the very intriguing question of whether the “Iris Effect” might actually provide a significant “negative feedback” in controlling the escape of outgoing energy at infrared wavelengths, thus reducing, or at least prolonging, the Equilibrium Climate Sensitivity to anthropogenic GHGs. I admit that my past experience in researching claims purporting to “disprove” AGW, predisposes me to thinking that ANY such arguments are probably false, so it does take some conscious effort to maintain an open and skeptical mind… and I find the re-invigorated “Iris Effect” hypothesis quite interesting. At this point, I find the “silence” of the climate science community to be intriguing. Should I read anything into that or not? Maybe they just feel it’s already been dealt with, although that doesn’t seem likely. I look forward to hearing more about it in the future.
At the same time, I think the comment of Victor Venema very important…
at least from my own perspective and experience.
When I first became dragged in the climate change “controversy” on behalf of the American Association of Petroleum Geologists, I tried–ultimately unsuccessfully–to argue that we had an legitimate and important role to play in approaching AGW with a skeptical eye, but that we were squandering that responsibility by allowing dogmatism and (extreme) bias to cloud our view. I still feel that way, and very resentful that a relatively small number of ideologues were able to “hijack” the entire organization to promote their own perspectives.
In this regard, and for the same reasons, I have found the (far too numerous) comments by dpy6629 to pose an immense distraction from the scientific discussion. It breaks the continuity by bringing in a worldview–and one that I am WAY too familiar with–that is not entirely rooted in objective reality. It’s difficult enough for a non-expert to follow all the points being raised without these distractions. What’s more, it’s my impression that there is an ABUNDANCE of alternative web sites where these sorts of alternative perspectives are the norm, and would be arguably a more appropriate place to raise them. I’m not suggesting that this issue requires attention, but simply wanted to offer my perspective on how it is perceived by an “outsider”.
Thanks very much,
Jeffrey R. Levine, Ph.D. Geologist
The Vostock core appears to show a ECS of 10.7 (Delta-T is a
about 2 to -8 while Delta-CO2 is 325 to 175, more or less. This is twice Charney/IPCC’s high value of 4.5 — but I haven’t found any discussion of this. What am I missing?