I have just been looking at the GPCC dataset, using Matlab to extract and plot monthly data for different time periods including comparisons. I’d like to compare actual with the output of various climate models over similar time periods – and against future simulations under different scenarios.
Have any readers of the blog done this? If so I’d appreciate a few tips having run into a few dead ends.
What I’m looking for – monthly gridded surface precipitation.
GPCC has 0.5ºx0.5º and 2.5ºx2.5º datasets that I’ve downloaded so the same gridded output from models would be wonderful.
I have found:
– The CMIP5 Data is now available through the new portal, the Earth System Grid – Center for Enabling Technologies (ESG-CET), on the page http://esgf-node.llnl.gov/
– https://www.wcrp-climate.org/wgcm/references/IPCC_standard_output.pdf
Table A1a: Monthly-mean 2-d atmosphere or land surface data (longitude, latitude, time:month).
CF standard_name; output; variable name; units; notes –
precipitation_flux; pr; kg m-2 s-1; includes both liquid and solid phases.
So I think this is what I am looking for.
– https://www.ipcc-data.org/sim/gcm_monthly/AR5/Reference-Archive.html gives a list of different experiments within each climate model. For example – the MPI model, I expect that historical and rcp.. are the ones I want. I would have to dig into MPI-ESM-LR and -MR which I assume are different model resolutions.
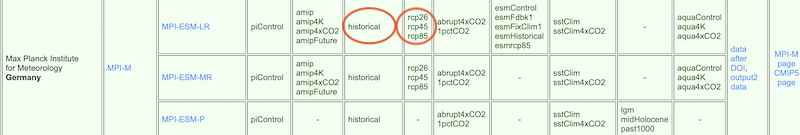
But when I work my way through the portal, e.g. https://esgf-data.dkrz.de/search/cmip5-dkrz/ I find a bewildering array of options and after hopefully culling it down to just monthly rainfall from the MPI-LR model, there are 213 files:
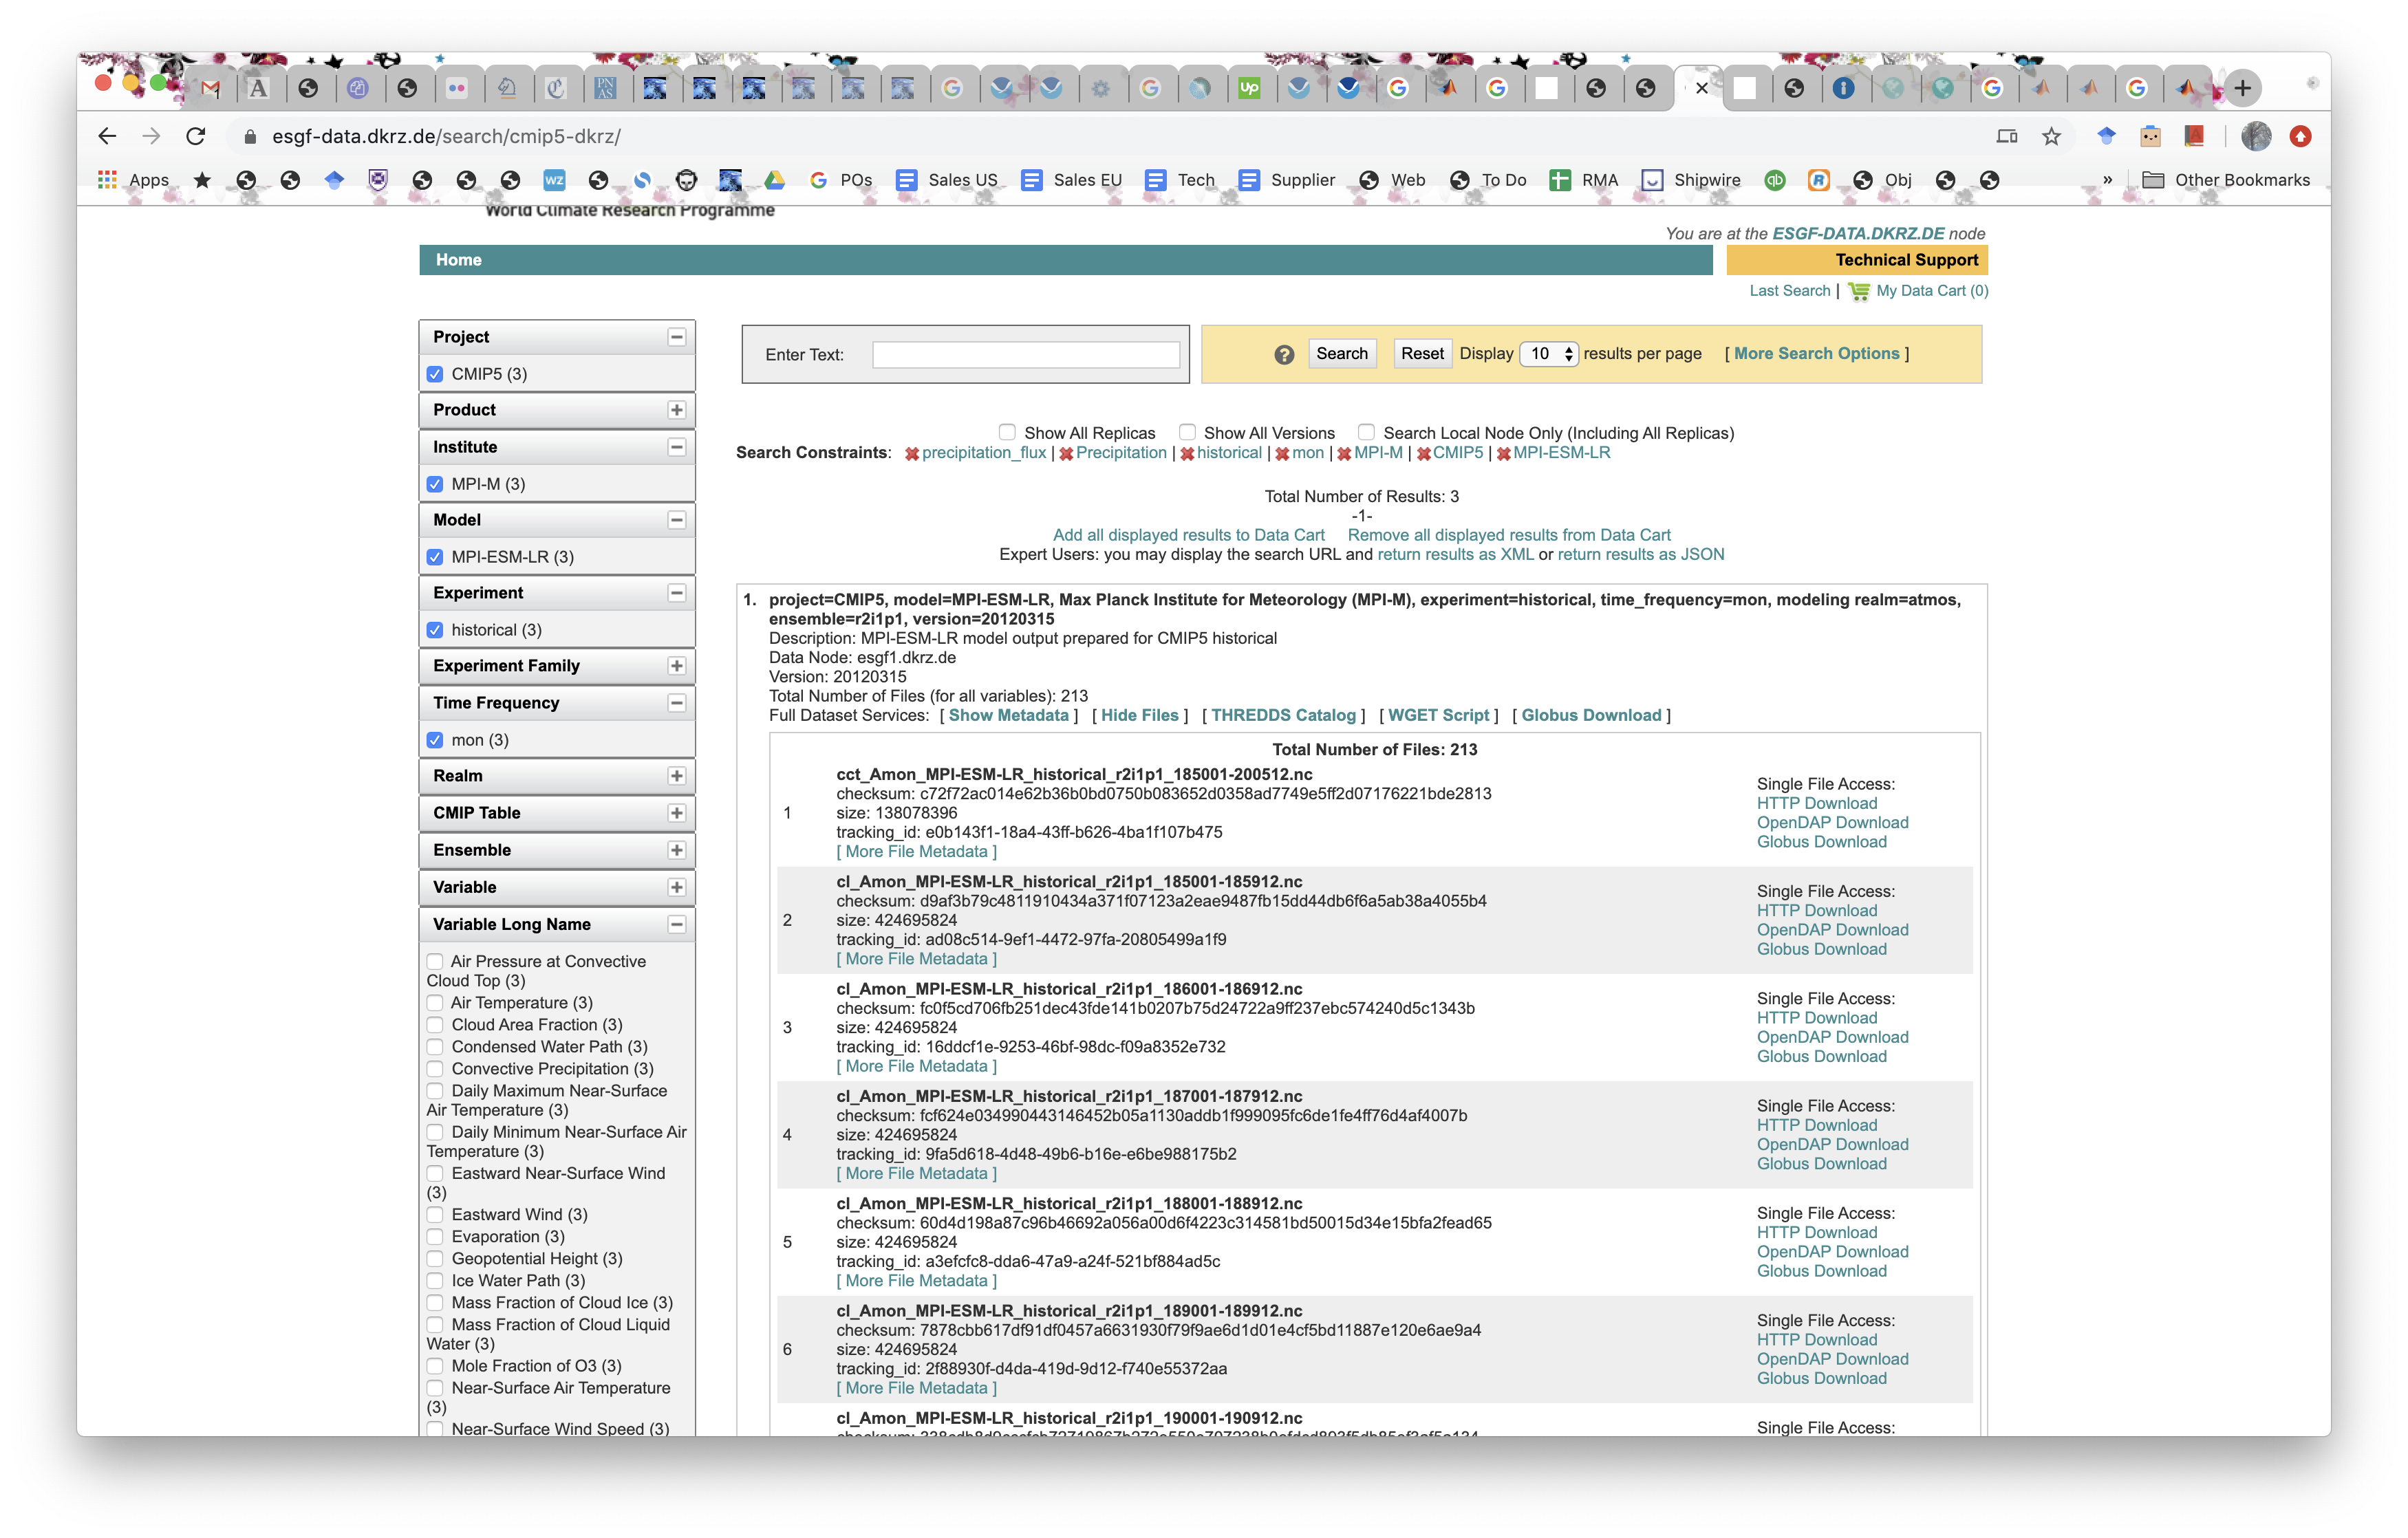
I can easily imagine spending 100+ hours trying to establish which files are correct, trying to verify.. So, if any readers have the knowledge it would be much appreciated.
————
Just for interest, here are a few graphs produced from GPCC using Matlab. I checked a couple of outputs against samples produced from their website and they seemed correct.
I set the max monthly rainfall on the color axis to increase contrast for most places in the world – 4 different 10-year periods:
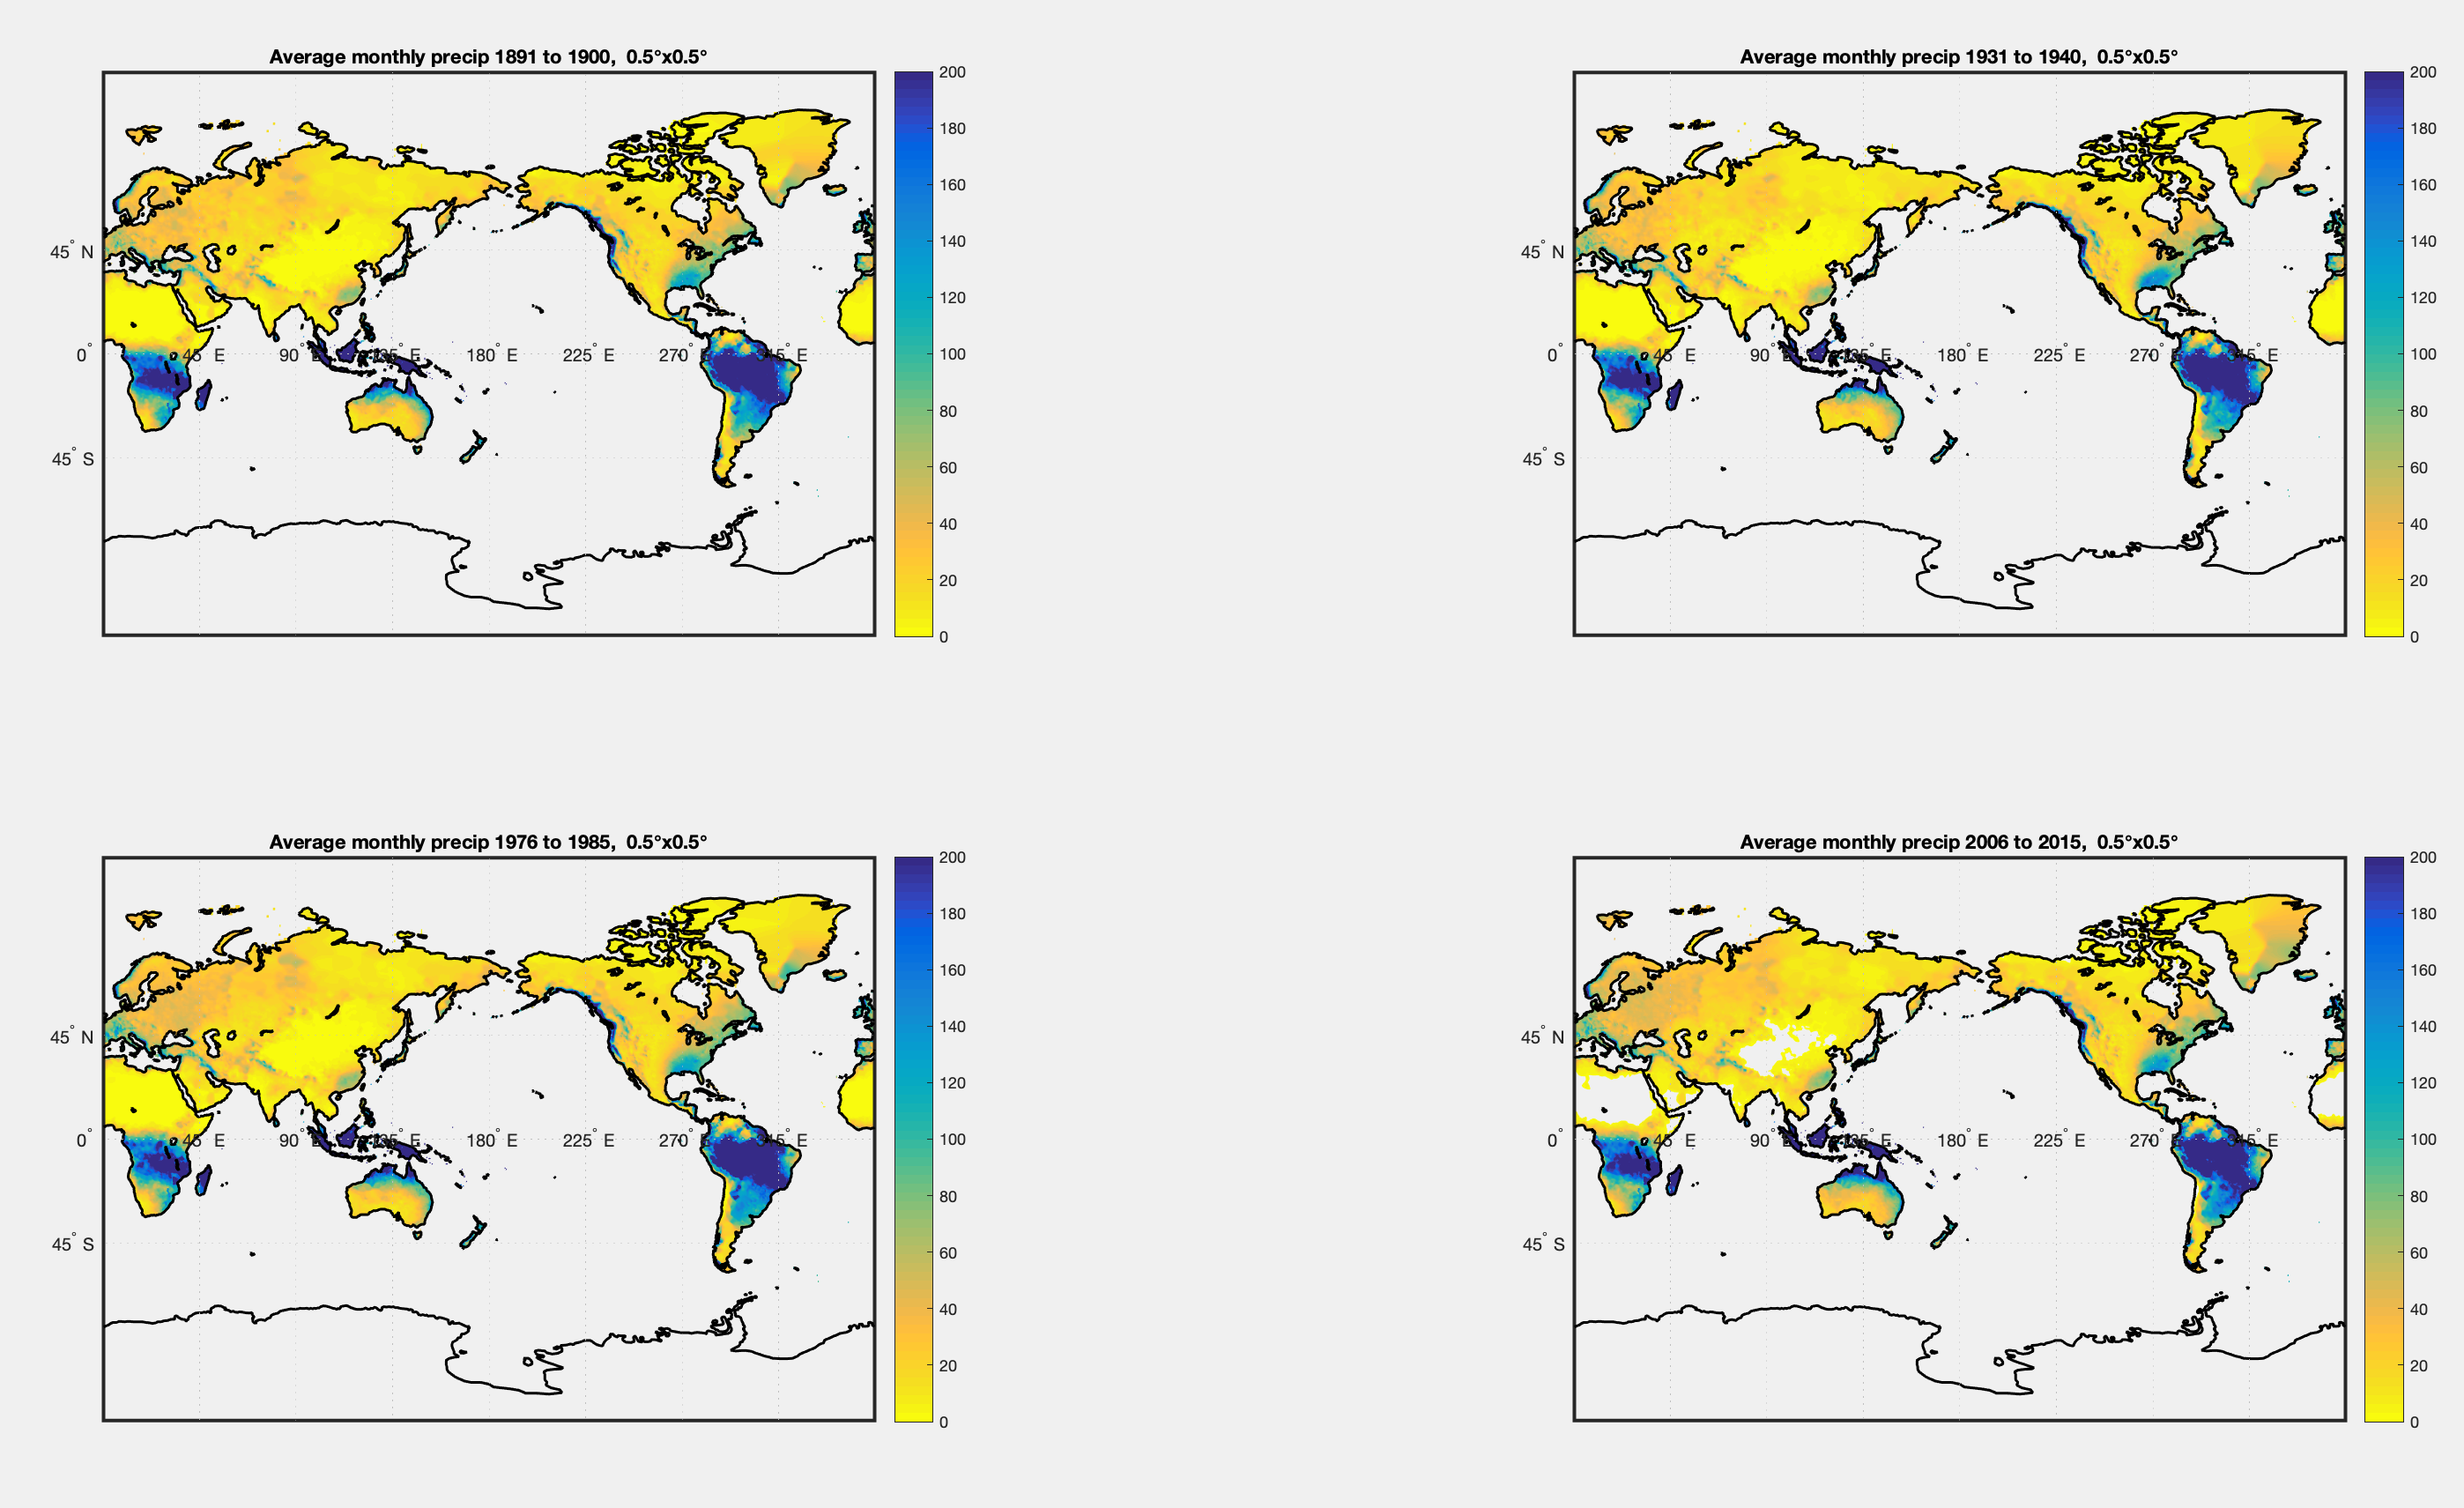
GPCC Precipitation data provided by the NOAA/OAR/ESRL PSL, Boulder, Colorado, USA, from their Web site at https://psl.noaa.gov/
And a delta, % difference:
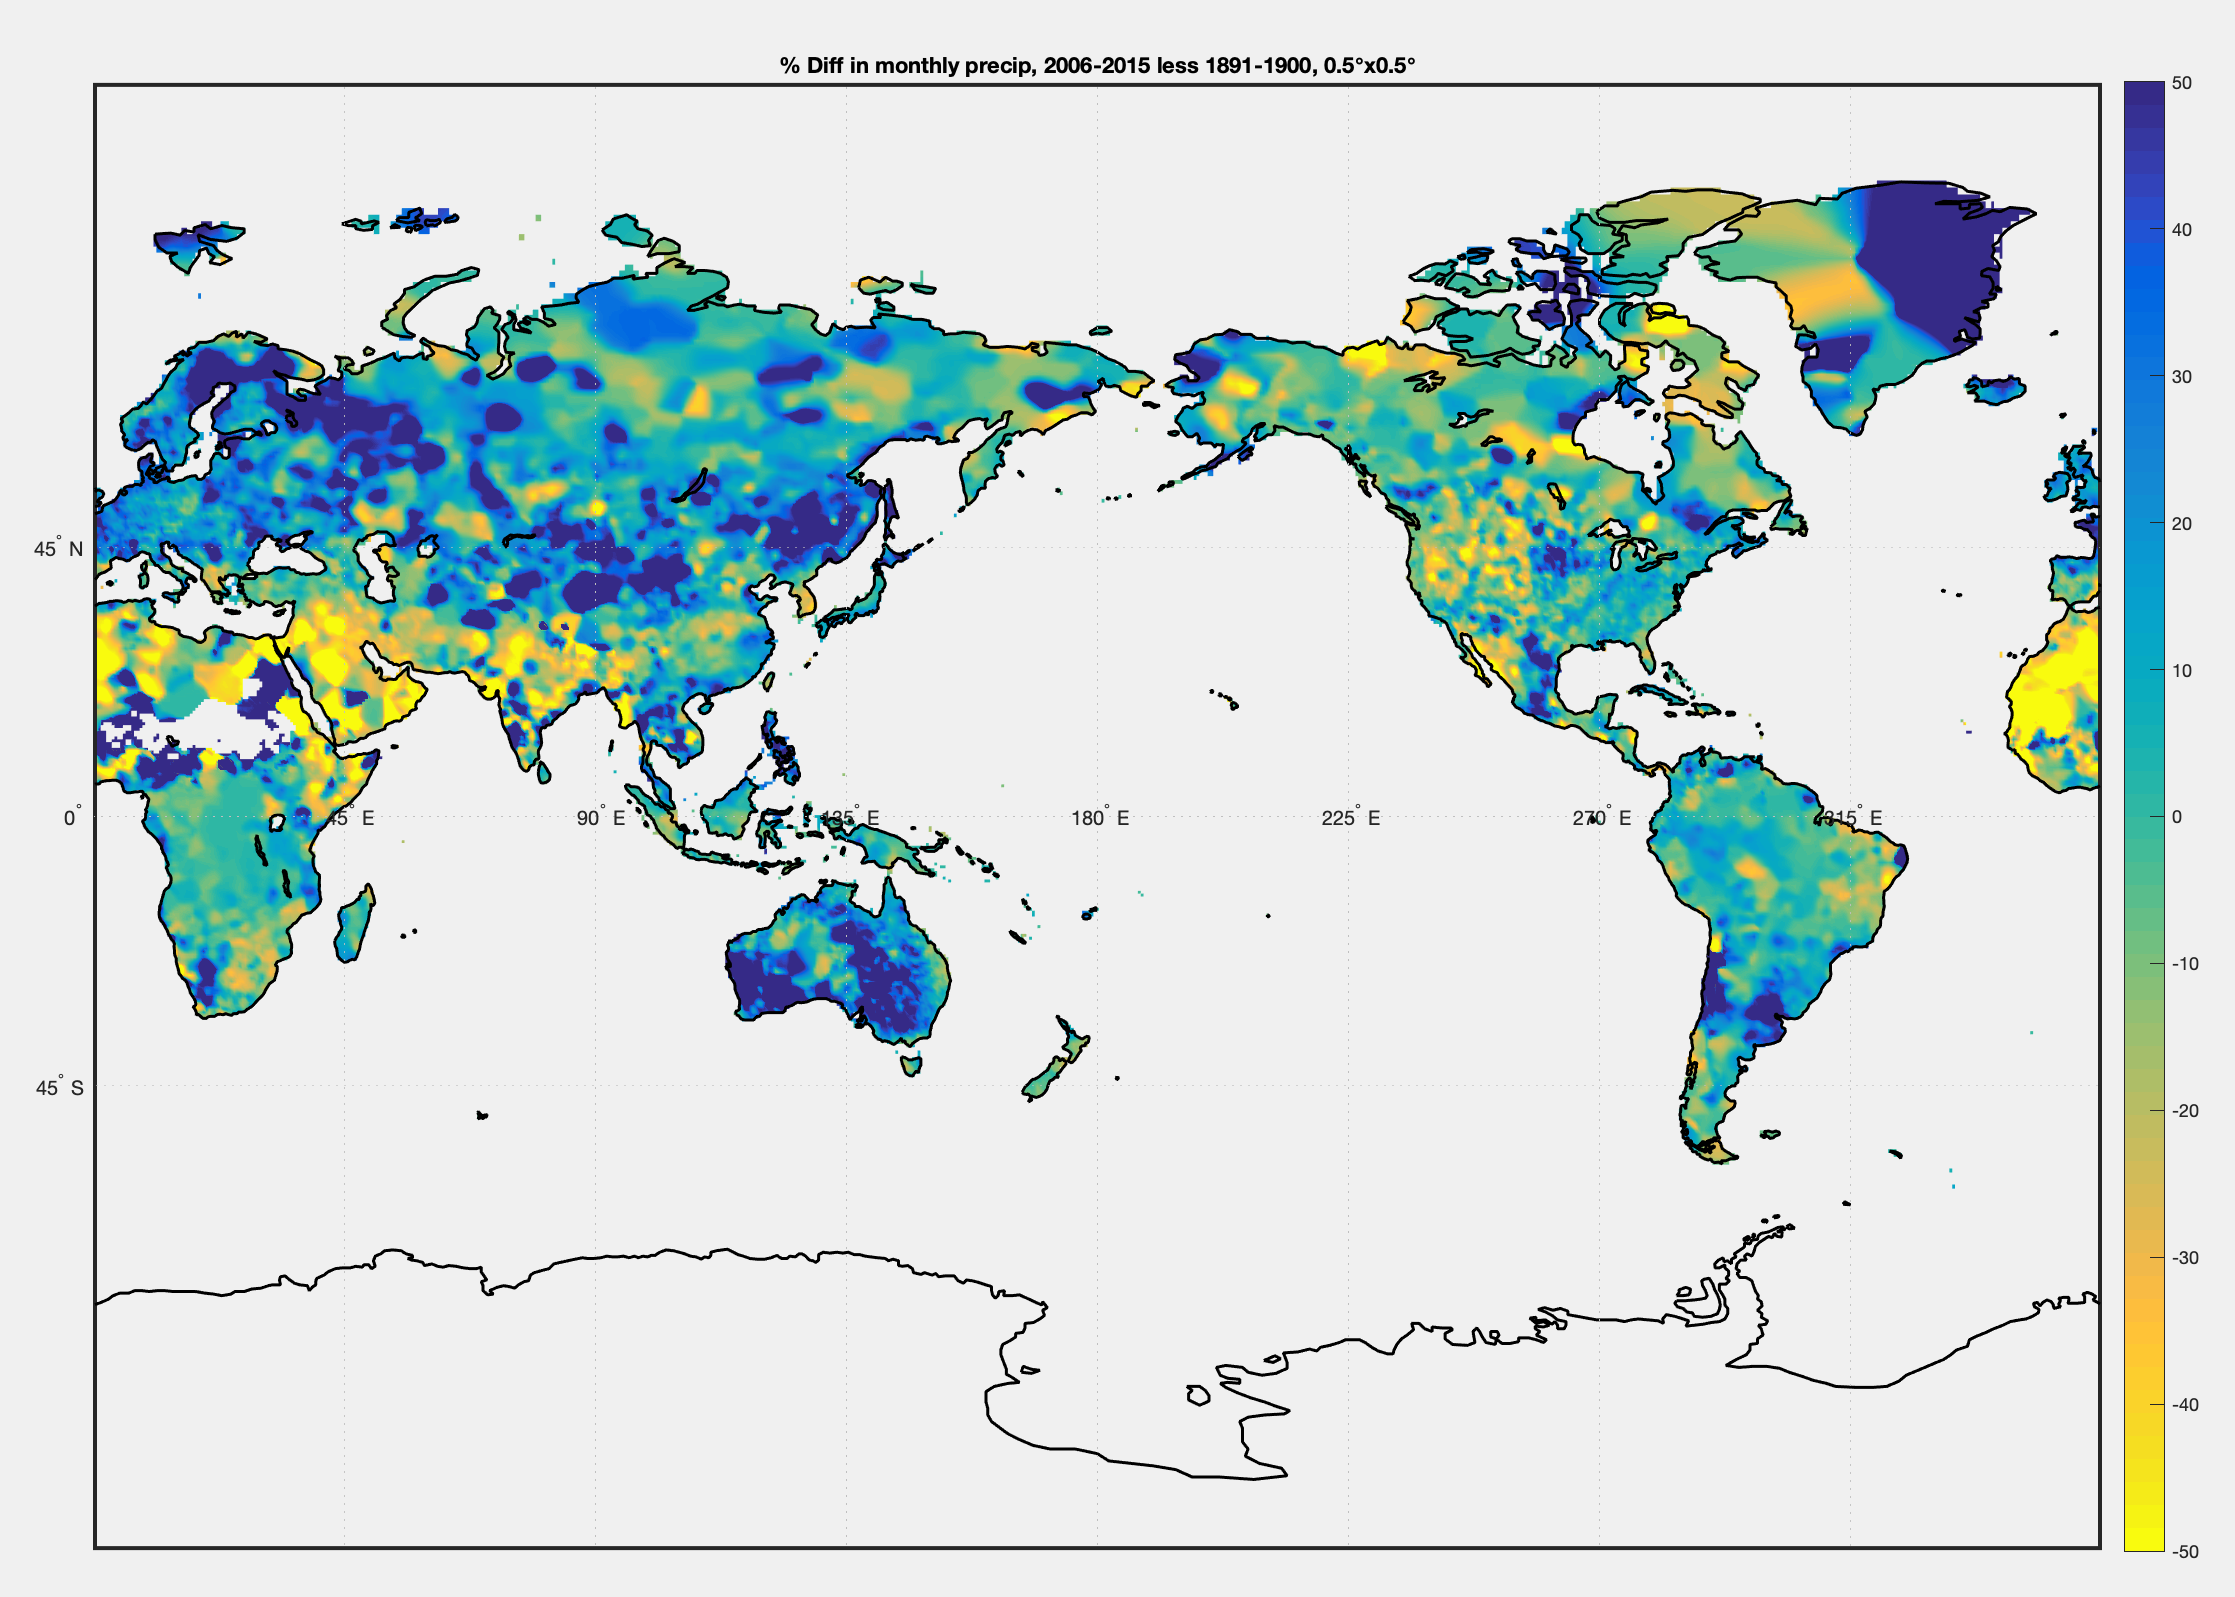
GPCC Precipitation data provided by the NOAA/OAR/ESRL PSL, Boulder, Colorado, USA, from their Web site at https://psl.noaa.gov/


Keep an eye on filenames: the first bit is the variable. The standard naming is variable_grid_model_scenario_run_period.nc. Your screenshot contain variables cct (convective cloud top pressure) and cl (I think cloud fraction?), you probably want something like: pr_Amon_MPI-ESM-LR_historical_r1i1p1_185001-200512.nc.
The “grid” choice in this case would be Amon (atmospheric monthly), and the “run” bit is just an identifier tracking run number, initalisation choice and parameterisation. So r1i1p1 just means the first choice of all of those, and r2i1p1 would be the same model and initialisation but just another run.
ESGF can get a bit funky: if you make it generate a wget script you can usually work out the file conventions and just modify that to get what you want in future.
Going by your 213 figure you have everything selected as you want on the left side. The additional secret step you can take is click More Search Options at the top right, type your chosen variable short-form (e.g. “pr”) into the filter Filename box. Now only pr files should appear.
MarkR & paulski0,
Thanks. It seems that the search doesn’t actually search within certain items.
Redoing:
Search Constraints: historical | mon,monClim | pr | CMIP5 | MPI-ESM-LR
I get 3 ensembles:
ensemble=r2i1p1
ensemble=r1i1p1
ensemble=r3i1p1
– and within each there are 213 files, it isn’t filtering out “pr”. No idea why, but doesn’t matter
So down my list of 213 files, #90 in the file list seems correct:
pr_Amon_MPI-ESM-LR_historical_r2i1p1_185001-200512.nc
Likewise for the other 3 ensembles.
—
Anyone know the difference between convective_precipitation_flux and precipitation_flux?
Here’s a first comparison of GPCC data and one of the MPI model runs over the same period. GPCC is land only whereas the model produces land & ocean. I have to regrid to do a proper comparison.
GPCC:
MPI model:
This is assuming I haven’t done anything dumb, always possible..
The model outputs are in SI – kg/(m^2s), whereas GPCC is in mm/month.
I calculate that 1 kg/(m^2s) = 2.63 x 10^6 mm/month. Let’s hope I got that right..
You need high spatial resolution to resolve convection and its cumulus clouds* so GCMs parameterise convection. For everything else, the physics happens on larger scales, papers tend to call that part “large scale” or sometimes “stratiform”. Here’s a paper playing with the large-scale physics:
https://journals.ametsoc.org/doi/10.1175/JCLI-D-14-00103.1
For what you’re doing the answer is probably “just use pr”.
Your scaling looks right for the annual average. Common terminology is that r1i1p1, r2i1p1, r3i1p1 are “runs” or “simulations” rather than “ensembles” (e.g. MPI has an ESM “Grand Ensemble” which is effectively runs r1i1p1 through r100i1p1).
It looks like you’re ready to get stuck in and have encountered ESGF’s main “interesting” feature. Good luck!
*~4 km iirc? This isn’t my area, you can look up “convection permitting” models if your curiosity is overwhelming.
Thanks for the help, much appreciated.
Easy to burn lots of time getting introduced to large datasets.
If you want something to compare to, this site has CMIP3, 5, and 6 pattern performance data for individual models including precipitation.
http://webext.cgd.ucar.edu/Multi-Case/CMAT/index.html
Hi, this is late reply but it might help someone else. I was also having the same issue when trying to filter precipitation on ESGF (any node). The only solution I could find is to add all the data to the cart, then on My cart select all the data and add the keyword “pr” to the search bar (use an optional string to sub-select the filenames).
Also, when using wget scripts to download the data, you need to download and run every wget file from every node, since each of them contain different data.