In XII – Rainfall 2 we saw the results of many models on rainfall as GHGs increase. They project wetter tropics, drier subtropics and wetter higher latitude regions. We also saw an expectation that rainfall will increase globally, with something like 2-3% per ºC of warming.
Here is a (too small) graph from Allen & Ingram (2002) showing the model response of rainfall under temperature changes from GHG increases. The dashed line marked “C-C” is the famous (in climate physics) Clausius–Clapeyron relation which, at current temperatures, shows a 7% change in water vapor per ºC of warming. The red triangles are the precipitation changes from model simulations showing about half of that.
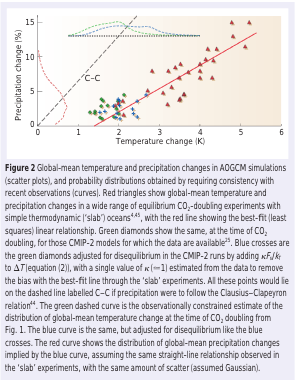
From Allen & Ingram (2002)
Figure 1
Here is another graph from the same paper showing global mean temperature change (top) and rainfall over land (bottom):
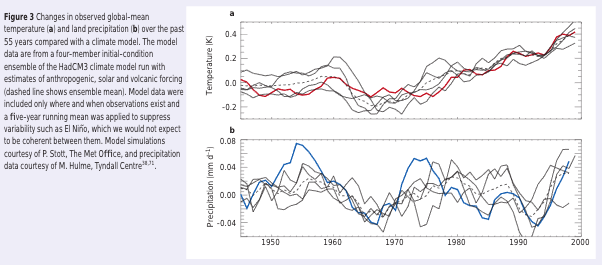
From Allen & Ingram (2002)
Figure 2
The temperature has increased over the last 50 years, and models and observations show that the precipitation has.. oh, it’s not changed. What is going on?
First, the authors explain some important background:
The distribution of moisture in the troposphere (the part of the atmosphere that is strongly coupled to the surface) is complex, but there is one clear and strong control: moisture condenses out of supersaturated air.
This constraint broadly accounts for the humidity of tropospheric air parcels above the boundary layer, because almost all such parcels will have reached saturation at some point in their recent history. Physically, therefore, it has long seemed plausible that the distribution of relative humidity would remain roughly constant under climate change, in which case the Clausius-Clapeyron relation implies that specific humidity would increase roughly exponentially with temperature.
This reasoning is strongest at higher latitudes where air is usually closer to saturation, and where relative humidity is indeed roughly constant through the substantial temperature changes of the seasonal cycle. For lower latitudes it has been argued that the real-world response might be different. But relative humidity seems to change little at low latitudes under a global warming scenario, even in models of very high vertical resolution, suggesting this may be a robust ’emergent constraint’ on which models have already converged.
They continue:
If tropospheric moisture loading is controlled by the constraints of (approximately) unchanged relative humidity and the Clausius-Clapeyron relation, should we expect a corresponding exponential increase in global precipitation and the overall intensity of the hydrological cycle as global temperatures rise?
This is certainly not what is observed in models.
To clarify, the point in the last sentence is that models do show an increase in precipitation, but not at the same rate as the expected increase in specific humidity (see note 1 for new readers).
They describe their figure 2 (our figure 1 above) and explain:
The explanation for these model results is that changes in the overall intensity of the hydrological cycle are controlled not by the availability of moisture, but by the availability of energy: specifically, the ability of the troposphere to radiate away latent heat released by precipitation.
At the simplest level, the energy budgets of the surface and troposphere can be summed up as a net radiative heating of the surface (from solar radiation, partly offset by radiative cooling) and a net radiative cooling of the troposphere to the surface and to space (R) being balanced by an upward latent heat flux (LP, where L is the latent heat of evaporation and P is global-mean precipitation): evaporation cools the surface and precipitation heats the troposphere.
[Emphasis added].
Basics Digression
Picture the atmosphere over a long period of time (like a decade), and for the whole globe. If it hasn’t heated up or cooled down we know that the energy in must equal energy out (or if it has only done so only marginally then energy in is almost equal to energy out). This is the first law of thermodynamics – energy is conserved.
What energy comes into the atmosphere?
- Solar radiation is partly absorbed by the atmosphere (most is transmitted through and heats the surface of the earth)
- Radiation emitted from the earth’s surface (we’ll call this terrestrial radiation) is mostly absorbed by the atmosphere (some is transmitted straight through to space)
- Warm air is convected up from the surface
- Heat stored in evaporated water vapor (latent heat) is convected up from the surface and the water vapor condenses out, releasing heat into the atmosphere when this happens
How does the atmosphere lose energy?
- It radiates downwards to the surface
- It radiates out to space
..end of digression
Changing Energy Budget
In a warmer world, if we have more evaporation we have more latent heat transfer from the surface into the troposphere. But the atmosphere has to be able to radiate this heat away. If it can’t, then the atmosphere becomes warmer, and this reduces convection. So with a warmer surface we may have a plentiful potential supply of latent heat (via water vapor) but the atmosphere needs a mechanism to radiate away this heat.
Allen & Ingram put forward a simple conceptual equation:
ΔRc + ΔRT = LΔP
where the change in radiative cooling ΔR, is split into two components: ΔRc that is independent of the change in atmospheric temperature; and ΔRT that depends only on the temperature
L = latent heat of water vapor (a constant), ΔP = change in rainfall (= change in evaporation, as evaporation is balanced by rainfall)
LΔP is about 1W/m² per 1% increase in global precipitation.
Now, if we double CO2, then before any temperature changes we decrease the outgoing longwave radiation through the tropopause (the top of the troposphere) by about 3-4W/m² and we increase atmospheric radiation to the surface by about 1W/m².
So doubling CO2, ΔRc = -2 to -3W/m²; prior to a temperature change ΔRT = 0; and so ΔP reduces.
The authors comment that increasing CO2 before any temperature change takes place reduces the intensity of the hydrological cycle and this effect was seen in early modeling experiments using prescribed sea surface temperatures.
Now, of course, the idea of doubling CO2 without any temperature change is just a thought experiment. But it’s an important thought experiment because it lets us isolate different factors.
The authors then consider their factor ΔRT:
The enhanced radiative cooling due to tropospheric warming, ΔRT, is approximately proportional to ΔT: tropospheric temperatures scale with the surface temperature change and warmer air radiates more energy, so ΔRT = kΔT, with k=3W/(m²K)..
All this is saying is that as the surface warms, the atmosphere warms at about the same rate, and the atmosphere then emits more radiation. This is why the model results of rainfall in our figure 2 above show no trend in rainfall over 50 years, and also match the observations – the constraint on rainfall is the changing radiative balance in the troposphere.
And so they point out:
Thus, although there is clearly usable information in fig. 3 [our figure 2], it would be physically unjustified to estimate ΔP/ΔT directly from 20th century observations and assume that the same quantity will apply in the future, when the balance between climate drivers will be very different.
There is a lot of other interesting commentary in their paper, although the paper itself is now quite dated (and unfortunately behind a paywall). In essence they discuss the difficulties of modeling precipitation changes, especially for a given region, and are looking for “emergent constraints” from more fundamental physics that might help constrain forecasts.
A forecasting system that rules out some currently conceivable futures as unlikely could be far more useful for long-range planning than a small number of ultra-high-resolution forecasts that simply rule in some (very detailed futures as possibilities).
This is a very important point when considering impacts.
Conclusion
Increasing the surface temperature by 1ºC is expected to increase the humidity over the ocean by about 7%. This is simply the basic physics of saturation. However, climate models predict an increase in mean rainfall of maybe 2-3% per ºC. The fundamental reason is that the movement of latent heat from the surface to the atmosphere has to be radiated away by the atmosphere, and so the constraint is the ability of the atmosphere to do this. And so the limiting factor in increasing rainfall is not the humidity increase, it is the radiative cooling of the atmosphere.
We also see that despite 50 years of warming, mean rainfall hasn’t changed. Models also predict this. This is believed to be a transient state, for reasons explained in the article.
References
Constraints on future changes in climate and the hydrologic cycle, MR Allen & WJ Ingram, Nature (2002) – freely available [thanks, Robert]
Notes
1 Relative humidity is measured as a percentage. If the relative humidity = 100% it means the air is saturated with water vapor – it can’t hold any more water vapor. If the relative humidity = 0% it means the air is completely dry. As temperature increases the ability of air to hold water vapor increases non-linearly.
For example, at 0ºC, 1kg of air can carry around 4g of water vapor, at 10ºC that has doubled to 8g, and at 20ºC it has doubled again to 15g (I’m using approximate values).
So now imagine saturated air over the ocean at 20ºC rising up and therefore cooling (it is cooler higher up in the atmosphere). By the time the air parcel has cooled down to 0ºC (this might be anything from 2km to 5km altitude) it is still saturated but is only carrying 4g of water vapor, having condensed out 11g into water droplets.


And then there’s “event attribution science” if science it is
https://papers.ssrn.com/sol3/papers.cfm?abstract_id=2929159
One minor point on the notes – as the air rises and the pressure drops the holding capacity of water per kg will actually increase at a given temperature because the holding capacity is really a volumetric phenomenon. At 2km the pressure is ~0.8 atm and at 5km it is ~0.5 atm, which would put the water it can hold up to 5g or 8g at 0C respectively, and reducing the condensed water to 10g or 7g from the original kg of air.
This paper: http://images.remss.com/papers/rsspubs/Wentz_Science_2007_more_rain.pdf
suggests satellite measured rainfall (through 2007) had increased in parallel with atmospheric moisture, contrary to model predictions. My recollection was that Ben Santer was not amused, and later published a paper with Wentz and/or Mears that said something like: “we are not that certain about the rainfall measurements… maybe the models are right.” Unfortunately, I don’t have a reference for the later paper.
Steve: When Wentz found that precipitation was rising about 7%/K, he used Version 2 of the Global Precipitation Climatology Project for precipitation data. Version 2.1 found that there had been a much smaller increase in precipitation – roughly in line with model projections. The link below discusses the changes in Version 2.1, but not its relevance to Wentz’s paper. IIRC, there was a second paper explaining the importance of Version 2.1 for Wentz’s conclusion, but I can’t locate that paper.
http://onlinelibrary.wiley.com/doi/10.1029/2009GL040000/full
In Version 2.0, the increase in precipitation over land was 4X bigger than the increase over the ocean and the global increase was 2.4X bigger than the increase over the ocean alone (where satellite sensors alone measure rainfall. In V2.1, these differences are smaller.
They are up to version 2.3 now.
SOD
Several times you say “the atmosphere has to be able to radiate this heat away”.
It is my understanding that super cooled water droplets can act as radiating bodies for their own heat. I acquired this view from radiation studies of the top of thunderheads, which I can probably track down if it seems important. If true, would this change anything in your view?
4KX3
4kx3,
Condensed water radiates heat very effectively. This is taken into account in heat transfer models (this includes GCMs) of the surface-atmosphere – so this would not change anything in the article.
As water vapor condenses (in the colder atmosphere higher up) it releases heat to the atmosphere – we call this convection (it is the most significant part of convective heat transfer from the surface to the atmosphere).
This is taken into account in heat transfer models
Always worth remembering the difference between the abstract physics and the concrete model. Models don’t resolve droplets or even clouds, but parameterize grid points. And there’s no ground truth to the results, so the process is invalid and we can’t know by how much.
Turbulent Eddie,
Let’s say you want to work out the radiative forcing from increasing CO2 (or another GHG) in the atmosphere.
It is straightforward to do it – so long as you use a specified temperature profile in the atmosphere, specified humidity, specified clouds, and so on.
For example, the calculation could be done with the current climate. (Or, more detailed, the calculation could be done repeatedly in each grid point, using the current climate in each grid point, and then averaging the result).
At this stage, there is no requirement on being able to calculate the turbulent flow in the atmosphere over months, years, decades. You have simply done the calculation on the basis of “all other things remaining equal” or “condition X”.
Similarly, you can calculate the same results over a reasonable range of climatologies and see how the results vary – how sensitive they are to these changes.
It’s like that with calculating the radiative cooling from the atmosphere and also using the amount of condensed water in clouds. We can simply look at the current measurements for example.
Calculating radiative forcing results doesn’t necessitate the solution to the turbulent flow in the atmosphere. That is, we can get useful values without solving one of the most difficult physics problems currently known.
SoD, what’s implicit is change to rainfall, and with it evaporation and condensation. Change is not a matter of all else being equal, but unfortunately, accurately predicting all the unpredictable dynamics which determine condensation,clouds, and precipitation. The double ITCZ failure is a pretty good example.
SOD wrote above: “Increasing the surface temperature by 1ºC is expected to increase the humidity over the ocean by about 7%. This is simply the basic physics of saturation.” However, only a modest portion of the atmosphere is saturated with water vapor. 7% is only true if relative humidity remains constant, and it isn’t obvious that relative humidity will remain constant anywhere
In the long-term, evaporation and precipitation must be equal. The rate of evaporation depends on wind speed and under-saturation of the boundary layer over the ocean. Neither of these factors produces a 7%/K increase.
Added to that: your paragraphs are two different points. You can have constant or changing relative humidity, and you can have 1 % or 7 % precip change.
Intuition says that global humidity and precip should change in the same way, but it doesn’t have to.
Frank,
As the atmosphere increases by 1K, the saturation vapor pressure increases by 7%.
So immediately over the surface of the ocean we will have an increase of 7% of water vapor. (Relative humidity = 100%, Specific humidity increases by 7%).
The impact on the hydrological cycle can only be determined by the atmospheric dynamics and also how they change.
In that sense you are correct.
And so are MR Allen & WJ Ingram, and all the other climate scientists who have thrown themselves at this problem, because everyone knows this is the challenge.
I may not have expressed this very well in the article.
“Constraints on future changes in climate and the hydrologic cycle, MR Allen & WJ Ingram, Nature (2002) – paywall paper”
A pdf of the paper can be found here:
Click to access ce0e685b6e259ae89ad2c75d26c127c4c4a8.pdf
Robert,
Thanks, I’ve added this to the article
Doesn’t Allen and Ingram’s Figure 2 (SOD’s Figure 1) look suspicious, if not wrong? It shows an x-intercept at 1.5 K, meaning no increase in precipitation up to 1.5 K and then a linear increase above that point? Given that this is CMIP2 data from the primitive days of slab oceans and a need for flux adjustments during model spin up, I question whether we can learn anything reliable from this graph.
I’m NOT saying that the broad conclusion of your post is in doubt. Precipitation can’t increase with Ts at the same C-C rate (7%/K) as saturation vapor pressure. However, I disagree with part of your conclusion about a transient state:
“We also see that despite 50 years of warming, mean rainfall hasn’t changed. Models also predict this. This is believed to be a transient state, for reasons explained in the article.”
After evaporating, the average water molecule remains in the air for only 9 days. In temperate zones, we experience seasonal warming of 10 K or more, which doubles the amount of water vapor in the air every summer and halves it every winter. IMO, it is absurd to believe that the lag between surface warming and the expected increase in precipitation is at least a quarter-century – as suggested by their Figure 3 (your Figure 2). In that figure, a 1% change in precipitation is 0.027 mm/d and the full change of the vertical axis is about 5%. The warming between 1975 and 2000 was about 0.4 K. If one expects precipitation to increase 2-3%/K, that would be a 1% increase in precipitation. I’m content believing that unforced variability in precipitation and our inability to accurately measure the change in precipitation over a quarter-century makes it impossible to detect the expected change in precipitation. I don’t believe it proves there is a multi-decade delay between warming and an increase in precipitation.
IMO (FWIW), this paper seems to be a lot of handwaving about important phenomena we couldn’t accurately observe nor properly model at that time. The same may be true today. Wentz (2007) found an increase in about 7%/K, but revisions of the observed precipitation record since then have lowered this figure. Wentz used global precipitation records from satellite observations combined with rain gauges on land.
It is well known that models get precipation wrong over great areas, so what is the value of speculations based on them?
It should be precipitation. The complexity is great, and parameters are uncertain. All systematic bias in models has consequenses for simulation of precipitation change.
Frank,
That’s an OLS linear fit. There is little reason to believe the behavior is linear at low temperature change. Then go back and look at the model predicted absolute temperature. The range is several degrees. So the model zero isn’t really zero. Then there’s this:
There’s also hand waving and worse, references to Rahmstorff, on the effect of increased precipitation on the THC that completely ignores that the North Atlantic Gyre is not driven primarily by the THC. Circulation, i.e. the Gulf Stream, wouldn’t stop unless the trade winds also stopped.
Speaking of Rahmstorff, I would like to see how Vermeer and Rahmstorff’s 2009 paper on estimating future sea level rise holds up to the satellite data through 2016. Eyeballing the graphs, I don’t think it would look very good. Their data showed measured sea level rise in 2000 as 3.4mm/year and accelerating rapidly. The Topex/Poseidon data shows a constant rate of ~3.4mm/year from the mid 1990’s into 2017.
DeWitt: The rate of the increase in precipitation with temperature is intimately connected with climate sensitivity. To the extent that climate sensitivity is linear, one might expect a linear relationship between between increasing temperature and increasing precipitation. I’ll expand in a separate comment.
Frank,
Yeah, probably.
But the offset itself is caused by the models not getting precipitation right in the first place. Part of the reason for that is that most models have incorrect absolute temperature. If you converted the precipitation numbers to anomalies, the offset would be hidden, just like the temperature offset.
Frank,
It can depend on the forcing, as well as temperature change. Not sure about this specific graph but I’m not surprised because it’s shown in other studies.
For example, more soot in the air causes global warming. But if you add a chunk of it to a model then it immediately heats the air, which suppresses precipitation. It takes time before the later warming brings precip levels back.
Climate sensitivity is intimately connected with the increase in precipitation with rising surface temperature: The larger the increase, the lower climate sensitivity must be. (The consensus doesn’t express the relationship this clearly.)
According to the KT diagram, convection carries about 100 W/m2 of heat from the surface to the atmosphere. About 80 W/m2 is latent heat of evaporation and the liquid water that released the heat returns to the surface as precipitation. Simple heat probably moves in parallel with convection. So a 1%/K increase in precipitation is associated with about a 1 W/m2/K increase in heat transfer from the surface to the atmosphere. (This is why SOD tell us above: “LΔP is about 1W/m² per 1% increase in global precipitation.”) However, at steady state, that heat can’t remain in the atmosphere; it eventually must result in 1 W/m2/K more LWR escaping to space. (This is why SOD tell us that convection is limited by the rate at which convected heat can escape as radiation from the upper troposphere to space.)
The rate at which radiative cooling to space increases with surface temperature is called the climate feedback parameter (a), and it includes both emission of LWR and reflection of SWR. If a = 1 W/m2/K, ECS would be 3.7 K/doubling (roughly in agreement with AOGCMs). If a = 2 W/m2/K, ECS would be 1.8 K/doubling (roughly in agreement with EBMs). If a = 3 W/m2/K, ECS would be 1.2 K/doubling (roughly no-feedbacks climate sensitivity). If a = 7 W/m2/K, ECS would be 0.5 K/doubling.
So, if precipitation increases only 1%/K of surface warming, ECS can be 3.7 W/m2 – even if there is no change in reflected SWR. However, if precipitation increases 2%/K, then we need an addition 1 W/m2/K of SWR to be absorbed so that the net flux across the TOA only increases by 1 W/m2/K. Since 100 W/m2 of SWR is reflected by the planet, that requires 1%/K less reflection of SWR. If precipitation increased 7%/K, 6%/K less SWR would need to be reflected for ECS to be 3.7 K/doubling. Changes this large in albedo with Ts are unlikely for a variety of reasons.
(When the surface warms, it also emits more OLR that is mostly absorbed by the atmosphere. However, experiments with MODTRAN show that a 1 K offset in surface temperature produces an increase in DLR that almost completely balances the increase in OLR (assuming constant relative humidity). The atmosphere is so opaque to most thermal IR that net radiative cooling upon warming is negligible.)
Normally we think climate sensitivity is determined by the sum of Planck, WV, LR, cloud and surface albedo feedbacks. The alternative point of view – a surface/TOA perspective – is that climate sensitivity is determined by the increase in precipitation and reflection of SWR with rising surface temperature. It seems surprising that such unrelated phenomena must combine to produce the same climate sensitivity.
If water vapor increases by 7%/K near the surface of oceans, how can precipitation only increase by 2%/K? The rate at which moist air from near the surface is raised to altitudes cold enough to cause condensation must slow. That slowing will increase relative humidity over the oceans, slowing evaporation.
Frank,
Indirect ‘determinations’ of sensitivity, whether by climate model or by analysis of precipitation strike me as fraught with uncertainty, and worse, easily subject to intended or unintended bias. I find simple, observationally based (actual temperatures) EBM calculations far more credible, and essentially immune from bias. Sensitivity above 0.5K/watt-M^2 appears inconsistent with actual measured temperatures.
I agree with you about using EBMs to quantify climate sensitivity. However, I wasn’t trying to quantify climate sensitivity, simply illustrate the importance of a low non-CC increase in precipitation to high or even moderate climate sensitivity. The consensus tell us that atmospheric overturning is projected to slow as the globe warms (difficult to accept intuitively), but they don’t say this is required by the high climate sensitivity of models.
I’ve become accustomed to the idea of Planck, WV, LR, cloud and surface albedo feedbacks, with at least three of these supposedly being fairly well understood (and a fourth believed to be small). The problem is “almost solved”. From the surface/TOA perspective, however, climate sensitivity depends on two things we know climate models reproduce extremely poorly: convection/precipitation and SWR cloud feedback. From this perspective, the problem appears much more challenging.
However, I did read that ultra-high resolution weather forecasting models can now may good predictions about local variation in rainfall – when you get drenched and 10 miles away it is sunny. IIRC (and I may not), I think the grid cells in these ultra high resolution models are 2 km^2.
Here is a thought experiment related to the precipitation issue in this post that I find mystifying: Consider a model Earth with some simplifications. CO2 is the only GHG and its absorption spectrum resembles a combination of water vapor and CO2. Our planet starts with an atmosphere of N2 and O2 with negligible GHE. There is water vapor in the atmosphere, but it is NOT a GHG. Then we start to add CO2 gradually. What happens?
a) DLR starts with the first molecule of GHG added, so surface temperature starts rising then?
b) Eventually enough GHG is added so that pure radiative equilibrium products and unstable lapse rate new the surface? Convection starts.
c) With more GHG, there is more convection and it reaches higher in the atmosphere?
d) On today’s planet, more GHG and higher temperature decreases overturning of the atmosphere. Was there a point of maximum convection between c) and d)?
Frank,
You’ll get convection even with a transparent atmosphere. The surface during the day will still get warmer than the average temperature of the atmosphere above it. The poles will still be colder than the equator, in fact, a lot colder than now with a transparent atmosphere. That temperature difference will drive circulation. The atmosphere will not be isothermal. A lot will depend on the rotation rate.
DeWitt: I partially agree. However, for large scale convection, one requires a large temperature difference between the upper and lower troposphere. During during the diurnal cycle, two meter temperature rises about 10 K, which is enough to produce an unstable lapse rate in the lowest 1.5 km in the atmosphere.
I could redefine the starting conditions to make the temperature of the surface and atmosphere equal to the black-body equivalent temperature for the planet, but there still will be meridional temperature gradients. As Mike suggested below, I’m thinking in 1D terms.
Frank,
I take it that you are assuming a one-dimensional atmosphere for your thought experiment. Or, equivalently, a planet that is uniformly illuminated. Otherwise, as DeWitt says, there will be latitudinal temperature gradients that will drive convection.
Frank asked: “c) With more GHG, there is more convection and it reaches higher in the atmosphere?”
If you ignore convection, you will have an elevation below which the lapse rate exceeds the adiabatic lapse rate. As you add greenhouse gas, that elevation will move upwards. I think that may answer your question.
Frank asked: “d) On today’s planet, more GHG and higher temperature decreases overturning of the atmosphere. Was there a point of maximum convection between c) and d)?”
I don’t think that is correct. In the simplest 1-D models without water vapor, if the pure radiative result gives a lapse rate that exceeds dry adiabatic, then the lapse rate is set to the dry adiabatic value. With water vapor in the atmosphere, the dry adiabatic lapse rate is replaced with an average maximum lapse rate is reduced due to latent heat transfer. But I don’t think that means less convection. I don’t think there is any first principles method of computing the average lapse rate, short of a GCM. And those give widely varying results.
I think that what happens is that with latent heat transfer included, more water vapor means that it is easier to transfer heat from the surface to the emission altitude.
Mike: Thanks for the reply.
Yes, I’m thinking in terms of a 1D model. So, we agree through step c: Rising GHGs increase surface temperature and increase the maximum altitude reached by convection and domain where the lapse rate is controlled by moist adiabatic considerations. I presume that the amount of precipitation must also be increasing
Frank asked: “d) On today’s planet, more GHG and higher temperature decreases overturning of the atmosphere. Was there a point of maximum convection between c) and d)?”
Mike: “I don’t think that is correct.”
Today we live on a planet where increasing GHG is predicted to decrease convective overturning of the atmosphere. If the rate of convective overturning remained constant and wind speed remained constant, then evaporation would rise 7%/K and precipitation would increase at 7%/K. And climate sensitivity almost certainly would be extremely low – for the reasons I described above (the increase in heat flux from the surface to the atmosphere caused by rising Ts is constrained by the flux across the TOA – climate sensitivity).
This is the essential dilemma that bothers me. When we start adding GHGs, convection increases. However, at some point, it appears to reach a maximum and start declining – which is the current situation on our planet. All discussions of precipitation increasing much less than 7%K imply that overturning of the atmosphere is slowing with warming.
I am puzzled by the claim that precipitation has not increased over land. Land areas are warming significantly faster than the ocean. Why is that? I thought it was do\ue to an increasing water vapor cycle. More net evaporation over the ocean and more precipitation over land results in increased latent heat transfer from ocean to land. That reduces warming of the ocean and increases warming over land. But that requires increased precipitation over land.
Mike M.,
I’m pretty sure the land heats faster than the ocean because of the large difference in heat capacity, not precipitation.
DeWitt,
I read a couple of papers a while back analyzing this and it didn’t seem to be – contrary to general expectations – due to heat capacity. Will try and dig them out.
DeWitt,
It is not heat capacity. That would produce a lag in heating of the oceans, after which land and ocean temperature would increase in parallel. But plotting land T vs. ocean T gives an almost perfect straight line with a slope of something like 1.5 (from memory) and no time lag (which would show as curvature in such a plot). The slope is identical during period of rapid warming as during periods of slow warming. There is so little scatter that no statistical analysis is required; that implies very rapid adjustment between the two average temperatures (I think I was using annual data when I did this). Models show the difference applying even at equilibrium.
Some time ago, I searched out papers on the relative warming of land and ocean. They gave a convoluted, confusing explanation. My translation was that the effect is down to latent heat transfer.
The ocean isn’t static horizontally or vertically either. It’s continually transferring heat from low to high latitude. A static model which gives a lag and then the same rate is not necessarily going to be correct.
Mike commented: “I am puzzled by the claim that precipitation has not increased over land.”
The land precipitation record has been revised upward since the time of SOD’s paper and since Wentz (2007).
http://onlinelibrary.wiley.com/doi/10.1029/2009GL040000/full
The GPCP has developed Version 2.1 of its long-term (1979–present) global Satellite-Gauge (SG) data sets to take advantage of the improved GPCC gauge analysis, which is one key input. As well, the OPI estimates used in the pre-SSM/I era have been rescaled to 20 years of the SSM/I-era SG. The monthly, pentad, and daily GPCP products have been entirely reprocessed, continuing to require that the submonthly estimates sum to the monthly. Version 2.1 is close to Version 2, with the global ocean, land, and total values about 0%, 6%, and 2% higher, respectively. The revised long-term global precipitation rate is 2.68 mm/d. The corresponding tropical (25°N-S) increases are 0%, 7%, and 3%. Long-term linear changes in the data tend to be smaller in Version 2.1, but the statistics are sensitive to the threshold for land/ocean separation and use of the pre-SSM/I part of the record.
Frank wrote: “The land precipitation record has been revised upward …”
OK, so it is increasing, as expected. Thanks.
Frank, Mike M. and SoD,
Let’s think about this. Convective heat transfer over the ocean should be mostly latent heat and very little sensible heat. Conversely, heat transfer over land should have a significantly higher fraction of sensible heat transfer contributing to the total convective heat transfer. Over a desert, for example, convective heat transfer will be nearly 100% sensible heat. What that should mean is that ocean surface temperature, even at steady state, should probably be lower than land surface temperature.
I’m betting that the ratio of sensible to latent heat transfer is higher for land than ocean, not the global 1:4 ratio and the ratio of radiative transfer to convective transfer is higher than the global 66:100. For an increase in temperature, then, the land temperature will have to increase faster than the ocean because relatively more energy is radiated than convected. Sensible heat transfer also shouldn’t be very efficient compared to latent heat transfer in terms of cooling the surface.
Btw, rain cools the surface, not heats it. Condensation, i.e. clouds, is what transfers energy to the atmosphere. Clouds don’t have to produce rain.
DeWitt: IMO, there aren’t separate mechanisms for transport of latent and simple heat. Convection transports both sensible heat – “hot molecules” – and latent heat – water vapor molecules. There is a temperature difference (usually small) between the surface and the nearby atmosphere that drives conduction of heat across the air adhering to the surface (where bulk motion doesn’t occur). Water vapor must diffuse across the same gap. The air adhering to the surface is saturated with water vapor, but the bulk air 2 m above the surface of the ocean has 80% relative humidity. Another gradient. Convection moves both once they are across the gap. The ratio of “hot molecules” to water vapor molecules varies with the surface (ocean to desert) and possibly with the wind speed.
Frank,
There aren’t separate mechanisms, both require air movement, but the physics is quite different. Sensible heat transfer requires that the air temperature increases and the heat capacity of dry air isn’t very high. Latent heat transfer doesn’t require a change in temperature, only that the specific humidity increases. The heat of vaporization of water is quite high. So there is no reason for the ratio of sensible to latent heat transfer from convection to be a constant.
DeWitt Payne wrote: “Convective heat transfer over the ocean should be mostly latent heat and very little sensible heat. … What that should mean is that ocean surface temperature, even at steady state, should probably be lower than land surface temperature.”
I guess that you are referring to the contribution to vertical heat transfer. What you say makes some sense. But outside the tropics, condensation mostly occurs far below the emission level, so it should not have too big an effect on net cooling. Of course, the tropics are a big fraction of the Earth’s surface. So what you say may be a factor. But see below.
DeWitt: “…For an increase in temperature, then, the land temperature will have to increase faster than the ocean because relatively more energy is radiated than convected. …”
Yes, but vertical transfer of latent heat reduces the average lapse rate; that would reduce vertical heat transfer. So there is an offsetting of the two effects. It is not clear to me that net vertical heat transfer would increase. Energy balance would seem to require that it remain fixed, with the lapse rate varying as needed to maintain the heat flux. In that case, your mechanism for more heating over land would not be effective.
In any case, there must be net latent heat transfer from the ocean to the land.
DeWitt: “Btw, rain cools the surface, not heats it. Condensation, i.e. clouds, is what transfers energy to the atmosphere. Clouds don’t have to produce rain.”
Condensation to form a cloud releases latent heat, but if the cloud evaporates, the latent heat is re-adsorbed. Only if there is precipitation, or dew, is there a net release of latent heat. Yes, the heat is released at cloud height, but that must eventually heat the surface since there is efficient convection below cloud height (the T difference between ground and cloud is set by the lapse rate). Big thunderstorms could be an exception. Any surface cooling from evaporation following rain is transient and only accounts for a small fraction of the precipitation and latent heat flux.
Mike M.,
It’s not evaporation of rainwater that cools the surface when it rains, it’s the cool water droplets themselves. They don’t absorb much energy when falling through the air below the cloud.
Clouds are effectively blackbodies. The upper cloud surface will radiate some energy directly to space through the ‘window’. At 2km, about 25% of emitted radiation is transmitted to space even in a tropical atmosphere.
Perhaps some nit-picking, But I think Allen & Ingram can be a little lazy in their choice of words. as: “the ability of the troposphere to radiate away latent heat released by precipitation.” and “evaporation cools the surface and precipitation heats the troposphere.”
Precipitation may cause some energy transport in the troposphere, as water droplets fall down, but falling water droplets doesn`t heat the air. I could understand it if they said that condensation heats the atmosphere. Intuitively precipitation influence the air pressure by taking away gases. So the troposphere can be heated if the underpressure is filled with warmer air.
Another energy matter is the freezing of droplets and water vapor. This is also releasing energy. And it can make supersaturation. Looks like that is no part of the equation.
NK,
There isn’t an underpressure on condensation in the atmosphere. It isn’t like a can full of steam surrounded by much cooler air. The energy released from the heat of vaporization causes more than sufficient expansion of the rest of the air to make up for the lost water vapor volume. We went through this several years ago, I forget where, with a Russian scientist who thought hurricanes were driven by the supposed pressure drop from condensation. It doesn’t work that way.
SoD, how does this relate to the massive rainfall associated with hurricane Harvey? It sure seems that a hotter Gulf resulted in more rainfall over land. Is it just a statistical outlier? Is it the beginning of an upward trend in rainfall?
Has anyone made a good argument that the rain was enhanced by gcc? I heard a claim that 30% of rain was because of gcc.
That falls into the category of an unknowable statistic, i.e. it’s a guess not science. Harvey set records for rainfall on the continental US, but the record wasn’t all that much higher than the previous record. Amelia in 1978 dumped 48 inches of rain in Medina, TX. Easy in 1950 dumped 45.2 inches of rain in Yankeetown, FL.
The storm path was the main reason for the high rain total. Predictions of more intense storms from global warming have low confidence.
“Since records began in 1850, no Atlantic hurricane or tropical storm has stalled after landfall for as long as Harvey.” (Robert Rohde on twitter) So it was unprecedented. But it is not a proof of the GHG hypothesis. It stayed for about 10 days over Texas inland, before it went out in the ocean again. So if you can prove that GHG stopped it for 3 days, you have an argument that greenhouse gases caused 30 %. Severe flooding may be a consequence of a stalling rainstorm. An intersting question would be if it would have the same impact if the winds were stonger, or if it would pass by faster.
Kevin,
This article doesn’t really relate at all to the question of storms. This article just explores some fundamental limitations to overall average increases in rainfall in a warmer world.
My one certain prediction is that with a hurricane like this there will be lots of voices saying “it is”. That is, on the question of global warming causing this storm, or making this storm more likely, or making more intense storms more likely in the future.
Storms are complicated. Something we will dive into in future articles.
You can see a little about storms in Impacts – V – Climate change is already causing worsening storms, floods and droughts – and here is one extract from the IPCCs Special Report on Extremes (SREX) from 2012:
Luckily no one in the media reads these heretical reports.
Cliff Mass has an excellent blog post on this going through all the data, the theory, and modeled future trends.
http://cliffmass.blogspot.com/2017/08/global-warming-and-hurricane-harvey.html
Bottom line: No significant effect of warming.
Kevin Dowd wrote: How does this relate to the massive rainfall associated with hurricane Harvey? It sure seems that a hotter Gulf resulted in more rainfall over land. Is it just a statistical outlier? Is it the beginning of an upward trend in rainfall?
How does a hotter Gulf produce 50 inches of rainfall in the Houston area? The temperature of the Gulf has been similar for the past 10 Augusts and 50 inches of rain didn’t fall in Houston. 40 years ago, SSTs in the Gulf averaged perhaps 0.5 degC and hurricane Amelia dumped 48 inches of rain. Contradictory information on whether it was unusually warm in the Gulf before Harvey is circulating, but anything more than 1 degC warming must be due to weather, not climate change. 1 degC causes a 7% increase in saturation water vapor pressure.
Hurricane Harvey differs in one major respect from the 20-30 major hurricanes that form every year. Most hurricanes are moving about 10 mph or 250 miles per day. They come and go in a day or less. Harvey stalled in one location near the coast for several days. That allowed it to keep drawing in moist air from the Gulf and lifting it high enough to condense. Typically clear tropical air contains enough water vapor to produce about 2 inches of rain, if it were all to precipitate. Clearly hurricanes can only produce massive amounts of rainfall over land by importing moist air usually from the ocean. And the rate of evaporation – which is necessary to maintain precipitation – is proportional to wind speed.
So the right question is: Did climate change make hurricane Harvey more likely to stall over Texas? So far, the possibility of hurricane stalling due to climate change hasn’t received much publicity. It certainly will in the future. Those studies will be done with AOGCMs that produce inconsistent predictions about regional climate change and show no skill predicting changes over a decade or two. Due to coarse resolution, those models need to be “seeded” with proto-hurricanes to produce the number of hurricanes we observe today.
[…] A recent and apt example of the inanity of the “Greenhouse Apologists” and their absolute obsession with the confused idea of “sky radiation” somehow constituting extra heat to the ground, even without it actually being “heat” (we’re fine, because we don’t CALL it “heat” [Q], we just call it “energy” [E], thus avoiding any potential problems with the 2nd Law of Thermodynamics (which, after all, deals with “heat”, not “energy”), even though we expect our “energy flux” to produce a thermal effect exactly as if it were an actual “heat flux”, as per the 1st Law), is this gem from the well-known “Greenhouse Apologist” ‘The Science of Doom’ (SoD): […]
Taking this logic to its extreme, would mean hurricanes can’t happen. They would release more heat than could be radiated away and would stop themselves. Obviously, this doesn’t happen in the real world. Hurricanes are very effective heat engines radiating to space. They leave a trail of cooled water behind them. What stops them is either passing into waters too cold or over land where there isn’t enough water and probably more drag.
To put it another way, it isn’t the atmosphere per se that radiates when water condenses, it’s the cloud tops
DeWitt; SoD
It turns out that condensing water is not just an efficient radiator, it is a superradiator with emissivities greater than 1.5 in the viscinity of 12 microns.
First Order Phase Transitions as Radiation Processes
Vitali A. Tatartchenko*, Pavel V. Smirnov, Yong Wu
Click to access OPJ_2013121109053764.pdf
Maybe Makarieva was onto something after all.
It made sense to me, “over a sufficiently length period”.
The negative feedback mechanism (to prevent more rainfall) is the warmer troposphere, limiting more water vapor being convected up from the surface.
I’m not so sure it isn’t an artefact of the coarse grid and parameterization of convection in models. From what I understand, GCM’s aren’t all that different from one dimensional R/C models. When the lapse rate for a grid cell becomes unstable, it’s adjusted back to stability over the entire 10,000 km² grid cell. Convection in the real world isn’t that uniform. In an area that size one would expect to find a number of regions where the air is rising and others where it’s falling.
[…] bad factions on both sides of this hurricane, claims Trump * Tamino has a different perspective * Impacts – XIII – Rainfall 3 by SoD, featuring Ingram (see-also Moyhu). * Climate change and inequality: The rich pollute, the […]
You write that the radiated heat from the atmosphere decrease by some W/m² from increasing co2 by some amount. If the emission of heat is less from Möre co2, that means the atmosphere cools. You can’t get more heat(higher temperature) from less heat emission. Just look at the s-b equation. Adding heat absorbers to a constant limited heat flow can only result in less energy per heat absorber, less energy means lower temperature.