I generally try and avoid the media as much as possible (although the 2016 Circus did suck me in) but it’s still impossible to miss claims like the following:
Climate change is already causing worsening storms, floods and droughts
Before looking at predictions for the future I thought it was worth reviewing this claim, seeing as it is so prevalent and is presented as being the current consensus of climate science.
Droughts
SREX 2012, p. 171:
There is medium confidence that since the 1950s some regions of the world have experienced more intense and longer droughts (e.g., southern Europe, west Africa) but also opposite trends exist in other regions (e.g., central North America, northwestern Australia).
The report cites Sheffield and Wood 2008 who show graphs on a variety of drought metrics from around the world over the last 50 years – click to enlarge:
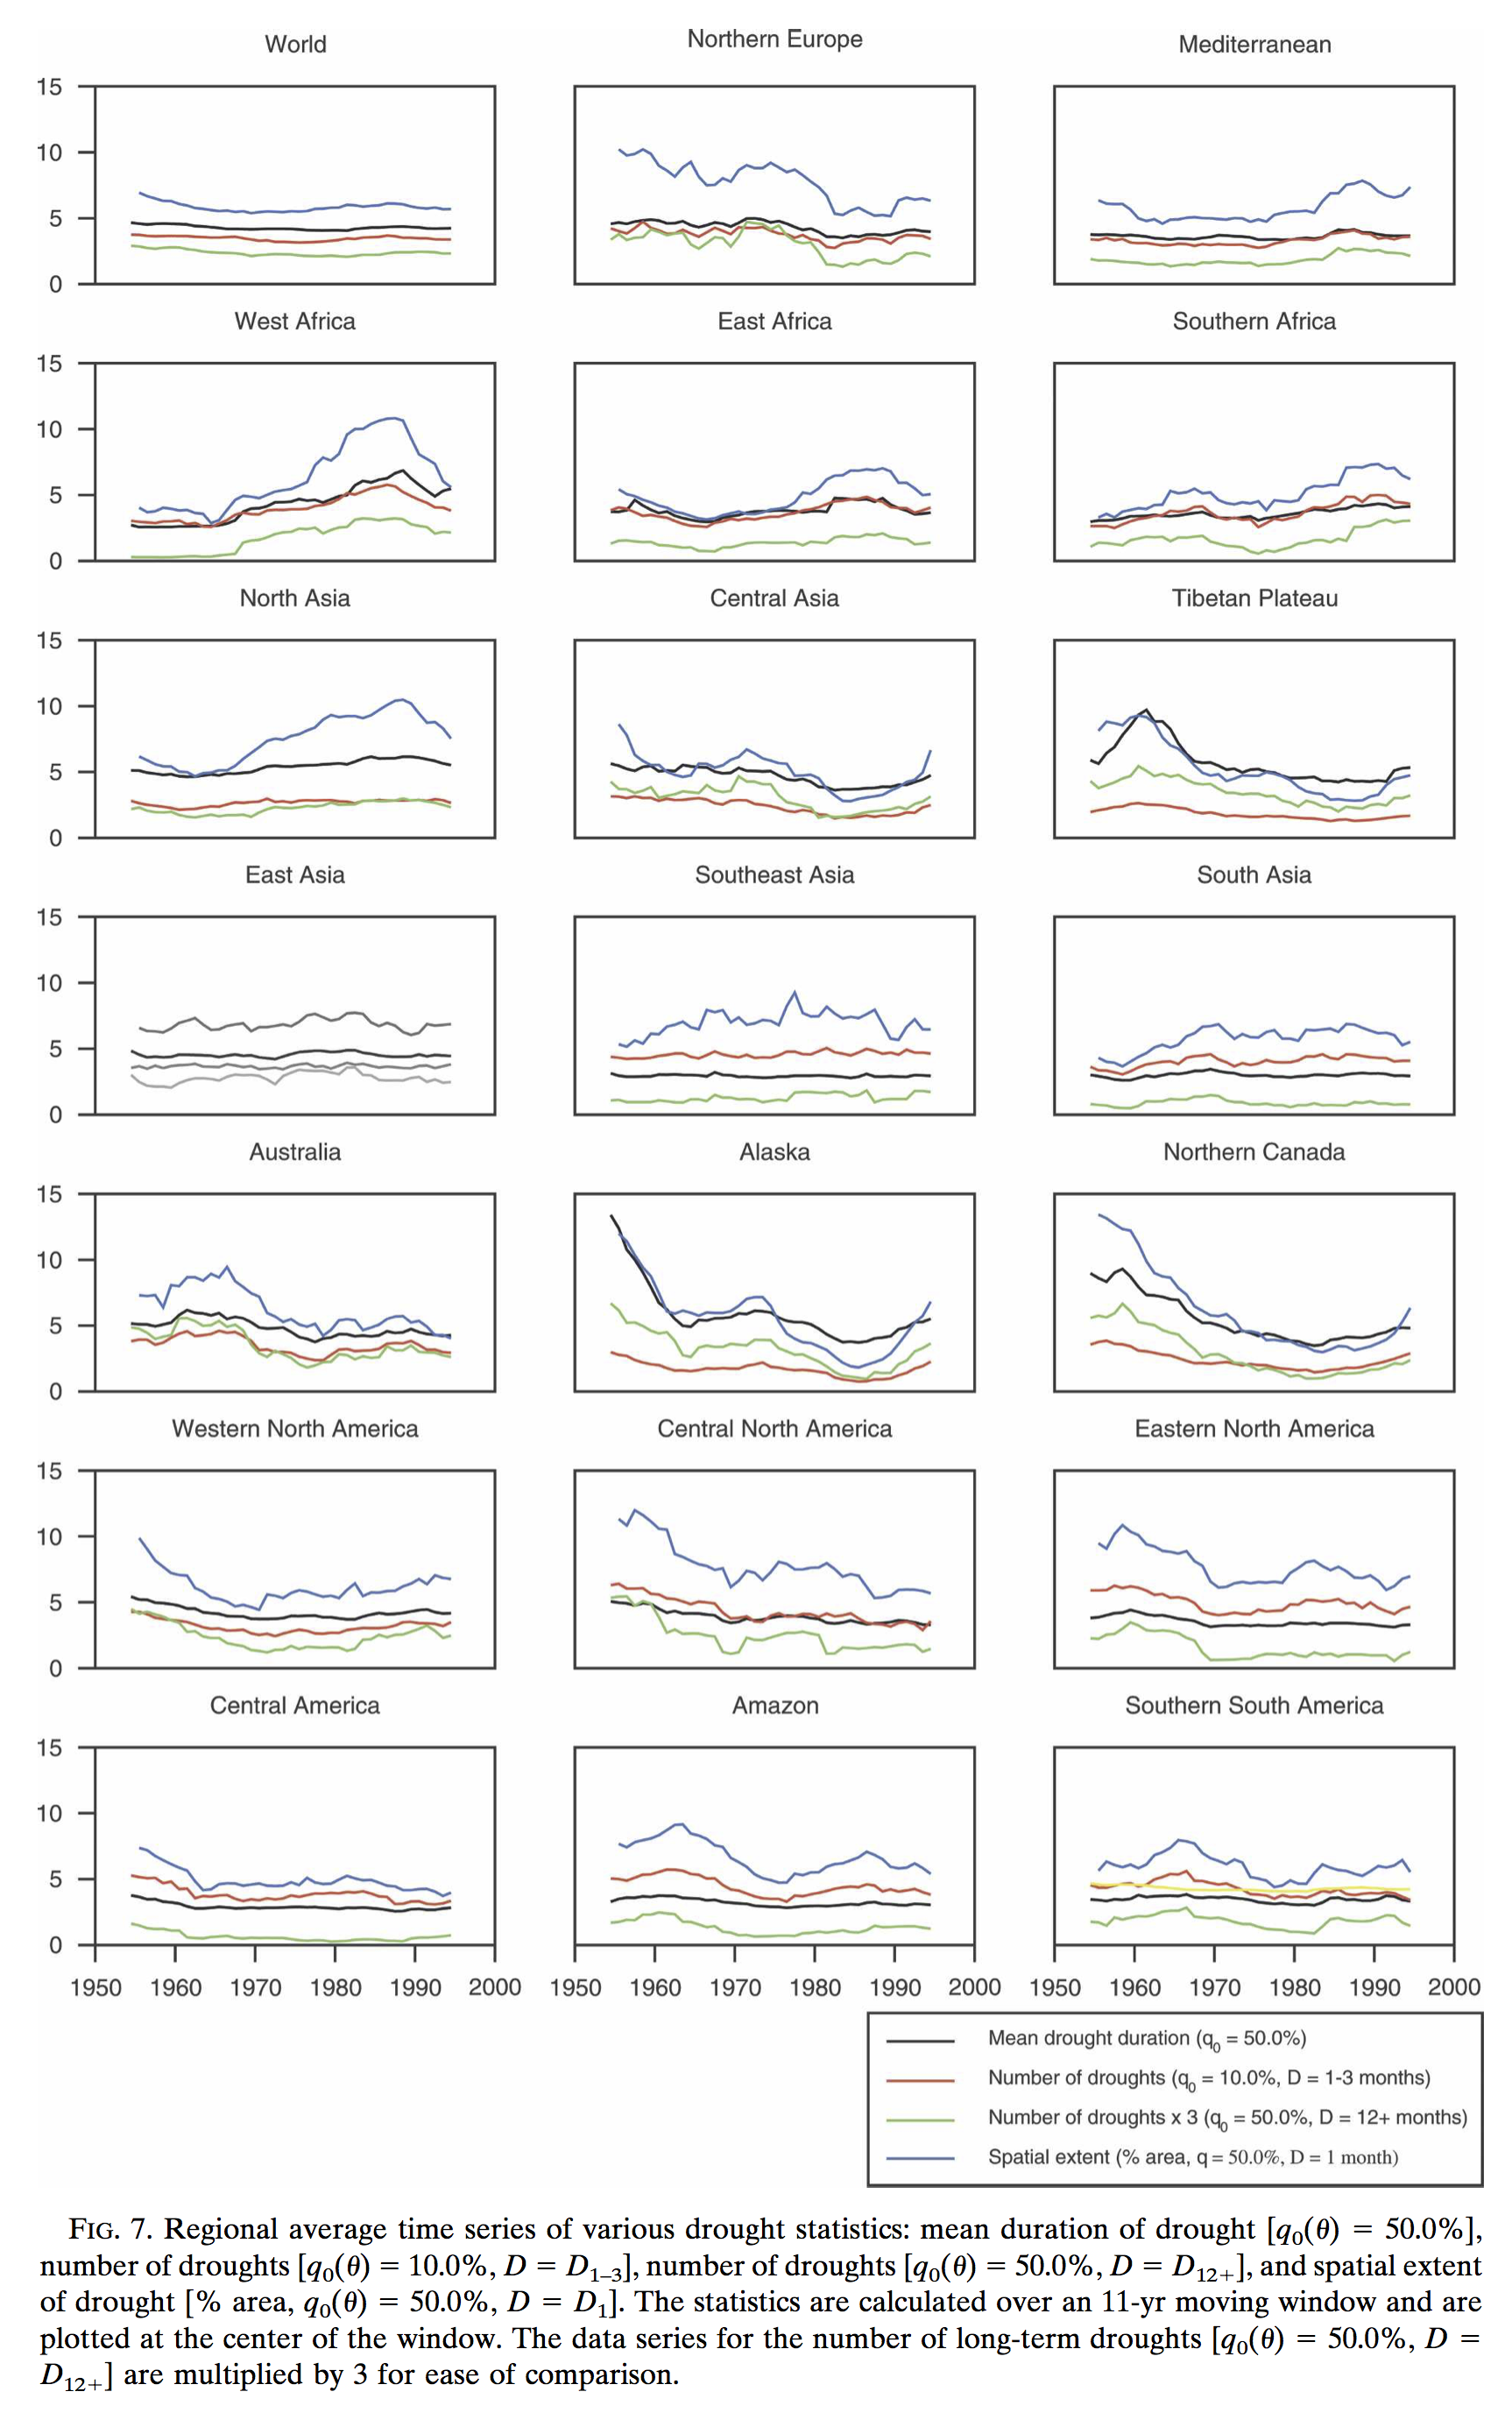
From Sheffield & Wood 2008
Figure 1 – Click to enlarge
The results above were calculated from models based on available meteorological data. According to their analysis some places have experienced more droughts, and other places less droughts. Because they are based on models we can expect that alternative researchers may produce different results.
AR5, published a year after SREX, says, chapter 2, p. 214-215:
Because drought is a complex variable and can at best be incompletely represented by commonly used drought indices, discrepancies in the interpretation of changes can result. For example, Sheffield and Wood (2008) found decreasing trends in the duration, intensity and severity of drought globally. Conversely, Dai (2011a,b) found a general global increase in drought, although with substantial regional variation and individual events dominating trend signatures in some regions (e.g., the 1970s prolonged Sahel drought and the 1930s drought in the USA and Canadian Prairies). Studies subsequent to these continue to provide somewhat different conclusions on trends in global droughts and/ or dryness since the middle of the 20th century (Sheffield et al., 2012; Dai, 2013; Donat et al., 2013c; van der Schrier et al., 2013)..
..In summary, the current assessment concludes that there is not enough evidence at present to suggest more than low confidence in a global-scale observed trend in drought or dryness (lack of rainfall) since the middle of the 20th century, owing to lack of direct observations, geographical inconsistencies in the trends, and dependencies of inferred trends on the index choice.
Based on updated studies, AR4 conclusions regarding global increasing trends in drought since the 1970s were probably overstated.
The paper by Dai is Drought under global warming: a review, A Dai, Climate Change (2011) – for some reason I am unable to access it.
A later paper in Nature, Trenberth et al 2013 (including both Sheffield and Dai as co-authors) said:
Two recent papers looked at the question of whether large-scale drought has been increasing under climate change. A study in Nature by Sheffield et al entitled ‘Little change in global drought over the past 60 years’ was published at almost the same time that ‘Increasing drought under global warming in observations and models’ by Dai appeared in Nature Climate Change (published online in August 2012). How can two research groups arrive at such seemingly contradictory conclusions?
Another later paper on droughts, Orlowski & Seneviratne 2013, likewise shows overwhelming evidence of more droughts – click to enlarge:
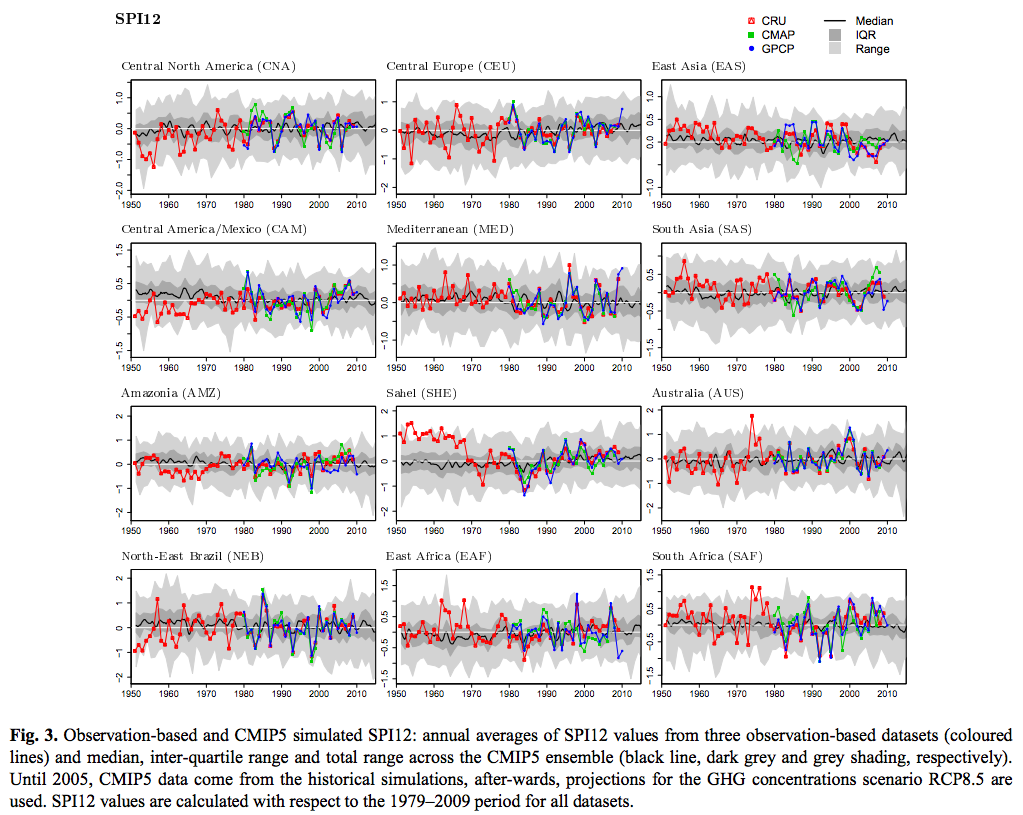
From Orlowsky & Seneviratne 2013
Figure 2 – Click to enlarge
Floods
SREX 2012, p. 177:
Overall, there is low confidence (due to limited evidence) that anthropogenic climate change has affected the magnitude and frequency of floods, though it has detectably influenced several components of the hydrological cycle, such as precipitation and snowmelt, that may impact flood trends. The assessment of causes behind the changes in floods is inherently complex and difficult.
AR5, Chapter 2, p. 214:
AR5 WGII assesses floods in regional detail accounting for the fact that trends in floods are strongly influenced by changes in river management (see also Section 2.5.2). Although the most evident flood trends appear to be in northern high latitudes, where observed warming trends have been largest, in some regions no evidence of a trend in extreme flooding has been found, for example, over Russia based on daily river discharge (Shiklomanov et al., 2007).
Other studies for Europe (Hannaford and Marsh, 2008; Renard et al., 2008; Petrow and Merz, 2009; Stahl et al., 2010) and Asia (Jiang et al., 2008; Delgado et al., 2010) show evidence for upward, downward or no trend in the magnitude and frequency of floods, so that there is currently no clear and widespread evidence for observed changes in flooding except for the earlier spring flow in snow-dominated regions (Seneviratne et al., 2012).
In summary, there continues to be a lack of evidence and thus low confidence regarding the sign or trend in the magnitude and/or frequency of floods on a global scale.
[Note: the text in the bottom line cited says: “..regarding the sign of trend in the magnitude..” which I assume is a typo, and so I changed of into or]
Storms
SREX, p. 159:
Detection of trends in tropical cyclone metrics such as frequency, intensity, and duration remains a significant challenge..
..Natural variability combined with uncertainties in the historical data makes it difficult to detect trends in tropical cyclone activity. There have been no significant trends observed in global tropical cyclone frequency records, including over the present 40-year period of satellite observations (e.g., Webster et al., 2005). Regional trends in tropical cyclone frequency have been identified in the North Atlantic, but the fidelity of these trends is debated (Holland and Webster, 2007; Landsea, 2007; Mann et al., 2007a). Different methods for estimating undercounts in the earlier part of the North Atlantic tropical cyclone record provide mixed conclusions (Chang and Guo, 2007; Mann et al., 2007b; Kunkel et al., 2008; Vecchi and Knutson, 2008).
Regional trends have not been detected in other oceans (Chan and Xu, 2009; Kubota and Chan, 2009; Callaghan and Power, 2011). It thus remains uncertain whether any observed increases in tropical cyclone frequency on time scales longer than about 40 years are robust, after accounting for past changes in observing capabilities (Knutson et al., 2010)..
..Time series of power dissipation, an aggregate compound of tropical cyclone frequency, duration, and intensity that measures total energy consumption by tropical cyclones, show upward trends in the North Atlantic and weaker upward trends in the western North Pacific over the past 25 years (Emanuel, 2007), but interpretation of longer-term trends in this quantity is again constrained by data quality concerns.
The variability and trend of power dissipation can be related to SST and other local factors such as tropopause temperature and vertical wind shear (Emanuel, 2007), but it is a current topic of debate whether local SST or the difference between local SST and mean tropical SST is the more physically relevant metric (Swanson, 2008).
The distinction is an important one when making projections of changes in power dissipation based on projections of SST changes, particularly in the tropical Atlantic where SST has been increasing more rapidly than in the tropics as a whole (Vecchi et al., 2008). Accumulated cyclone energy, which is an integrated metric analogous to power dissipation, has been declining globally since reaching a high point in 2005, and is presently at a 40- year low point (Maue, 2009). The present period of quiescence, as well as the period of heightened activity leading up to the high point in 2005, does not clearly represent substantial departures from past variability (Maue, 2009)..
..The present assessment regarding observed trends in tropical cyclone activity is essentially identical to the WMO assessment (Knutson et al., 2010): there is low confidence that any observed long-term (i.e., 40 years or more) increases in tropical cyclone activity are robust, after accounting for past changes in observing capabilities.
AR5, Chapter 2, p. 216:
AR4 concluded that it was likely that an increasing trend had occurred in intense tropical cyclone activity since 1970 in some regions but that there was no clear trend in the annual numbers of tropical cyclones. Subsequent assessments, including SREX and more recent literature indicate that it is difficult to draw firm conclusions with respect to the confidence levels associated with observed trends prior to the satellite era and in ocean basins outside of the North Atlantic.
Lots more tropical storms:
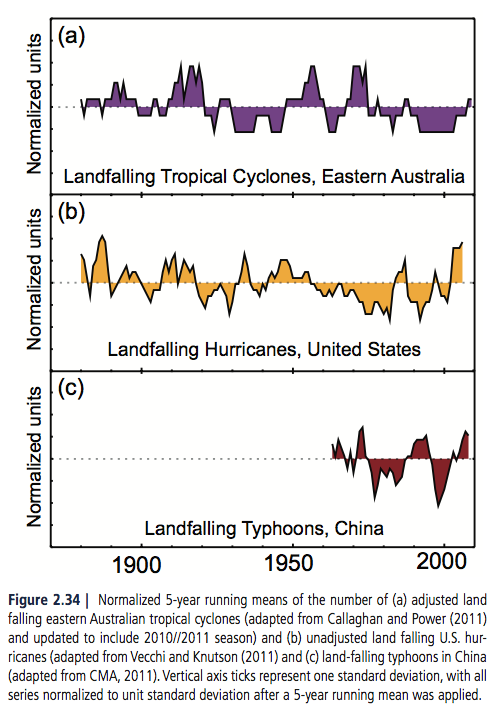
From AR5, wg I
Figure 3
Note that a more important metric than “how many?” is “how severe?” or a combination of both.
And for extra-tropical storms (i.e. outside the tropics), SREX p. 166:
In summary it is likely that there has been a poleward shift in the main Northern and Southern Hemisphere extratropical storm tracks during the last 50 years. There is medium confidence in an anthropogenic influence on this observed poleward shift. It has not formally been attributed.
There is low confidence in past changes in regional intensity.
And AR5, chapter 2, p. 217 & 220:
Some studies show an increase in intensity and number of extreme Atlantic cyclones (Paciorek et al., 2002; Lehmann et al., 2011) while others show opposite trends in eastern Pacific and North America (Gulev et al., 2001). Comparisons between studies are hampered because of the sensitivities in identification schemes and/ or different definitions for extreme cyclones (Ulbrich et al., 2009; Neu et al., 2012). The fidelity of research findings also rests largely with the underlying reanalyses products that are used..
..In summary, confidence in large scale changes in the intensity of extreme extratropical cyclones since 1900 is low. There is also low confidence for a clear trend in storminess proxies over the last century due to inconsistencies between studies or lack of long-term data in some parts of the world (particularly in the SH). Likewise, confidence in trends in extreme winds is low, owing to quality and consistency issues with analysed data.
Discussion
The IPCC SREX and AR5 reports were published in 2012 and 2013 respectively. There will be new research published since these reports analyzing the same data and possibly reaching different conclusions. When you have large decadal variability in poorly observed data with a small or non-existent trend then inevitably different groups will be able to reach different conclusions on these trends. And if you focus on specific regions you can demonstrate a clear and unmistakeable trend.
If you are looking for a soundbite just pick the right region.
The last 100 years have seen global warming. As this blog has made clear from the physics, more GHGs (all other things remaining equal) result in more warming. What proportion of the last 100 years is intrinsic climate variability vs the anthropogenic GHG proportion I have no idea.
The last century has seen no clear globally averaged change in floods, droughts or storms – as best as we can tell with very incomplete observing systems. Of course, some regions have definitely seen more, and some regions have definitely seen less. Whether this is different from the period from 1800-1900 or from 1700-1800 no one knows. Perhaps floods, droughts and tropical storms increased globally from 1700-1900. Perhaps they decreased. Perhaps the last 100 years have seen more variability. Perhaps not. (And in recognition of Poe’s law, I note that a few statements within the article presenting graphs did say the opposite of the graphs presented).
Articles in this Series
Impacts – II – GHG Emissions Projections: SRES and RCP
Impacts – III – Population in 2100
Impacts – IV – Temperature Projections and Probabilities
References
SREX = Managing the Risks of Extreme Events and Disasters to Advance Climate Change Adaptation Special Report, IPCC (2012)
Observations: Atmosphere and Surface. Chapter 2 of Working Group I to AR5, DL Hartmann et al (2013)
Global Trends and Variability in Soil Moisture and Drought Characteristics, 1950–2000, from Observation-Driven Simulations of the Terrestrial Hydrologic Cycle, Justin Sheffield & Eric Wood, Journal of Climate (2008) – free paper
Global warming and changes in drought, Kevin E Trenberth et al, Nature (2013) – free paper
Elusive drought: uncertainty in observed trends and short- and long-term CMIP5 projections, B Orlowsky & SI Seneviratne, Hydrology and Earth System Sciences (2013) – free paper


This was just published.
Sea level rise drives increased tidal flooding frequency at tide gauges along the U.S. East and Gulf Coasts: Projections for 2030 and 2045
JCH,
Sea level rise and projected future sea level rise will be covered in another article.
“And in recognition of Poe’s law, I note that a few statements within the article presenting graphs did say the opposite of the graphs presented”
Perhaps you mean this: “Another later paper on droughts, Orlowski & Seneviratne 2013, likewise shows overwhelming evidence of more droughts – click to enlarge”
Even if I click to enlarge I cannot see any trends.
Yes, you found one of them. Glad I mentioned Poe’s law.
Sheffield and Wood 2008 who show graphs.
“The results above were calculated from models based on available meteorological data. According to their analysis some places have experienced more droughts, and other places less droughts. Because they are based on models we can expect that alternative researchers may produce different results.”
I don`t see any idea in using models when you have observable facts. Then I would call it statistics. Or the only idea behind models I can see is that it can be a way to test models.
nobodysknowledge wrote: “I don`t see any idea in using models when you have observable facts”.
Data can be incomplete and might not directly measure the quantity desired. Models, constrained by the available data, can be used to fill in gaps. I think that is called “meteorological reanalysis” and I suspect that is what is being used in the papers SoD cites.
Observations are not complete, either spatially or temporally so assumptions about representations including infilling are models.
They are diagnostic models, not prognostic models, but models all the same.
nobodysknowledge,
Where is the global database of soil moisture going back 50 to 100 years? To quote from Dai’s paper (see the link from Frank):
You can find an explanation of this class of model, a reanalysis, in Water Vapor Trends under the heading Reanalysis – or Filling in the Blanks
SOD, as you intimate, global warming follows from imposed radiative forcing.
But, also as you intimate, storms, floods and droughts result from atmospheric dynamics and not from global warming. Temperature gradients determine Rossby wave dynamics and there have been cases made for weakened gradients (Francis) or strengthened gradients (Hansen). But when one reflects that even with constant gradients, dynamic range of waves could mean more or fewer storms, floods and droughts, the case for warming being a significant source of change appears quite low.
TE: One way to look at big changes in precipitation is: What goes up must come down. Therefore consider changes in evaporation with GW. The rate of evaporation depends on surface wind speed and the undersaturation of the air over the oceans. According to Isaac Held, most climate models suppress the rate of evaporation by increasing relative humidity there from 80% to 81%, a 5% decrease in undersaturation.
It seems very strange for GW to be accompanied by far less than the expected +7%/K increase in evaporation because convective transport (overturning) weakens.
SOD: Dai review is can be found below. Its one of 20 versions found by Google Scholar – the first is behind a paywall.
Click to access WIREs_Clim_Change_2010_Dai.pdf
Thanks.
SOD: Do you intend to discuss the common theme: Climate change will make wet areas wetter and dry areas drier. I’ve heard speakers claim that there is a fundamental physical or meteorological reason for this generalization, but I’ve never found a compelling rational.
How much wetter or drier is another important issue? As one moves towards the equator where it is warmer (or towards the equator while staying in the temperature zones outside the Hadley circulation), are wetter areas wetter and dry areas drier?
This principle suggests that rainfall would have been more evenly distributed during the last ice age. On the average, ice ages were much drier and future warming will bring more precipitation. However, climate sensitivity is thermodynamically linked to how much precipitation can increase with temperature. In the long run, the change in surface and TOA energy balances (W/m2/K) must be the same (except for changes in albedo). +7%/degK is nearly impossible if climate sensitivity is high. +1-2%/degK is required unless cloud feedback is positive.
Frank,
I do plan to. One of the commonly cited papers for this is Robust Responses of the Hydrological Cycle to Global Warming, Held and Soden, Journal of Climate (2006).
Thanks for the paper. It will be interesting to see what you have to say about the physics of changes in P-E.
The prediction that precipitation will only increase by 1.7%/K due to a slowdown in atmosphere turnover comes from climate models, not physics equations. That prediction appears counter-intuitive to me. After an instantaneous doubling of CO2, the upper atmosphere warms much faster than the surface and that will certainly slow turnover – transiently. Once the planet’s average lapse rate returns to borderline instability, why doesn’t turnover return to normal or even increase?
Convection is always limited by the temperature difference between the surface and the upper troposphere. That difference depends on how fast the upper troposphere can radiate heat to space. More GHGs mean that convection will need to carry heat higher to escape at the same rate. The height where buoyancy-driven convection ceases is the tropopause – which is higher where it is warmer. What physics control that altitude? (There may be some interesting physics here that you haven’t gone into before.)
Finally, there is the infamous “missing” hotspot in the upper tropical troposphere. Is there a flaw in all AOGCMs that causes them to overheat the upper troposphere and therefore decrease turnover with increasing Ts? (That would be exciting, but improbable.)
Frank,
A major factor in the height of the tropopause is stratospheric heating from the absorption of solar UV by oxygen and ozone. You can’t have convection when the temperature is increasing with altitude.
“Is there a flaw in all AOGCMs that causes them to overheat the upper troposphere and therefore decrease turnover with increasing Ts? (That would be exciting, but improbable.)”
Well, there is a relevant flaw in the AOGCMS that pretty well describes why the models predict a Hot Spot that observations so far contradict.
Namely, even in hindcasts, the GCMs produce way too much tropical precipitation ( and a “double ITCZ” ). Precipitation is a pretty good indicator of the convective heat transport aloft. This paper details the findings: http://english.iap.cas.cn/RE/201510/t20151022_153743.html
The relevant graphic:

You can see above that the models create too much V-component wind encroaching on the tropics. The models create too much precipitation and a double ITCZ because they create too much C ( Convergence ).
And unfortunately, as the paper details, the problem has gotten worse, not better from CMIP3 to CMIP5!
This may not be all that surprising. GCMs are limited by the same prediction horizon ( seven days or so ) that weather models are. There is some sense that waves regress to the mean, but I don’t believe that’s correct. There are anomalies of motion at decadal and centennial scale that reflect variation composed of changes in frequency of the 3-day synoptic scale events.
BTW, the Hot Spot does not necessarily follow as a logical result of global warming. The argument is that global warming would increase instability, leading to more convection. But the tropics, above the boundary layer, are quite stable. Convection is quite suppressed for all the layers above the boundary layer. That is indicated by this SOD classic of Potential Temperature:

The exception is the boundary layer of the tropics. In this lowest layer, with respect to the layers above, parcels are conditionally unstable. Convection occurs, not spontaneously, but when some event lifts a boundary layer parcel into the layers above, wherein latent heat provides buoyancy for further lift. That’s why the models above, which provide too much convergence, also create too much convection: convection the tropics is not limited by conditional instability, which is ubiquitous throughout the tropics, but by the convergence which provides the condition of lift.
Further, consider if instability were to lead to increased tropical convection ( and as above, convergence is probably a greater limiting factor ). What happens in a Hot Spot? Decreased stability. The presence of a Hot Spot would be a negative feedback to the sustainment of a Hot Spot.
What happens in a Hot Spot? Decreased stability.
Should read: What happens in a Hot Spot? INcreased stability. ( warmer over not as warm -> more statically stable ).
DeWitt: Since the height of the tropopause isn’t the same everywhere on the planet, warmth of the stratosphere may not determine where the tropopause is everywhere on the planet.
If there were no source of heat for the stratosphere, there would still be an interface between regions where temperature is controlled by convection (T varies linearly with altitude/pressure) and regions where temperature is controlled by radiative equilibrium (T varies linearly with optical depth?). One definition for the tropopause is the lowest altitude with a lapse rate of 2 K/km or less, which is the radiative equilibrium domain. That altitude exists whether or the stratosphere is warmed by absorption by ozone. In the tropics, the convective domain seems to bump into the domain heated by absorption by O3, producing a clearly defined tropopause in the tropical sounding used by Modtran. Non-tropical profiles seem to have a region where radiative equilibrium controls temperature, but the temperature is still falling with altitude because there little O3. This results in a tropical tropopause that colder than elsewhere on the planet.
The putative missing tropical hotspot is located where the convective region and the O3 heated region touch. In fact, the tops of some tropical thunderstorms occasionally reach well into the stratosphere.
An ECS of 3.7 K/doubling or 1 K/(W/m2) means that the increase in net TOA flux with surface warming is 1 W/m2/K. Ignore changes in SWR for the moment. That means that (at steady state) the net flux from the surface can only increase 1 W/m2/K. Unless atmosphere overturning slows, there will be a 7%/K = 5.6 W/m2/K increase in upward latent heat flux. The paper referenced by Isaac Held tells us what climate models predict: They don’t explain that a slowdown in atmosphere overturning is essential to high climate sensitivity. (I suppose this comes under the general heading of lapse rate feedback.)
If SWR cloud feedback is strongly positive, it can reduce the net flux across the TOA. But 5.6 W/m2/K is a massive change in albedo (102 W/m2).
Frank,
As we all know, models don’t do convection well at all. The grid size is too large. So anything involving convection is entirely dependent on how the net effect of convection is calculated. I.e., it’s the modeler’s choice, not necessarily what happens in the real world.
DeWitt wrote: “As we all know, models don’t do convection well at all. The grid size is too large. So anything involving convection is entirely dependent on how the net effect of convection is calculated. I.e., it’s the modeler’s choice, not necessarily what happens in the real world.”
Agreed. Models are parameterized so that the atmosphere overturns at about the right rate to produce current surface temperature, cloud albedo, and precipitation. Now raise surface temperature by 1 K. 7% more water vapor will be presumably be present in the well-mixed boundary layer over the ocean; potentially 70%*5.6 = 4 W/m2/K more heat headed upward if the rate of turnover remains constant. That is enough to negate the forcing from doubled CO2 if it eventually passes through the TOA as LWR!
It occurred to me to look at the 3.5 K seasonal cycle in GMST used by Ramanathan, Manabe and other to study feedbacks. If climate models predict that precipitation is expected to increase only 1.7%/K during global warming, then how much should total global precipitation (or average precipitation) vary with seasonal changes in GMST. 1.7%/K * 3.5 K = 6% predicted seasonal increase in 2.53 mm/day global average, or a seasonal cycle with an amplitude of 0.15 mm/day. If atmospheric turnover doesn’t decrease as much as models predict, the amplitude could be twice as big. If it follows expectations from CC (7%/K), the amplitude of the seasonal cycle should be an easily detect 24%.
Figure 6 in the reference below has some useful data. There is too much noise to see a cycle with an amplitude of 0.15 mm/day. I probably would see a cycle with an amplitude of 0.30 mm/day and it isn’t apparent in this data. And a 24% seasonal change in GLOBAL precipitation is totally ruled out. If I found the raw data for this graph and averaged several decades of monthly data, I probably could identify a seasonal cycle with a 6% amplitude.
http://journals.ametsoc.org/doi/pdf/10.1175/1520-0477%281997%29078%3C0005%3ATGPCPG%3E2.0.CO%3B2
However, I CAN see a large seasonal cycle with a peak to trough amplitude of about 25% in precipitation over land – as if overturning is unchanged by seasonal warming over land and the relative humidity of the overturned air remains constant. (:))
As with all of these seasonal analyses, we aren’t looking at global warming – we are looking at the net result of an average of 10K of warming in the NH and 3K of cooling in the SH, along with all of the differences between the two hemispheres. Precipitation is highly regional and perhaps half falls near the ITCZ where there is little seasonal change in temperature.
I wonder how well AOGCMs perform at reproducing the seasonal cycle in precipitation – either globally or regionally? It would be a great way to prove or disprove that climate models correctly predict seasonal changes in overturning/precipitation.
Frank,
One thing we do know is that there is usually a lot more dust content than normal in ice cores towards the end of a period of glaciation. Some of that may be due to exposure of the continental shelf as the sea level drops. It would take a while to wash the salt out enough to make it fertile.
Cold is dry. It snows very little on the Antarctic Plateau,, even during an interglacial period. During a glacial period it takes on the order of 10,000 years to accumulate enough snow, 60m IIRC, to seal off air bubbles compared to about 1,000 years during an interglacial period.
SOD – You might be interested in discussing this recent paper:
“Earth’s changing global atmospheric energy cycle in response to climate change” (Pan et al., in Nature Communications, Jan 24, 2017, html available online) in which they examine trends in the components of the Lorenz energy cycle. They conclude (among other things):
“Our investigations suggest that the total mechanic energy of the global atmosphere did not significantly change during the past 35 years (1979–2013). However, the eddy energies display significant positive trends especially in the SH. In addition, positive trends are revealed in all conversion terms and generation/dissipation rates of energies
during the past 35 years.”
and:
“The increased eddy energies revealed in this study provide one more piece of evidence for intensifying eddy activities (for example, cyclones and hurricanes) in our climate system.”
An interesting approach.
I did a Google search on “Climate change is already causing worsening storms, floods and droughts”. It looks like the IPCC position is an extreme outlier. There would understandably be riots if they were to take on any kind of government position responsible for dealing with climate change.
A couple of longer time-series graphs from Dai’s 2010 paper illustrate the problem of trends over a timescale as short as 50 or 100 years:
Here is western North America over 1000 years- click to expand:
Here is China over 500 years – click to expand:
Take any 50 or 100 year period. Is it a trend? Is it noise? How do we distinguish natural variability from changes caused by global temperature changes with this kind of data?
[…] « Impacts – V – Climate change is already causing worsening storms, floods and drough… […]
[…] Impacts – V – Climate change is already causing worsening storms, floods and droughts […]
[…] Impacts – V – Climate change is already causing worsening storms, floods and droughts […]
I don`t think it is a good idea to long for an earlier climate. The Little Ice Age had some severe floods. The years 1342, 1643, 1551 and 1682 were worst in Middle Eurpe.
A weather report from Albert at Volcano Cafe. “The winter of 1342, in the early phases of the Little Ice Age, had been cold and changeable. A rare earthquake hit the Netherlands in January. Eastern Europe had a cold winter, with much snow, and hard frosts in December and January; this was followed by very warm weather in late January which melted the masses of snow and ice. A second frost period came in mid February. In Western Europe, the hard frost only came in mid February, lasting until mid March. The melting snow caused rivers to rise, and the ice jams damaged many bridges. In January, Prague lost its famous Judith bridge to an ice jam. This was one of the oldest stone bridges in Europe, and the replacement (the Charles bridge) was not finished until after the year 1400. The Danube, Elbe and Seine all flooded in February. A storm flood hit Venice. After the winter, the spring was dry – so dry that in late May, the city of Mechelen caught fire (a common danger in the medieval towns, with wooden buildings, narrow streets and no water on tap) and was largely destroyed: thousands died. In other words, a normal year.
The weather turned again mid-May and a rainy period followed. England had cold, heavy rains throughout June, becoming even worse in early to mid July. Only in August did the ten weeks of rain finally come to a halt and a period of warm weather followed. We know less about the weather in Central Europe, but some rivers in Germany flooded in mid June, so in some places the dry period in May had come to an end, but elsewhere it appears the drought continued until July. Of course, people were much more dependent on the weather than they are nowadays. There was little food storage, and if the summer was bad and the harvest poor, people went hungry and starved. Bad winters could also kill: central heating was a dream. But so far, 1342 had been ok, apart from the continuing trend towards colder winters.
But by mid July, the rains became biblical, kicking off the most dramatic river flood Germany has ever seen. On 19 July, rivers across central Germany suddenly began to rise, including in places which had had no rain. The next day, Saturday, the rise accelerated and soon the water entered cities, flooding streets and buildings. The floods came unexpected: winter floods were normal and happened most years, but summer floods were far less common. And the water kept rising, reaching levels no one had ever seen. People fled in panic; many died. Bridges, houses and towers collapsed. It took weeks for the waters to recede again. The damage was immense. Soil erosion became a major problem: in some areas one can still see the deep channels cut by the flow. This was the legendary St. Mary Magdalene flood. Almost 700 years later, Germany has still not seen its like. It was a true millennium flood.”
“The peak level is not as well known as in Frankfurt, but is estimated at 10.3 meter above normal.”
http://www.volcanocafe.org/the-1342-st-mary-magdalene-flood/
Impacts – Climate change was causing worsening storms and floods as the climate became colder from the 13th century. The most thorough analysis of the impacts of climate change was done by H H Lamb. CLIMATE, HISTORY AND THE MODERN WORLD http://ens9004.mza.infd.edu.ar/sitio/upload/08-%20LAMB,%20H.H.%20-%20LIBRO%20-%20Climate,%20History%20and%20the.pdf 1982 reprint 1995.
“at least four sea floods of the Dutch and German coasts in the thirteenth century the death roll was estimated at around 100,000 or more; in the worst case the estimate was 306,000. As a result of the floods of 1240 and 1362 it was reported that sixty parishes accounting for over half the agricultural income of the (at that time) Danish diocese of Slesvig (Schleswig) had been ‘swallowed by the salt sea’. In some of these storm floods the Zuyder Zee in the Netherlands was formed, and enlarged, and it was not drained until the present century. Islands, and other inlets, were formed by losses of land on the German and Danish North Sea coasts. Other islands were destroyed by the stormy seas. The island of Heligoland (50 km out in the German Bight), which is believed to have measured over 60 km across in the year 800, had been reduced to 25 km by about 1300, perhaps half of it being lost in a storm in that year. Today it measures only about 1.5 km on its longest axis (fig. 69). In England the great ports of Ravenspur or Ravensburgh (east of Hull) and Dunwich (on the Suffolk coast in East Anglia) were lost in successive stages in the sea storms of these centuries. Deaths of 100,000 or more people in floodings of the continental shore of the North Sea were again reported in storms in 1421, 1446 and 1570. In the 1570 storm great cities were flooded, and the deaths were estimated at 400,000. And in 1634 there were again great losses of land from the Danish and German coast and the off-lying islands.”
and “The development of great storms in this zone continued: from the vast North Sea floods and loss of life on the continental coasts in 1570, mentioned in the last chapter, to the permanent losses of land from the Danish, German and Dutch coasts (and demolishing of the island of Nordstrand) in the storm of 21 October 1634; to the formation of the Culbin Sands in northeast Scotland in 1694, and the overwhelming of a four-thousand-year-old settlement site in the Hebrides with sand in 1697; to the great storm which passed across southern England on 7–8 December (New Style calendar) 1703 and was described in careful detail by Defoe.6 The Eddystone lighthouse near Plymouth was blown down, as were houses in towns and countryside all across England to the east coast; the damage in London alone was estimated at £2 million; enormous numbers of trees were blown down; and many ships were blown up-river, or lifted beyond the usual reach of the tides, or wrecked on the coast and at sea; 8000 lives are said to have been lost. Despite the severity of these floods on the continental side in 1634, 1671, 1682 and 1686 and again at Christmas 1717, in each of which some thousands of people were drowned, and losses of land on many other occasions besides, it is unlikely—in a cold epoch of apparently more or less world-wide extent with glaciers generally in a state of growth”
It is very much to learn from Lamb. So a question: Should we long back to a colder climate?
nobodysknowledge,
It’s hard to determine from impacts in the past whether the weather / climate was worse in the past.
Developed countries have built dams for flood mitigation, improved building codes to protect against winds and storms, built tarmac roads, flood barriers, levees, produce good weather forecasts 24 hrs in advance, introduced warning systems..
That also raises the question, to be considered in a future article, how easily worse storms, floods and droughts – if they come to pass – can be managed. Just as developed countries today usually suffer minimal damage and loss of life from storms that would have caused major suffering a few hundred years ago.
Bangladesh is a good example of big progress possible even for a very poor country – Karim and Mimura (2008):
So impacts (damage, loss of life, etc) relate to severity, but not in a constant way over time. And it can go in both directions. How many people lived in southern Florida in 1800 versus today? What is the property value in vulnerable areas vs those same areas in 1800 (in constant $)?
Property damage could be 100x higher in $ value (in real terms) with the same storms. Damage could be 5% of earlier periods with the same storms..
SoD Thank you for commenting.
I think that the monsterous forces were bigger in earlier (and colder) times, as it is described by Lamb and others. The destruction was almost unbelievable. Frost, famines and pests came along. So you are right that the monster protection is better now.
Something got lost: Lamb: “it is unlikely—in a cold epoch of apparently more or less world-wideextent with glaciers generally in a state of growth—that the general sea level was as high as it had been in the Middle Ages around AD 1000 and between 1200 and 1400, though the difference may have been only of the order of 50 cm. The frequency of such floods between 1570 and about 1720 must be attributed to greater storminess.
May be that the sea level rise from the medieval warm period of 50 cm is a bit too high, but the principle stands. The knowledge of sea level rise has become better the last 35 years.
Lamb: “in a cold epoch of apparently more or less world-wide extent with glaciers generally in a state of growth” There has been a state of global growth of glaciers over 850 years, from 1050 to 1900. According to:
Glacier fluctuations during the past 2000 years, Solomina et al 2016.
Click to access solomina16qsr_238964.pdf
When we look at glaciers it seems that the following periods han had a cooling climate:
“Considering the global database reviewed in this paper, a
number of advances in the past two millennia cluster in CE
200se300s, 400se600s, 800s, CE 1000 as well as around CE
1150s, 1280s, 1350s, 1400s, 1450s, 1600s, 1640s, 1680s, 1720s,
1770s, 1820s, 1850se1860s, 1890s, 1900se1920s, 1970se1980s
and 1990s. However, in some regions the data are too scarce and
the precision of the dating is too low for a definite conclusion
about the global synchrony of glacier advances. Advances
occurred at one or more locations in every century of the first
millennium CE, but it is difficult to determine if these were of
more than regional significance. Very few cases of advancing
glaciers are reported for the 1st to 2nd and the 10th centuries
CE. There is a coherency in the number of glacier advances in the
past two millennia in both hemispheres, including the glaciers
at low latitudes; the most extensive and geographically widespread
were in the 13th to 19th centuries and indicate that the
LIA was of global significance (Grove, 2001, 2004).” A note: according to the figure in the paper the number of advances was on top around 1800 and fell after that. And the lowest number was between 850 and 1050. So there were many transient periods which may have triggered worsening storms and floods. Anybody knows?
Historically there has been increased storminess in colder periods.
As a french study shows. “Major storm periods and climate forcing in the Western Mediterranean during the Late Holocene.” Jean-Philippe DEGEAI (1)*, Benoît DEVILLERS (1), Laurent DEZILEAU (2), Hamza OUESLATI (1), Guénaëlle BONY (1), 2015.
A comparison of the Bagnas Sr record with paleoclimate proxies in North Atlantic, Western Europe, and Western Mediterranean shows that the phases of high storminess activity occurred during cold periods. Moreover, the comparison with other storm proxies exhibits an in-phase storminess pattern between Northern Europe and the Western Mediterranean. The highest storminess activity occurred from 400 to 820 cal yr AD during the Dark Ages Cold Period, with an increase in the frequency of storm episodes. The Bagnas sequence records also periods of high storminess activity during the end of the Iron Age Cold Period and during the Little Ice Age. By contrast, the Roman Warm Period and the Medieval Warm Period were characterized by phases of low storm activity.
More studies show increased storminess in the Little Ice Age. From ca 1350 there was a strong increase in storminess, with a peak from 1500 to 1800 until it declined ca 1850. Sorrel et al. (2012), S. Costas et al. (2016).
Blog post by Javier: https://judithcurry.com/2017/09/15/nature-unbound-v-the-elusive-1500-year-holocene-cycle/
So it seems that storminess has been on its highest when sea surface temperatures were on their lowest, during the last millennium.
That makes sense. Storms require turning heat (random molecular motion) into work (directed motion, like wind). That requires a temperature difference. It is well established that a colder world has a greater equator-to-pole temperature difference and a warmer world has more uniform temperatures. So a colder world ought to be stormier.
At least it is lots of evidence for this in the Mediterranean and North Atlantic. Sea surface temperaures seem to be lowest during the last period of LIA in these areas. And storms were heavy. Big blocks were blown ashore some places.
” Conclusions. Boulders and blocks on the Mediterranean coast near Martigues, in southern France, are evidenc of the impact of high-energy waves. Wave height modeling shows that the largest blocks could have been displaced initially by a 3.5 m high tsunami wave or by combined storm waves and surge of 10 m at the break point. There is no recorded or historical evidence of a tsunami event with wave heights capable of transporting these boulders. Tsunami propagation models also do not support the possibility of such an event. On the other hand, there is ample evidence of historical extreme storms on this coast.”
“The radiocarbon age determinations obtained from marine organisms on the boulders fall within the Little Ice Age, a period of enhanced storm activity, as suggested by palaeoclimatic studies.”
Coastal boulders in Martigues, French Mediterranean: evidence for extreme storm waves during the Little Ice Age. M. Shah-Hosseini et al 2013.
Most of the rocks were transported by storms between 1660 and 1870. Mass between 14 and 35 tons.
(But cannot compete with the fairytale of Hansen et al about the Cow and the Bull of Eleuthera, together with other boulders, blown ashore in Bahamas, with weights up to 2300 tons. https://scienceofdoom.com/2017/06/25/the-confirmation-bias-a-feature-not-a-bug/#comment-119101)
[…] Similar ratings are obtained for rainfall predictions. The last 50 years has seen no apparent global worsening of storms, droughts and floods, at least according to the IPCC consensus (see Impacts – V – Climate change is already causing worsening storms, floods and droughts). […]
Since hurricanes are in the news right now, I have a question that has been bothering me for a long time – the supposed need for a 26.5 degC SST to create? strengthen? or maintain? a hurricane. How much stronger do hurricanes get when it is warmer than 26.5 degC? IIRC, Judith commented that Irma developed and strengthened over some of the coldest ocean (26.5 degC) to ever produce a major hurricane.
Hurricanes have been described as heat engines. The maximum efficiency of a heat engine depends on the temperature difference between the warmest location and the exhaust point. For hurricanes, efficiency would appear to be defined by the temperature difference between the surface and the top of the hurricane, which I believe is located at the tropopause. In that case, the need for a 26.5 degC SST could reflect mostly from the need for a higher colder tropical tropopause.
However, total power depends on both the efficiency and size of an engine. It isn’t clear why the magic 26.5 degC temperature should produce a “larger engine” and warmer SSTs produce even larger engines.
SOD: I didn’t find a better place for a hurricane question at your blog. Feel free to move this question somewhere better – or if you intend to write about hurricanes, you can save the questions for a more appropriate time.
I have wondered about the same thing, as it seems unphysical with a critical temperature level in that way. So I follow your reasoning, Frank. What seems to be the most important mechanism in the making of hurricans seems to be an extreme low pressure. And I think that it is the temperature difference in the atmosphere that causes this, more than absolute temperature. The strongest hurricane in US history had a pressure under 90. Hurricans are extreme variants of convection. It looked like hurricane IRMA brought warm air up to the tropopause. But the 26,5 deg C critical point is a good argument to spread panic, so I think it can be part of the propaganda. And when scientists believe it, it can sound as settled science, and become consensus bias.
nk,
Hurricanes create low pressure at their centers. The bigger the hurricane, the lower the pressure.
Frank,
You ask excellent questions. So far as I can find, the requirement of at least 26-27 C is an empirical observation and is not absolute. As you say, it seems that what really matters is the vertical difference in temperature, but I think it is potential temperature that matters.
The original source seems to be:
Palmen, E. H., 1948: On the formation and structure of tropical cyclones. Geophysica , Univ. of Helsinki, Vol. 3, 1948, pp. 26-38.
Link: http://www.geophysica.fi/index.php?action=openlist&decade=1940
If that link works as I expect, it will be item 4 in the list and not paywalled.
Figure 1 in that paper. shows that lifting an air parcel in February results in rough equilibrium with the surroundings. But in September the parcel becomes much warmer than the surroundings, so there is a strong instability.
If upper troposphere temperatures increase due to AGW, then it seems to me that the sea surface temperature required for hurricane formation would increase.
Mike. So, if temperature difference really is the big factor, then Irma’s supposedly unprecedented rise to category 5 over relatively cool-for-September seas (26.5 degC) was accompanied by a even cooler upper atmosphere above those seas
Frank wrote: “if temperature difference really is the big factor, then Irma’s supposedly unprecedented rise to category 5 over relatively cool-for-September seas (26.5 degC) was accompanied by a even cooler upper atmosphere above those seas”
Maybe. Or maybe it was very little wind shear. I have not seen confirmation of the relatively cool seas claim; the map here seems to indicate otherwise: https://climate.nasa.gov/news/2625/hot-water-ahead-for-hurricane-irma/
Frank, it’s fine here for now, thanks for asking.
On the need, or not, for a 26.5’C SST to create a hurricane. I don’t know the answer but am reading some tropical cyclone papers at the moment. Not sure anyone knows the answer. Maybe the fog will clear at some point, let’s see..
IMO, there is a lot of handwaving oversimplification going on with hurricanes. If hurricanes are powered by the temperature difference between the SST and the hurricane top (the tropopause), then global warming isn’t going to increase hurricanes. In fact, a decreasing lapse rate (lapse rate feedback) will weaken then slightly. Nevertheless, a warmer ocean will have more areas above 26.5 degC capable of supporting and intensifying hurricanes. However, there is only a weak correlation between hurricane wind speed and the temperature of the ocean below. And wind sheer is projected to increase with GW.
In my dreams, I imagine taking all of the hurricane storm tracks over a decade or two and looking at the change in winds speed over the next 12-24 hours vs the SST (and lapse rate and relative humidity and ?) of the water the hurricane encountered over those 12-24 hours. How does the probability of intensifying from TS to Cat1, or Cat1 to Cat2 change with SST (and these other parameters)? Collect data only over ocean. The experiments that need to be done seem to be extremely obvious (albeit time-consuming), which leads me to wonder why they aren’t publicized.
I get the feeling that something besides SST in the Atlantic Main Development Region has been unusually favorable for producing intense hurricanes this past month, but I know these impressions could easily arise from cherry-picking based on the news. Likewise the Caribbean was favorable in 2005. Many strong storms seem to follow similar tracks in the same month.
New article now posted on the subject of tropical cyclones:
Impacts – XIV – Tropical Cyclones and Climate Change 1
The 2016 review linked below indicate that the temperature difference between the surface and tropopause (not a 26.5 degC threshold) is important for hurricane intensification. There may have been more, but weaker hurricanes during the last ice age. The increase in Atlantic hurricanes in the last few decades has been attributed to a fall in tropopause temperatures there.
Click to access Advanced-Review-Tropical-cyclones-and-climate-change.pdf
Abstract: Recent research has strengthened the understanding of the links between climate and tropical cyclones (TCs) on various timescales. Geological records of past climates have shown century-long variations in TC numbers. While no significant trends have been identified in the Atlantic since the late 19th century, significant observed trends in TC numbers and intensities have occurred in this basin over the past few decades, and trends in other basins are increasingly being identified. However, understanding of the causes of these trends is incomplete, and confidence in these trends continues to be hampered by a lack of consistent observations in some basins. A theoretical basis for maximum TC intensity appears now to be well established, but a climate theory of TC formation remains elusive. Climate models mostly continue to predict future decreases in global TC numbers, projected increases in the intensities of the strongest storms and increased rainfall rates. Sea level rise will likely contribute toward increased storm surge risk. Against the background of global climate change and sea level rise, it is important to carry out quantitative assessments on the potential risk of TC-induced storm surge and flooding to densely populated cities and river deltas. Several climate models are now able to generate a good distribution of both TC numbers and intensities in the current climate. Inconsistent TC projection results emerge from modeling studies due to different down-scaling methodologies and warming scenarios, inconsistencies in projected changes of large-scale conditions, and differences in model physics and tracking algorithms.
The now well-established thermodynamic theory of TC maximum PI continues to be investigated and refined. In addition, there has been considerable work done since 2010 analyzing the ‘relative SST’ argument, namely that TC characteristics such as PI in a basin can be affected locally by basin SSTs because tropical upper troposphere temperatures tend to follow the global tropical average instead of the basin average. Thus, the relative SST can serve as a useful although not perfect proxy for PI. Camargo et al. and Ting et al. indicate that the decrease in PI in the Atlantic basin caused by aerosol forcing and its increase due to greenhouse gas forcing largely canceled each other, and the sharp increase in the PI in the last 30 years in this region was dominated by multidecadal natural variability. They argue that this is more effective in increasing PI than increases in SST related to climate change. In contrast, the observed increases in both global and basin proportions of intense hurricanes found by Holland and Bruyère were all related to global changes, which models indicated were arising from anthropogenic effects, and they could find no natural multidecadal trend in the models that could explain this behavior. Projections are uncertain on whether relative SST (or tropical storm frequency) in the Atlantic basin will increase during the 21st century under GHG forcing. In addition, the role of tropopause temperature trends in observed changes in the PI appears unresolved, thus reducing our confidence in future projections of this relationship.
For both the Holocene (6 ka before the present) and the Last Glacial Maximum (LGM; 21 ka), Korty et al. show that even though conditions during the LGM were cooler than today, there was not a systematic decrease in either PI [potential intensity?] or other environmental variables associated with TC frequency. Sugi et al. found that their model-simulated TC frequency significantly increases in a 4K cooler climate GCM experiment, indicating that there may be more TCs in a glacial period, consistent with the consensus finding that overall TC frequency decreases with warming43 and showing that a climate with generally cooler SSTs does not imply fewer TCs. They also pointed out that TC formation under these conditions can occur at sea-surface temperatures (SSTs) well below 26C, a value conventionally used to indicate the minimum threshold for TC formation in our present-day climate. Merlis used the GFDL HiRAM model to show that TC frequency was simulated to increase during the LGM.