In Part VI we looked at past and projected sea level rise. There is significant uncertainty in future sea level rise, even assuming we know the future global temperature change. The uncertainty results from “how much ice will melt?”
We can be reasonably sure of sea level rise from thermal expansion (so long as we know the temperature). By contrast, we don’t have much confidence in the contribution from melting ice (on land). This is because ice sheet dynamics (glaciers, Greenland & Antarctic ice sheet) are non-linear and not well understood.
Here’s something surprising. Suppose you live in Virginia near the ocean. And suppose all of the Greenland ice sheet melted in a few years (not possible, but just suppose). How much would sea level change in Virginia? Hint: the entire Greenland ice sheet converted into global mean sea level is about 7m.
Zero change in Virginia.
Here are charts of relative sea level change across the globe for Greenland & West Antarctica, based on a 1mm/yr contribution from each location – click to expand:
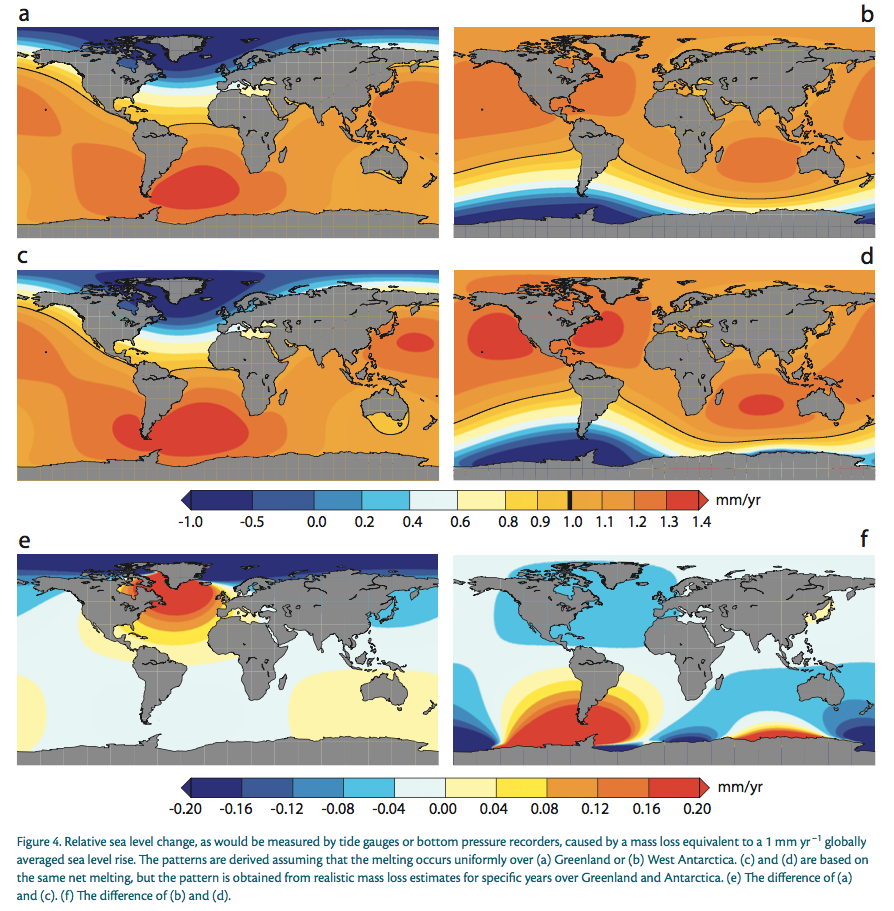
From Tamisiea 2011
Figure 1 – Click to Expand
We see that the sea level actually drops close to Greenland, stays constant around mid-northern latitudes in the Atlantic and rises in other locations. The reason is simple – the Greenland ice sheet is a local gravitational attractor and is “pulling the ocean up” towards Greenland. Once it is removed, the local sea level drops.
Uncertainty
If we knew for sure that the global mean temperature in 2100 would be +2ºC or +3ºC compared to today we would have a good idea in each case of the sea level rise from thermal expansion. But not much certainty on any rise from melting ice sheets.
Let’s consider someone thinking about the US for planning purposes. If the Greenland ice sheet contributes lots of melting ice, the sea level on the US Atlantic coast won’t be affected at all and the increase on the Pacific coast will be significantly less than the overall sea level rise. In this case, the big uncertainty in the magnitude of sea level rise is not much of a factor for most of the US.
If the West Antarctic ice sheet contributes lots of melting ice, the sea level on the east and west coasts of the US will be affected by more than the global mean sea level rise.
For example, imagine the sea level was expected to rise 0.3m from thermal expansion by 2100. But there is a fear that ice melting will cause 0 – 0.5m global rise. A US policymaker really needs to know which ice sheet will melt. The “we expect at most an additional 0.5m from melting ice” tells her that she might have – in total – a maximum sea level rise of 0.3m on the east coast and a little more than 0.3m on the west coast if Greenland melts; but she instead might have – in total – a maximum of almost 1m on each coast if West Antarctica melts.
The source of the melting ice just magnifies the uncertainty for policy and economics.
If this 10th century legend was still with us maybe it would be different (we only have his tweets):
Articles in this Series
Impacts – II – GHG Emissions Projections: SRES and RCP
Impacts – III – Population in 2100
Impacts – IV – Temperature Projections and Probabilities
Impacts – V – Climate change is already causing worsening storms, floods and droughts
Impacts – VI – Sea Level Rise 1
References
The moving boundaries of sea level change: Understanding the origins of geographic variability, ME Tamisiea & JX Mitrovica, Oceanography (2011)


Canute gets no respect. He knew full well that his feet were going to get wet. He was rebuking his sycophantic court.
Maybe a subtlety Donaeld the Unready didn’t appreciate. Or chose to ignore for his own ends.
We see that the sea level actually drops close to Greenland, stays constant around mid-northern latitudes in the Atlantic and rises in other locations. The reason is simple – the Greenland ice sheet is a local gravitational attractor and is “pulling the ocean up” towards Greenland. Once it is removed, the local sea level drops.
You say this is simple, which it is, but when did it first become known? I don’t know the answer. I first encountered it in papers authored by Jerry Mitrovica, now of Harvard.
His team recently offered a solution for Munk’s enigma.
This same group is saying the 20th century rate of SLR is 1.1 to 1.2 mm/yr. That would mean the acceleration to date is larger… maybe even impossible.
Mitrovica came with some papers in 1996 and 1997. There he laid down some important ideas. It was a beginners job even if it didn`t get it right. Munk (Oceans Einstein) took up some of this perspective in his enigma from 2002. These men show a much deeper understanding than all the later climate activists who call themselves scientists.
Ridiculous.
We are deeply disturbed by the recent escalation of political assaults on scientists in general and on climate scientists in particular. All citizens should understand some basic scientific facts. There is always some uncertainty associated with scientific conclusions; science never absolutely proves anything. When someone says that society should wait until scientists are absolutely certain before taking any action, it is the same as saying society should never take action. For a problem as potentially catastrophic as climate change, taking no action poses a dangerous risk for our planet. … – signed by a large number of scientists, including Walter Munk
There are different questions. One is how sea level budget doesn`t fit with what istitutions estimate is sea level change, which Munk did adress in a brilliant way. The other is melting of ice in Antarctica and Greenland, which he was afraid of without looking at it in a scientific way.
JCH, about sea level acceleration:
“This same group is saying the 20th century rate of SLR is 1.1 to 1.2 mm/yr. That would mean the acceleration to date is larger… maybe even impossible.”
The groups results will also show that the “consensus” on later sea level rise is to high, as it shows that the GIA corrections are to high.
From Jones, Mitrovica et al 2001: About GIA models
– Uncertainty of sea‐level due to G IA 0.1–0.5 mm/yr (?)
– Models for GIA are useful, but not at level of “correction”
– “GIA researchers” are generally interested more in the physics than the predictive capabilities
– No careful analysis of uncertainties has been undertaken
– Such an analysis would be useful in quantitative assessment of sea‐level uncertainties
JCH: As an innate skeptic, I didn’t want to simply the gravitational pull of all that ice on Greenland could be sucking that much water next to its coast. So I did calculate the relative gravitational pull from the ice in Greenland vs that of the Earth. In Greenland, assume all of the mass (2,850,000 km3 = 2.6E18 kg) is in the center of the island a few hundred kilometers from water near the coast. For Earth, assume all the mass (6E24 kg) is located at the center (6371 km from the surface). The Earth’s mass is about 2.5E6 larger. The ocean near Greenland is easily 10X closer to the ice cap than the center of the Earth and this factor is an inverse square. That produces a relative pull – and slope – of 25,000:1. So, if you move 25 kilometers closer to Greenland (from 650 to 625 km away from the center), the gravity of the ice cap has raised the surface of the water by 1 m. So there is a significant amount of water being pulled towards Greenland.
When we talk about ice caps melting and raising sea level by 1 mm/yr or 1 m total, what fraction of the ice cap is actually melting?
Surface of ocean: 5.1E8 km2
Area of Greenland (ratio): 2.17E6 (235:1)
GIS is 80%: 1.74E6 (293:1)
Area of Antarctic (ratio): 5.1E6 km2 (100:1)
West Antarctic Ice Sheet: 10% of all Antarctic ice (1000?:1)
So 1 m of SLR from Greenland will lower the average height by roughly 300 m, about 1/7 of height (consistent with the statement that total melting will produce 7 m of SLR). 1 mm/yr of SLR from Greenland is therefore 0.3 m/yr or 3 m/decade. The density of newly fallen snow is about 10% of that of water and firn (snow packed by the weight of snow above, but not yet ice) is 550-830 kg/m3. Until through the layer of firn on top of the GIS, the drop could be twice as big.
Frank – I think it depends on precipitation and where it falls. If Greenland were to get more snowfall because of AGW, then its glacier height could increase, but its borders would shrink. Somewhere I read a paper that indicated perhaps more of past higher sea level came from Antarctica than previously thought, and less from Greenland. Greenland can be a bit of an ice fortress.
I think the picture from Tamisisea is missing some details relevant for regional relative sea level trends. AR5 Chapter 13 shows in Figures 13.18 to 13.20 responses to various factors, including those shown here + GIA, projected glacier loss, hydrological and circulatory responses.
Figures 13.19 and 13.20 show projected relative sea level changes and they indicate greater sea level rise around US coasts compared to the global average. I think this is mostly related to circulatory changes – typically talked about in terms of a gulf stream slowdown. It’s possible these projections are based on smaller Greenland losses than assumed by the figures here.
… the two scenarios in Figure 4a,b show distinct spatial geometries. Indeed, these geometries will be unique to a given ice source, and so they have come to be known as sea level fingerprints. Notice that the zone of sea level fall around a melting ice sheet extends ~ 2,000 km from the margin of the ice sheet. Thus, melting of Greenland ice, for example, leads to a drop in sea level as far south as Newfoundland in Canada and northern Britain, … – Tamisiea, M.E., and J.X. Mitrovica
Greenland to Virginia is ~3400 kilometers.
Melting of polar glacial ice is a very slow process ( it took roughly 17,000 years from the LGM to the HCO, most of it with greater summer insolation than now, and even that wasn’t enough to gid rid of Greenland’s ice ).
Calving of polar glacial ice is a very quick process.
So calving has the greatest risk potential.
But calving is determined largely by what happens at the base of the ice, as opposed to melting which is determined by what happens on the surface of the ice.
Was this calving then?
There are several old newspaper articles about this melting that seems to have been going on for pherhaps as long as 30 years. Of course the melting was not measured by satellites or anything, but I don’t think we can say it was small or insignificant and it would be unwise to say it is not true.
I never see this early 20th century melting of the Arctic Ice Sheet mentioned when melting is the topic. Based on what those old articles say, it was a much bigger melting than what we have seen in our days.
Greenland is positioned on thin crust with large heat flows from below. I thought it was agreed that much melting happened below the ice. That would fit with observations of meltwater from the top ice increasing the outflow at the coasts at first, but then it slows down, even if surface melting is happening at the same pace. The mechanism behind it is that the cold meltwater in large amounts cool of the ground below the ice.
“Was this calving then?”
I don’t think so. The article mentions sea ice. Presumably, calving would freshen the waters, and thus facilitate sea ice formation.
The temperature pattern for the early 20th century bears a clear fingerprint of reduced sea ice ( anomalously warmer in winter because of the release of latent heat of freezing, anomalously cooler in summer because of uptake of latent heat of melting ).

Manabe has said he does worry about surface meltwater reaching the base of glacial ice. I don’t know enough to weigh in other than to ask if it happened during the Holocene Climatic Optimum, and if not, why not?
“Turbulent Eddie
I don’t think so. The article mentions sea ice. Presumably, calving would freshen the waters, and thus facilitate sea ice formation.”
But as you can see in the article, the gulf stream was very warm and strong. That means that we are observing heat transfer from the equator. Caused by temperature difference.
[…] « Impacts – VII – Sea Level 2 – Uncertainty […]
Above I calculated melting of the GIS above in terms of height. Unfortunately, the GIS isn’t melting from the top, it is mostly being squeezed out the sides.
The reference below says the height of the GIS increased at the end of the last ice age due to a 4-fold increase in snowfall.
http://onlinelibrary.wiley.com/doi/10.1029/96JC03981/epdf
What bothers me most about current melting of the GIS is the absence of dramatic changes during the Holocene Climate Optimum, when it was warm enough for trees to grow on the shore of the Arctic Ocean. Wikipedia lists temperatures 3-9 and 2-6 degC higher than today and they lasted for several millennia. Yet we never hear anything about melting of the GIS during this period. Nor extinction of polar bears.
So there may be some for skepticism about 10% of the GIS melting in the next century.
Frank. Thank you for paying attention to Greenland contribution to sea level rise.
It looks like a gigantic acceleration in ice sheet melting the last years
Kjeldsen et al 2015: Spatial and temporal distribution of mass loss from the Greenland Ice Sheet since AD 1900
“The response of the Greenland Ice Sheet (GIS) to changes in temperature during the twentieth century remains contentious, largely owing to difficulties in estimating the spatial and temporal distribution of ice mass changes before 1992, when Greenland-wide observations first became available. The only previous estimates of change during the twentieth century are based on empirical modelling and energy balance modelling. Consequently, no observation-based estimates of the contribution from the GIS to the global-mean sea level budget before 1990 are included in the Fifth Assessment Report of the Intergovernmental Panel on Climate Change. Here we calculate spatial ice mass loss around the entire GIS from 1900 to the present using aerial imagery from the 1980s. This allows accurate high-resolution mapping of geomorphic features related to the maximum extent of the GIS during the Little Ice Age at the end of the nineteenth century. We estimate the total ice mass loss and its spatial distribution for three periods: 1900-1983 (75.1 ± 29.4 gigatonnes per year), 1983-2003 (73.8 ± 40.5 gigatonnes per year), and 2003-2010 (186.4 ± 18.9 gigatonnes per year). Furthermore, using two surface mass balance models we partition the mass balance into a term for surface mass balance (that is, total precipitation minus total sublimation minus runoff) and a dynamic term. We find that many areas currently undergoing change are identical to those that experienced considerable thinning throughout the twentieth century. We also reveal that the surface mass balance term shows a considerable decrease since 2003, whereas the dynamic term is constant over the past 110 years. Overall, our observation-based findings show that during the twentieth century the GIS contributed at least 25.0 ± 9.4 millimetres of global-mean sea level rise. Our result will help to close the twentieth-century sea level budget, which remains crucial for evaluating the reliability of models used to predict global sea level rise.”
But just look a little closer to the ice loss for the years 1900 – 1983:
Estimation of the Greenland ice sheet surface mass balance for the 20th and 21st centuries X. Fettweis1 , E. Hanna2 , H. Gallee´ 3 , P. Huybrechts4 , and M. Erpicum1 2008
“The maximum, confirmed by all data sets, takes place at the beginning of the 1970s with a SMB anomaly near +200 km3 yr−1 due to a combination of cold summers and wet years. Over the period 1930–1960 and since the end of 1990s, the estimated SMB is below the 1970–1999 average. The absolute minimum occurred around 1930 with a SMB anomaly near −300 km3 yr−1 . Secondary (minor) SMB minima appear to have occurred in 1950 and 1960, equalling the surface mass loss rates of the last few years (1998, 2003, 2006), although these minima are not confirmed in all data sets. However (Chylek et al., 2007) found also a maximum melt area at the beginning of the 1930s followed by minor maxima in 1950 and 1960. The minimum SMB rates around 1930 are due to exceptionally warm summers combined with dry years inducing SMB rates lower than those currently observed, although the effect of human-induced global warming was not perceptible at that time. Around 1950 and 1960, the low SMB rates are mainly explained by positive temperature anomalies. After the 1990s, the GrIS SMB decreases slowly to reach the negative anomalies of the last few years, although the summers of the 2000s were not exceptional compared to 70 yr ago (Chylek et al., 2006).” GrIS = Greenland Ice Sheet. SMB = Surface Mass Balance
Nobodysknowledge: Calculation of mass loss from Greenland and Antarctica are complicated by the impact of glacial rebound. The height data is often adjusted to correct for an assumed amount of rebound. Rebound lowers neighboring sea floor and therefore is irrelevant to SLR. Nevertheless such corrections are standard. After all contributions to SLR are summed and publicized, a correction for GIA is added – a correction that may not be consistent with the assumptions made for Greenland and Antarctica.
nobodysknowledge,
The AMO Index peaked in the mid-1940’s and was at a minimum in the 1970’s. It’s about as high now as it was in the 1940’s. The question is whether it will begin to decline soon as predicted by a sine wave fit. If it does, then we’re likely to see a slowing of the rate of melting of the GIS.
DeWitt Payne,
“Chylek et al. (2006) conclude that the rate of
warming in Greenland between 1930 and 1940 was ~50% higher
than that observed between 1995 and 2005 (Fig. 4B). Both
warm phases broadly coincide with periods when the AMO
shifted from a cooler to a warmer phase. These climate fl uctuations
almost certainly impacted the mass balance of the ice
sheet.” From Back to the future:Greenland’s contribution to sea-level change
Antony J. Long, Department of Geography, Durham
SoD
Uncertainty is going into confusion in parts of the scientific community. The greatest exponent for this is J Hansen. His:”Scientific reticence and sea level rise”, J E Hansen 2007, is full of guesswork and absurd speculations. And he proclaim that his position is not so different from other scientists.
“Is my perspective on this problem really so different than that of other members of the relevant scientific community? Based on interactions with others, I conclude that there is not such a great gap between my position and that of most, or at least much, of the relevant community.”
“Under BAU (buisness-as-usual when it comes to emissions) forcing in the 21st century, sea level rise undoubtedly will be dominated by a third term (3) ice sheet disintegration. This third term was small until the past few years, but it is has at least doubled in the past decade and is now close to 1 mm/year, based on gravity satellite measurements discussed above. As a quantitative example, let us say that the ice sheet contribution is 1 cm for the decade 2005-2015 and that it doubles each decade until the West Antarctic ice sheet is largely depleted. That time constant yields sea level rise of the order of 5 m this century. Of course I can not prove that my choice of a 10 year doubling time for non-linear response is accurate, but I am confident that it provides a far better estimate than a linear response for the ice sheet component of sea level rise.”
“However, as a physicist, I find it almost inconceivable that BAU climate
change would not yield a sea level change measured in meters on the century time scale. The threat of large sea level change is a principal element in our argument (Hansen et al 2006a,b, 2007) that the global community must aim to keep additional global warming less than 1°C above 2000 temperature. In turn, this implies a CO2 limit of about 450 ppm, or less.”
“There is enough information now, in my opinion, to make it a near certainty that IPCC BAU climate forcing scenarios would lead to disastrous multi-meter
sea level rise on the century time scale.”
Sea-level scientists, and he is not one of them, are represented in the IPCC reports.
Many of them probably do think Hansen is right that the actual sea level rise by 2100 will exceed the current IPCC numbers by a wide margin… because they cannot model ice sheet dynamics. That gap is closing, and eventually a number will make its way into the science.
JCH: The IPCC has written:
Global mean sea level rise for 2081–2100 relative to 1986–2005 will likely be in the ranges of 0.26 to 0.55 m for RCP2.6, 0.32 to 0.63 m for RCP4.5, 0.33 to 0.63 m for RCP6.0, and 0.45 to 0.82 m for RCP8.5 (medium confidence). For RCP8.5, the rise by the year 2100 is 0.52 to 0.98 m, with a rate during 2081 to 2100 of 8 to 16 mm yr–1 (medium confidence). These ranges are derived from CMIP5 climate projections in combination with process-based models and literature assessment of glacier and ice sheet contributions (see Figure SPM.9, Table SPM.2). {13.5}
Based on current understanding, only the collapse of marine-based sectors of the Antarctic ice sheet, if initiated, could cause global mean sea level to rise substantially above the likely range during the 21st century. However, there is medium confidence that this additional contribution would not exceed several tenths of a meter of sea level rise during the 21st century. {13.4, 13.5}
The basis for higher projections of global mean sea level rise in the 21st century has been considered and it has been concluded that there is currently insufficient evidence to evaluate the probability of specific levels above the assessed likely range. Many semi-empirical model projections of global mean sea level rise are higher than process-based model projections (up to about twice as large), but there is no consensus in the scientific community about their reliability and there is thus low confidence in their projections. {13.5}
I don’t see any justification for asserting the IPCC’s experts believe Hansen is right about an EXPONENTIAL rate of growth in SLR.
If I have done my math correctly, the current rase of SLR (2.5 cm/decade or mm/year) only needs to double twice for SLR to reach 1 m in one century So doubling time would be about 30 years, not Hansen’s 10 years.
And in the unlikely event of ice sheet collapse, there is medium confidence that the increase in SLR will be only a few tenths of a meter. For 1.25 and 1.50 m of SLR, the doubling times are only 26 and 24 years.
If my math is correct (and it is worth checking), Hansen is ridiculously far off.
dz/dt = A*exp(kt)
where A is the current rate (t= 0) of 0.25 m/century and t is measured in centuries. Integrating
z(t) = (A/k)*[ exp(kt) – exp(0) ]
z(t=1) = (A/k)*[ exp(k) – 1 ]
For 1 m of SLR in one century, z(t=1) = 1
4 = (1/k)*[ exp(k) – exp(0) ]
k = 2.337 (trial and error)
For the rate of SLR to double, exp(kt) = 2. kt = ln 2. t = 0.30 centuries to double.
If z(t=1) = 1.25 m, z(t=1)/A = 5 and k = 2.66. Doubling time = 26 years.
If z(t=1) = 1.50 m, z(t=1)/A = 6 and k = 2.92. Doubling time = 24 years.
Hansen: “That time constant yields sea level rise of the order of 5 m this century.”
And in about 200 years the sea level reached the top of Mount Everest.
When my Uncle first started working as physicist at Navy Research Labs during WW2 they would see a crack in samples of metal used to make armor/wings/hulls/etc., and they had no way at all to predict when the sample would experience catastrophic failure.
But they all knew that it would.
So they kept working on the problem and out it grew a thing called fracture mechanics, and they saved a lot of lives because they were able to make better armor/wings/hulls/etc., and better maintenance thereof.
Look at how many sea level scientists challenged Hansen’s sea ice and storms paper. The record is online.
JCH: Does Hansen have any business using unresolved scientific speculation for political purposes – especially when his speculation produces absurdly different outcomes compared with the IPCC’s projections? At least the lukewarmers who hope energy balance models are correct have Otto (2013) as support for their position.
JCH wrote: “When my Uncle first started working as physicist at Navy Research Labs during WW2 they would see a crack in samples of metal used to make armor/wings/hulls/etc., and they had no way at all to predict when the sample would experience catastrophic failure. But they all knew that it would.”
So your Uncle started a successful campaign to ban the use of dangerous metal in cars, trains, and airplanes, bankrupting these industries, creating another Great Depression, and reducing everyone’s standard of living … until the fatigue problem was resolved???
We all know the Earth will warm. If we make sensible choices now and economic growth continues, our vastly richer and technologically-advanced descendants may be far more capable of adapting to warming than most countries today are capable of mitigating warming. Especially if climate sensitivity is a low as suggested by energy balance models. Incidentally, the future economic growth rate is a factor in the Ramsey equation used to calculate an optimum discount rate for the social cost of carbon. The higher the projected economic growth, the higher the discount rate.
Hansen really does spout nonsense, seeming to take uncertainty as an excuse to just make stuff up. He has no basis to assume exponential growth for melting. That does not strike me as remotely plausible, even if sea level rise is accelerating. The 10 year doubling time is pulled out of the air. Melting would surely decelerate well before the ice sheet is fully depleted. The unstable part of the ice sheet can’t produce a 5 meter rise. Five meters in a century would be roughly the maximum rate of sea level rise (meltwater pulse 1A) at the end of the last glaciation; that is obviously not something achievable with the ice sheets as they are now. But his calculation assumes that, at the end of the century sea level will be rising at 50 meters/century. The man has lost his mind.
Hansen concludes that “the global community must aim to keep additional global warming less than 1°C above 2000 temperature. In turn, this implies a CO2 limit of about 450 ppm, or less.” But even with a extreme TCR of 2.5 K, at the top of the IPCC range, 1°C warming would require an increase in CO2 of nearly 30%, so 500 ppm would be acceptable.
A 30% increase from now? Okay, I follow that — but recall that we still have warming “in the pipeline” from past emissions.
ECS is probably more appropriate than TCR here.
Windchaser wrote: ” recall that we still have warming “in the pipeline” from past emissions.”
There is no significant warming in the pipeline. If we keep CO2 at a constant level, then there will indeed be additional warming, represented by the difference between TCR and ECS. But that additional warming will be due to future emissions, not past emissions. The reason is that continued emissions would be needed to keep CO2 at the new level. If we stop emitting CO2, the atmospheric concentration would start to decrease as CO2 is transferred to the deep ocean and into biomass. Temperature would likely drop as equilibrium is approached. It makes no sense to combine equilibrium sensitivity with transient CO2.
Is there any sign atmospheric CO2 is about to be held at the current level, ~404 ppm?
We are currently in theoretical balance with what level of atmospheric CO2?
JCH wrote: “Is there any sign atmospheric CO2 is about to be held at the current level, ~404 ppm?”
Of course not. Why do you ask?
JCH wrote: “We are currently in theoretical balance with what level of atmospheric CO2?”
I assume that you mean the level that we would end up at if we stopped all emissions. Conventional wisdom would put that at about 320-340 ppm. There is evidence that some of the saturation effects are less stringent than has been assumed, in which case the equilibrium amount would be lower.
What I am asking is, if you select your number for the current GMST, with what level of atmospheric CO2 is your assessment of the current GMST in balance? I read a blog comment last night that claims we are not yet in balance with 385 ppm, which is the mean level for 2008, and indicates they think there is warming in the pipeline. You don’t.
JCH wrote: “What I am asking is, if you select your number for the current GMST, with what level of atmospheric CO2 is your assessment of the current GMST in balance?”
There are multiple ways to interpret that question. Obviously, the current GMST is roughly in balance with the current atmospheric CO2. So you must be asking about some hypothetical future; but you have not specified what future you mean. If you mean by ” level of atmospheric CO2″ the total amount that we have emitted to date, then equilibrium GMST change would be perhaps -0.2 C from what we have now. If you mean “what will happen to GMST if we continue to emit enough CO2 to maintain 404 ppm”, then maybe 0.5 C additional warming. But that warming will be due to future CO2 emissions, not past emissions.
Windchasers wrote: “recall that we still have warming “in the pipeline” from past emissions.”
That agrees with my understanding of what people usually mean by “in the pipeline”: future warming from past emissions. I can find no valid basis to believe that there is any warming in the pipeline. If you assume that CO2 will stay at 404 ppm if we were to stop emitting, then there would be warming in the pipeline. But that is a thoroughly false assumption. Others seem to assume that since warming has been less than predicted, there must be warming hiding somewhere and waiting to jump out and bite us. That is just silly.
What is in the pipeline? I have tried to ask a question elsewhere about what is the natural ocean temperature given the present conditions. There seems to be no answer. Some of the deep ocean has still been cooling since LIA. So there is some cooling in the pipeline. And I think there is also some warming potential. Can anyone say if there is an equilibrium point for Ocean Heat Content if forcings were held constant? Or would this only be wild speculations?
The most thorough study of deep ocean temperatures:
Professor Wunsch and Dr Heimbach say trends showed a warming in the upper ocean and a net cooling below 2000m. Below 3600m, the cooling is about 0.01C over 19 years.
The pipeline is future sunlight interacting with an earth system experiencing a positive imbalance for as long as that imbalance persists.
Two further points have come in comment threads recently that are related to this. The first is whether the changes in deep ocean heat content have any direct impact other than damping the surface response to the ongoing radiative imbalance. The deep ocean is really massive and even for the large changes in OHC we are discussing the impact on the deep temperature is small (I would guess less than 0.1 deg C or so). This is unlikely to have much of a direct impact on the deep biosphere. Neither is this heat going to come back out from the deep ocean any time soon (the notion that this heat is the warming that is ‘in the pipeline’ is erroneous). Rather, these measures are important for what they tell us about the TOA radiative imbalance and it is that which is important for future warming. – Gavin Schmidt (2011)
nobodysknowledge wrote: “What is in the pipeline? … Can anyone say if there is an equilibrium point for Ocean Heat Content if forcings were held constant?”
As near as I can tell, the “pipeline” usually refers to the difference between TCR and ECS. The latter is the temperature change that would eventually occur if forcing was held constant for long enough. The problem is that to hold forcing constant, we would have to keep emitting CO2, albeit at a reduced rate. So it is not the CO2 already emitted that leads to the extra warming.
The reason that TCR is less than ECS is that heat is flowing into the ocean below the mixed layer. (“Deep ocean” is problematic here since that means a variety of things, depending on context). That heat flow results in cooling (essentially a negative feedback) that will gradually go away as the ocean warms. I think that the relevant heat flow is actually into the thermocline, but I am by no means certain. The temperature of water below the thermocline is set by the coldest parts of the surface ocean, so I think that doesn’t really change. But again, I am not sure.
nobodysknowledge wrote: “Below 3600m, the cooling is about 0.01C over 19 years.”
I doubt that has much statistical significance.
JCH wrote: “The pipeline is future sunlight interacting with an earth system experiencing a positive imbalance for as long as that imbalance persists.”
I have no idea what that means, or even if it means anything.
Mike M.,
I don’t believe that’s correct. Heat flowing into the ocean must come from a radiative imbalance at the TOA, i.e. a forcing. TCR still applies to that forcing. ECS higher than TCR means that there are positive feedbacks which develop slowly, so that mean surface and atmospheric temperature increases reduce the forcing only slightly at low forcing and long times. This is the systematic non-linearity that you dismissed some time ago. I doubt this non-linearity exists in the real world. IMO, it’s a model artifact based on, among other things, poor cloud parameterization.
DeWitt wrote: ” Heat flowing into the ocean must come from a radiative imbalance at the TOA, i.e. a forcing. TCR still applies to that forcing.”
Yes, the heat flow into the ocean is equal to TOA imbalance. But forcing is not equal to the TOA imbalance. If you introduce a step change of forcing in a model, there will initially be an TOA imbalance equal to the forcing. The temperature will rise in response to the imbalance. As a result, the energy flow out will increase. At equilibrium, the balance will be restored. The T rise at that point is ECS.
If there is a TOA imbalance, then energy must be flowing from/to someplace in the system. On times scales of a decade or so, that means the ocean below the mixed layer. Since energy flux out is less than energy in, the temperature driving the energy out is lower than at equilibrium. The resulting T rise is TCR.
Mike M.,
Yes, it is. Nominally, forcing is calculated from the imbalance at the tropopause, but that’s because the stratosphere equilibrates fairly rapidly. But an imbalance at the tropopause means an imbalance at the TOA, although it may not be identical to the imbalance at the tropopause. Imbalance≡forcing.
DeWitt wrote: “Nominally, forcing is calculated from the imbalance at the tropopause,”
At present, the imbalance at the tropopause is about 0.5 W/m^2, calculated from the rate of ocean heating. But the forcing is about 2.3 W/m^2, quite uncertain since it can not be measured. You are misled by sloppy and confusing statements based on what modellers do to estimate forcing in a model. They do a step change in CO2, calculate modeled TOA imbalance as a function of time, then extrapolate the imbalance to zero time. They sometimes say that forcing is equal to the TOA imbalance, omitting to mention the requirement that everything else be the same as it was without the forcing.
As I earlier wrote: “Some of the deep ocean has still been cooling since LIA. So there is some cooling in the pipeline.” I now see that I misunderstood the consept of pipeline. I should probably have called it long memory. And I find it interesting how Wunch and Heimbach present it.
From Wunch and Heimbach: Bidecadal Thermal Changes in the Abyssal Ocean, 2014
“Nonetheless, for scaling purposes, suppose the approximately 0.28C change over the last about 20 yr corresponds to an exchange between ocean and atmosphere of 1Wm-2. Then for example, the long decline from the
year 1000 CE to about 1700 CE, if it too should correspond to 1W m-2, would imply a temperature reduction of about 35 times that estimated above for a 20-yr interval.
That reduction would then be overlain by the previous warming and then the rewarming over the past 300 yr. Unless existing circulation rates have been grossly underestimated, the signature of the past state must be present in any measure of basin-scale and larger heat content or temperature shifts of the past few decades. No details are available, but discovering that parts of the system are still changing in ways unconnected to the recent increase in global average temperatures would not be a surprise.”
They are talking of long memory of earlier states which is very important for how warming is taken up, and how OHC is distributed.
I don`t really like the “warming-in-the-pipeline” stuff. It gives an impression of some energy that has piled up, to be released at a later point. Some warming already located, when it just means that there will be some warming in the future. And how much and in what way is unclear. A misleading rhetoric from Mr Hansen and co?
nobodysknowledge
I haven’t followed all the discussion, due to travel. Apologies if I am behind the curve..
Shorthand definitions can always be misleading, but they have some benefits compared with paragraph-length definitions.
The idea is simply:
More GHGs in the atmosphere create a forcing – an imbalance between outgoing OLR and absorbed solar.
Even if we stabilized GHGs today (somehow – it’s just a thought experiment) then temperature would continue rising..
Because the imbalance won’t disappear until the surface temperature reaches current temperature + ΔT, where ΔT is the new surface temperature where outgoing OLR will again match absorbed solar. [Note – shortly after posting the comment I see an error – I should have written “where ΔT is the increase in surface temperature where outgoing OLR will again match absorbed solar”]
Nobodysknowledge: Right now, the current anthropogenic forcing is about 2.5 W/m2 and Argo shows that 0.5 W/m2 of heat is flowing into the ocean. (0.7 W/m2 may be the latest value.) To a first approximation, the heat capacity of the land and atmosphere is negligible compared with the ocean. About 93% of the current TOA imbalance supposedly flows into the ocean. That means that the current radiative imbalance at the TOA is about 0.5 W/m2. Therefore, warming since the Industrial Revolution has resulted in an increase in TOA OLR of about 2.0 W/m2 (2.5 W/m2 of forcing minus the current imbalance -.5 W/m2). If emissions reductions suddenly halted the increase in anthropogenic forcing*, the temperature of the deep ocean would gradually come into equilibrium with the now warmer surface over a few centuries. Then 0.5 W/m2 will no longer be flowing into the ocean. During this period, the earth will need to warm another 25%, so that it can send an additional 0.5 W/m2 to space as OLR to restore balance. That is the 0.5 W/m2 that used to be flowing into the ocean.
The above words come from these equations:
TCR = F_2x * dT / dF
dF/F_2x = dT/TCR
ECS = F_2x * dT / (dF-dQ)
(dF-dQ)/F_2x = dT/ECS
dF is the current forcing. dT is the current warming. dQ is the current uptake of heat by the ocean. F_2x is the forcing from a doubling of CO2, usually 3.7 W/m2. dF/F_2x is current forcing expressed as a fraction of a doubling of CO2.
dT/TCR is current warming as a fraction of transient warming expected for doubling.
*As Mike has pointed out, if we cease emissions, CO2 will fall. Today we emit enough to raise CO2 by 4 ppm and 2 ppm (of today’s 400 ppm) is disappearing into “sinks” on land and the ocean. We need to cut emissions by 50% to stabilize – as long as the land sink doesn’t saturate.
Hope you all don’t think I am too much of a PITA, writing long posts about how flawed I think greenhouse theory is. I am just really interested in this conflict between what I see as the greatest science in history of mankind, the theory of thermal energy, and the greenhouse theory. In here you at least have a nice approach to people having different views, in contrast to almost all other discussions on the web. A certain site, named skeptica*sci*nce, which I´m sure you know of, attack opponents immediately with condescending tone throughout, without arguments and focused on “denialism” instead of science. They don’t realize how that makes them appear like bullies. Anyway…
“Nobodysknowledge: Right now, the current anthropogenic forcing is about 2.5 W/m2 and Argo shows that 0.5 W/m2 of heat is flowing into the ocean. (0.7 W/m2 may be the latest value.)”
I have been wondering for some time, the term forcing, where does it come from? Are there any other physics beside greenhouse theory where we find “forcing” that can confirm the mechanism, because I can’t understand it. In physics you either have a force or you don´t. A force requires energy which has to be accounted for, an it performs work on a system, but a forcing doesn’t add any energy and it is claimed to increase energy anyway. If something is acting on something and there is an involved change in emission from a body so that it increase, that energy has to be accounted for and it must have a source. A forcing increase energy without adding any, in a system where we all know energy is limited.
And heat flowing into the ocean, how could anyone possibly know? First thing I want to know is, what is the measured change in temperature in the depth of the ocean? Second, we hardly measure temperature in the south hemisphere ocean, because there are very few boats travelling those waters, how do you support a conclusion about the worlds oceans with a mean depth of a couple of thousand meters, when we don’t measure it with coverage enough to know anything about how much heat goes into the ocean?
“Therefore, warming since the Industrial Revolution has resulted in an increase in TOA OLR of about 2.0 W/m2 (2.5 W/m2 of forcing minus the current imbalance -.5 W/m2). If emissions reductions suddenly halted the increase in anthropogenic forcing*, the temperature of the deep ocean would gradually come into equilibrium with the now warmer surface over a few centuries.”
So there is a half Watt less going out than in, and TOA OLR has increased 2 Watts. Wouldn’t that mean that we used to have a forcing of -2.5Watt/m^2 when there was less co2?
When you write a few centuries, I can’t see how that fits in with the theory of thermal radiation. When describing a system that has a constant and limited amount of energy, you don’t describe the internal state of any parts of the system or as a whole, over centuries. You should have a model of one second, the time used for the unit of energy, Watt. Earth is, if not in equilibrium, is in a steady state. All the energy flows through the system at light speed and every single part at any moment emits an intensity dependent only on it´s internal state. All temperatures stand on their own at any single moment.
“TCR = F_2x * dT / dF
dF/F_2x = dT/TCR
ECS = F_2x * dT / (dF-dQ)
(dF-dQ)/F_2x = dT/ECS”
Do you have an equation describing the “forcing”? Or a reference explaining what it is on it´s own, in physics litterature that is not about the greenhouse theory? Like how a force is explained.
There seems to be some science in the spirit of Hansen. (Antrophenogenic drowning of our grandchildren).
“If current greenhouse gas emission trends continue, these rates will likely increase in the coming decades and centuries. Over the next 1000 years, sea-level is projected to rise at an average rate of 3.44 cm yr−1, if all available fossil fuel resources are combusted and the CO2 released to the atmosphere.” and “Unrestrained fossil-fuel combustion with release of CO2 to the atmosphere has the potential to ultimately melt all of Antarctica –“.
From:Adapting to rates versus amounts of climate change: a case of adaptation to sea-level rise. Soheil Shayegh1, Juan Moreno-Cruz2 and Ken Caldeira1. Published 4 October 2016. http://iopscience.iop.org/article/10.1088/1748-9326/11/10/104007
They build their cathastrophic scenario on another “scientific” work:
Winkelmann R, Levermann A, Ridgwell A and Caldeira K 2015 Combustion of available fossil fuel resources sufficient to eliminate the Antarctic ice sheet.
“The Antarctic Ice Sheet stores water equivalent to 58 m in global sea-level rise. We show in simulations using the Parallel Ice Sheet Model that burning the currently attainable fossil fuel resources is sufficient to eliminate the ice sheet. With cumulative fossil fuel emissions of 10,000 gigatonnes of carbon (GtC), Antarctica is projected to become almost ice-free with an average contribution to sea-level rise exceeding 3 m per century during the first millennium.”
Activist fingerprints?
The message is clear. The first tipping point has arrived:
“The West Antarctic Ice Sheet may already have tipped into a state of unstoppable ice loss, whether as a result of human activity or not. But if we want to pass on cities like Tokyo, Hong Kong, Shanghai, Calcutta, Hamburg and New York as our future heritage, we need to avoid a tipping in East Antarctica,” Levermann said.
NK: None of these cities existed in anything like their current form 200 years ago, much less 1000 years ago. Any they won’t exist in anything like their current form 1000 years in the future, no matter what we do about burning fossil fuels. One thing that is less likely to happen in the future is that they end up 100 meters further above sea level (and miles from the ocean) during an upcoming ice age.
More seriously, speculating about the future is leaving science for philosophy and hubris. Change always appears bad. Last time sea level was low, humans came to the Americas and Australia and hunted to extinction most of the large land mammals. A mile of ice covered parts of the Northern Hemisphere, deserts expanded from reduced precipitation and winds covered vast areas with silt (loess). CO2 in the atmosphere dropped to a point near where plants stop growing. One could argue that the cold period that began 30 million years ago (and buried Antarctica under a mile of ice and later produced ice ages) was a disaster.
As for hubris, what could people living 100 years ago have spent a few percent of their GDP on to make today’s world a better place? At the moment, “long-range” planning for most governments refers to the next decade or two. With trillions in unfunded liabilities, planning for even the second half of 21st century is beyond the demonstrated competency of democracies. The nest millennia is pure fantasy. Perhaps the best we can do is to focus on continued economic growth – something that can solve many, but certainly not all, problems. Negative externalities associated with growth are important, but usually difficult to accurately quantify, assuming that unbiased experts existed.
And the “scientist” Ken Caldeira who is a member of both research groups:
“If we don’t stop dumping our waste CO2 into the sky, land that is now home to more than a billion people will one day be underwater,” Caldeira said.
NK,
You notice that’s 3m in the first millenium or an average of 3mm/year. It would take many thousands of years to actually melt the Antarctic ice cap, possibly many tens of thousands of years. Meanwhile, carbon emissions would not be continuing and the atmospheric CO2 concentration would be dropping.
It’s science fiction, not fact. And bad sci-fi at that.
DeWitt Payne
The Science fiction tells us that ocean will rise 3,44 cm pr year and 3 m pr century. So it will be 30 m pr millennium. And the Greenland ice cap will probably go faster. So in 2000 years the ocean will be 70 m higher than today. Just prepare.
There are now two groups of scientists using different methods who have concluded SLR in the 20th century was ~1.2 mm/yr, which is less than previous studies. Since 1990 the trend is about 3 mm/yr, the last 10 years is above 4 mm/yr.
And could it be some Antarctic cooling with higher consentration of CO2?From How increasing CO2 leads to an increased negative greenhouse effect in Antarctica. Authors Holger Schmithüsen, Justus Notholt, Gert König-Langlo, Peter Lemke, Thomas Jung, 2015. http://onlinelibrary.wiley.com/doi/10.1002/2015GL066749/full
About temperature inversion: “The intensity maximum in the CO2 band above Antarctica has been observed in satellite spectra [Thomas and Stamnes, 1999, Figure 1.2c], but its implication for the climate has not been discussed so far.”
“However, if the surface is colder than the atmosphere, the sign of the second term in equation (1) is negative. Consequently, the system loses more energy to space due to the presence of greenhouse gases.”
“This implies that increasing CO2 causes the emission maximum in the TOA spectra to increase slightly, which instantaneously enhances the LW cooling in this region, strengthening the cooling of the planet.”
“This observation is consistent with the finding that in the interior of the Antarctic continent the surface is often colder than the stratosphere; therefore, the emission from the stratospheric CO2 is higher than the emission from the surface.”
And even over Antarctica climate models have systematic bias: “This suggests that current GCMs tend to overestimate the surface temperature at South Pole, due to their difficulties in describing the strong temperature inversion in the boundary layer. Therefore, GCMs might underestimate a cooling effect from increased CO2, due to a bias in the surface temperature.”
So what about the inversion over Greenland plateau then?
The mean annual temperature of the interior is −57 °C (−70.6 °F).And with more CO2 in the air it will be even colder.
So, Ricarda Winkelmann, Anders Levermann, Andy Ridgwell and Ken Caldeira: “Antarctica is projected to become almost ice-free”. Were you sleeping during the basic course in climatology, when it was about temperature inversion? It has been known at least for 50 years that surface is colder than the overlaying atmosphere over Antarctis. Or: Where did you get the idea that ice melt at – 57 deg C?
Mountains, plateaus, valleys, slopes, reverse slopes… warmer oceans.
Rhe radiative cooling over Antarctica result in a wind pattern that has global effects, as it spread the cold air over vast areas. This is the katabatic winds. “Below 60°S winds are largely katabatic, this is a result of cold air forming over the pole and falling (as cold air is heavier). The pole is on a high plateau 3,000m (10,000ft), so the cold air falls down the slope getting faster as it goes. By the time it gets to the coast, the earth’s rotation (Coriolis force) makes the wind westerly.” These winds seldom reach teperatures over freezing until they reach the ocean.
There is a very useful analysis of Antarctic climate in an article of David Brockett, 2005, “Antarctic katabatic winds”. It says somthing about: “Mountains, plateaus, valleys, slopes, reverse slopes… warmer oceans.” And ends with some words about climate models. “Mesoscale (spatial scale of about 10 – 1000 km) analysis of catabatic winds is a scale not resoved by
current climate models”. Another systematic bias?
Click to access Brockett_D_Lit.Review.pdf
Many scientists have been investing their prestige in the melting of Antarctica. “Many earlier studies have found an overall net loss of ice from Antarctica. A 2012 review3, which aimed to reconcile findings from the many techniques that are used to measure ice-mass balance, calculated a loss of 72 billion tonnes of ice from the entire Antarctic ice sheet each year between 2003 and 2008.” And IPPC 2013: “The average rate of ice loss from the Antarctic ice sheet has likely increased from 30 [–37 to 97] Gt yr–1 over the period
1992–2001 to 147 [72 to 221] Gt yr–1 over the period 2002 to 2011.”
And they had no idea how untrue this was?
The truth is that Antarctica is cooling and is gaining ice. According to Zwally et al 2015: “Mass gains of the Antarctic ice sheet exceed losses.” The contribution to the sea level budget is negative. “The good news is that Antarctica is not currently contributing to sea level rise, but is taking 0.23 millimeters per year away,” Zwally said. Great confusion among all the scientist-activists. So Zwally give them some reassuring words : “As global temperatures rise, Antarctica is expected to contribute more to sea-level rise, though when exactly that effect will kick in, and to what extent, remains unclear.” It feels good to combine science with some hand waving arguments. But I think physics tells another story. That increased CO2 will continue to make the Antarctic ice grow by radiative cooling and freezing winds.
Great confusion among all the scientist-activists.
No. Since Zwally there have been comments published on his paper that dispute his result, and there have been papers published showing a different result. So far Zwally stands alone. That doesn’t mean he’s wrong, but it is just a little strange that anti-activists are so ardent in accepting and trumpeting his result. His solid conclusion that they would in fact do that.
JCH. Great confusion among all the scientist-activists. As is shown in : “Antarctic climate change and the environment: an update”, 2013. Reduction of critical thinking to some mantra. “However, the effects of increased greenhouse gases and decreases in stratospheric ozone are already evident. The effects of the expected increase in greenhouses gases over the next century, if they continue to rise at the current rate, will be remarkable because of their speed, and because of polar amplification of the global warming signal.”
So: John Turner, Nicholas E. Barrand, Thomas J. Bracegirdle, Peter Convey, Dominic A. Hodgson, Martin Jarvis, Adrian Jenkins, Gareth Marshall,
Michael P. Meredith, Howard Roscoe, Jon Shanklin, John French, Hugues Goosse, Mauro Guglielmin, Julian Gutt, Stan Jacobs, Marlon C. Kennicutt, Valerie Masson-Delmotte, Paul Mayewski, Francisco Navarro, Sharon Robinson,Ted Scambos, Mike Sparrow, Colin Summerhayes, Kevin Speer, Alexander Klepikov. Many interesting presentations of climate history, but not the same thorough methodological work as Zwally et al. And what about your assumptions that more CO2 will warm the Antarctic continent. Have you ever considered some change in radiative cooling and freezing winds?
NK and JCH: It would be nice if this data were reported in more intuitive units. Antarctica has 10% of the world’s land area or roughly 4% of the ocean’s area. So 1 mm/yr of SLR from Antarctica requires 2.5 cm/yr decrease in average height and 0.23 mm/yr is 0.5 cm/yr or 5 cm/decade. A challenging measurement.
1 Gt is 1E12 kg or 1E9 m3 or 1E6 km2-mm. Antarctica is 1.46 E7 km2. 15 Gt is 1 mm. 147 Gt/yr is about 1 cm/yr. Also challenging. IIRC, 1 cm/yr is the best we can do for satellite orbits without calibration.
Then we have GIA corrections, which seem absurd, since rising land under the AIS is compensated for by a falling sea floor near Antarctica. Nevertheless, ice altitude change is corrected for GIA and the correction is comparable to the altitude change. Challenging measurement.
I think you are right when you say it is challenging measurement, Frank. And the GIA corrections are very challenging to. The GIA values are constantly changing for Antarctica. Here is a bit of the analysis from Zwally et al for East Antarctica (EA): “The additional ice loading from a dynamic thickening of 1.59 cm a–1 over EA (Table 2) for 10 ka implies an additional bedrock depression of 27 m continuing at a rate of 2.65 mm a–1 assuming full long-term isostatic adjustment” The ice has been growing over the last 10000 years.
And science has systematically overpredicted ice loss from the Antarctic continent. This is because of systematic bias in their GIA models. As geodetic studies show.
Abstract from: “Geodetic measurements of vertical crustal velocity in West Antarctica and the implications for ice mass balance” 2009. Michael Bevis, R. Kendrick, Bob Smalley, Stephanie Konfal.
“We present preliminary geodetic estimates for vertical bedrock velocity at twelve survey GPS stations in the West Antarctic GPS Network, an additional survey station in the northern Antarctic Peninsula, and eleven continuous GPS stations distributed across the continent. The spatial pattern of these velocities is not consistent with any postglacial rebound (PGR) model known to us. Four leading PGR models appear to be overpredicting uplift rates in the Transantarctic Mountains and West Antarctica and underpredicting them in the peninsula north of 65 . This discrepancy cannot be explained in terms of an elastic response to modern ice loss (except, perhaps, in part of the peninsula). Therefore, our initial geodetic results suggest that most GRACE ice mass rate estimates, which are critically dependent on a PGR correction, are systematically biased and are overpredicting ice loss for the continent as a whole.”
And Ian D Thomas, 2011. “Our observation that GIA uplift is misrepresented by modeling (weighted root‐mean‐ squares of observation‐model differences: 4.9–5.0 mm/yr) suggests that, apart from a few regions where large ice mass loss is occurring, the spatial pattern of secular ice mass change derived from Gravity Recovery and Climate Experiment (GRACE) data and GIA models may be unreliable, and that several recent secular Antarctic ice mass loss estimates are systematically biased, mainly too high.” Citation: Thomas, I. D., et al. (2011), Widespread low rates of Antarctic glacial isostatic adjustment revealed by GPS observations,
Look at the Zwally paper and ask some very basic questions of what it is claiming. Think it through from beginning to end. He’s an outlier for a reason.
Yes it is a good idea to read the paper. It can be found here: https://wattsupwiththat.files.wordpress.com/2015/10/zwally-antarctica-study.pdf
And you can also read the attacs on the study from web sites like Real Climate and Sceptical science. And also McIntyre`s discussion on Climate Audit.
There are some uncertainties when it comes to the Antarctica mass balance, both the satellite measurements and the GIA corrections have margins of error. But I don`t think it is a great drawback of the Zwilly study that data ends in 2008 (as Mann postulates). The drawback is that the timespan is too short (1992 – 2008) to have good conclusions when it comes to trends.
We are unable to reproduce the large magnitude trend obtained in Zwally et al. [2015] using the experiments presented in this paper. We conclude that irrespective of any assumption made about the density of surface elevation changes, mass gains in the EAIS do not exceed mass losses for the West Antarctic Ice Sheet over the studied period. Furthermore, the differences in SMB estimates found between the different versions of RACMO demonstrate the importance of improving the accuracy of the SMB models if they are to be used to constrain SMB processes over vast regions such as the EAIS. …
JCH: I find this literature exceptionally difficult to understand.
1) As best I can tell, GRACE (before any corrections) says that the mass of Antarctica is increasing. (Increasing in the East and decreasing in the West)
Is that correct?
2) GIA is increasing the mass of Antarctica and lower the sea floor around Antarctica. To a first approximation, don’t these factors cancel out when calculating the contribution of changes in mass in Antarctic to SLR?
GIA corrections are important for adding up all of the global sources of SLR. To close the SLR “budget” the IPCC adds up all the sources of increasing ocean water volume. Later they make a correction for the increasing global volume of ocean basins due to GIA. That allows different assumptions about GIA around Antarctica to be used, so I’m not interested in correcting Antarctica data for GIA for purposes of SLR. McIntyre showed that these assumptions are huge.
3) What other corrections as essential to the GRACE measurements?
There are also other indications of Antarctica cooling and less ice melting over the last decades. From: “A reassessment of temperature variations and trends from global reanalyses and monthly surface climatological datasets.” 2016.
Authors: A. J. Simmons, P. Berrisford, D. P. Dee, H. Hersbach, S. Hirahara, J.-N. Thépaut.
“Direct observational data on surface air temperature are sparse for the Antarctic, but none of the datasets examined provides evidence of net warming south of 60°S since 1979, a period during which sea-ice extent increased a little.” And that is a bigger area than the continent. Reminds me of the cold katabatic winds coming from the high regions of Antarctica and blowing north to 60S latitude.
Will the ice cap of Greenland melt with more CO2 in the air, or will it get thicker? There are many similarities with Antarctica, like radiative cooling and katabatic winds. A great sea level rise uncertainty.
“The near-surface temperature over the ice sheet is affected by surface elevation, latitude, longitude, large-scale and small-scale advection, occurrence of summer melt and mesoscale topographical features. The atmospheric boundary layer is characterised by a strong temperature inversion, due to continuous longwave cooling of the surface. In combination with a gently sloping surface the radiative loss maintains a persistent katabatic wind. This radiative heat loss is mainly balanced by turbulent sensible heat transport towards the surface. In summer, the surface is near radiative balance, resulting in lower wind speeds. Absorption of shortwave radiation and a positive subsurface heat flux due to refreezing melt water are heat sources for surface sublimation and melt. The strongest temperature deficits (>13 ◦C) are found on the northeastern slopes, where the strongest katabatic winds (>9 m s−1 ) and lowest relative humidity (<65%) occur. Due to strong large scale winds, clear sky (cloud cover <0.5) and a concave surface, a continuous supply of cold dry air is generated, which enhances the katabatic forcing and suppresses subsidence of potentially warmer free atmosphere air."
"The annual mean net radiation is, on average, negative everywhere on the ice sheet, implying that on an annual basis the heat loss by LW net is larger than the absorption of shortwave radiation. This heat loss decreases sharply to zero close to the ice sheet margin, where the relatively smaller heat loss due to LW is compensated by the increased SW absorption due to the low albedo"
A 51-year simulation (1958–2008) of the climate of the GrIS and its immediate surroundings.
From: Climate of the Greenland ice sheet using a high-resolution climatemodel – Part 2: Near-surface climate and energy balance. 2010.
J. Ettema1,2, M. R. van den Broeke1 , E. van Meijgaard3 , and W. J. van de Berg
This can tell us something, despite the bias of models.
NK quoted: “The annual mean net radiation is, on average, negative everywhere on the ice sheet, implying that on an annual basis the heat loss by LW net is larger than the absorption of shortwave radiation.”
NK, everywhere poleward of 40N and 40S the net flux at the TOA is negative. This happens because heat is transported poleward by both ocean and air currents. This makes low latitudes cooler and the high latitudes warmer than they would be based on incoming SWR.
However, your paper is concerned with the surface energy balance. How is that balance over the GIS different from the rest of the planet? The net LWR flux in the KT diagram is 390 W/m2 up and 333 W/m2 down. On the GIS, the situation is similar -40 to -60 W/m2 (Section 3.5.1). Nothing unusual there. Obviously, the incoming SWR is dramatically lower (20-25 W/m2 annual average, Section 3.5.1) due to the high aldedo. (vs 168 W/m2 in KT.) This is compensated for by the absence of any latent heat flux from the surface (Figure 14a) and condensation onto the surface in winter (Figure 14b). (80 W/m2 LH in KT.) Which leaves sensible heat flux, something I find somewhat confusing. In Figure 13b, a lot of sensible heat is transferred to the surface – presumably by descending air masses that are much warmer than the surface. (20 W/m2 loss, not gain in KT.) As discussed above, poleward transfer of heat is a general feature of the planet as a whole and about 1/2 comes by air currents. Sensible heat appears to be the mechanism by which it reaches the surface.
As best I can tell, the mechanism of heat transfer to and from the GIS isn’t as important to SLR as the actual temperature these fluxes produce and the fact that melting seems to be increasing. Furthermore, the direct losses via melting and sublimation aren’t nearly as important the lubrication they may provide, speeding up the rate at which the GIS is flowing into the sea. Unlike central Antarctica, temperature falls with altitude above the GIS and therefore a GHE exists. Amplified GHG mediated warming appears to be a reality in northern polar regions.
It`s a common misunderstanding that the ice cap over Greenland is melting. The interior of Greenland is gaining ice. 5 days of melting in 2012 gets a lot of attention, and is blown up into huge dimensions. The total mass balance has been negative the last decades, as the edges are thinning. I don`t think anybody can predict how it will be in the next decades.
MacGregor, et al. Holocene deceleration of the Greenland Ice Sheet. 2016. Other studies on the thickening of Greenland ice sheet come from Thomas et al, 2000.
And from NASA: 2003 ” In Greenland, the ice margins appear to be thinning and the inland parts of the ice sheet may be thickening. Surface melt water seep into the ice sheets and accelerates their flow. Some of the factors controlling the mass balance of ice sheets, and their present and future influences on sea level, are just beginning to be understood.” Still in the beginning?
And the thinning of the edges of Greenland is really dangerous, as it has already reached a point of no return. The study: “A tipping point in refreezing accelerates mass loss of Greenland’s glaciers and ice caps” 2017. From a presentation of the study: “What’s even scarier is that the researchers identified that this tipping point was reached two decades ago back in 1997 – and no one noticed until now.”
And how dangerous is this melting of the glaciers? “And even though these coastal glaciers have passed the point of no return, the researchers predict it’s unlikely they’ll melt entirely until 2100 – when that happens it’s estimated that it will raise global sea levels by around 3.8 cm (1.5 inches).”
It seems that the tempeature trend for the last 60 years for Greenland is close to zero, when looking at the temperature graphs. An I think that it is meaningless to speak of warming or cooling trend for less than 60 years, as AMOC makes a great difference. Looking at 120 years there may be some warming. Not so strange as LIA cold period had a great influence. And it was also a prolonged period with cooling during late holocene. The ice sheet had grown for 3000 years. A very tiny part of this new ice (3000 years) has been melting the last 100 years.
A summary of the climate of the Greenland ice cap: “The Greenland Ice Sheet The ice cap in Greenland is one of the most arid areas in the world. Along the edge, melting takes place in the summer, but in the central part air temperatures hardly rise above 0°C. The reason for this is partly the altitude, partly the high albedo (reflection of light) of the snow surface, which means that the surface is only to a limited extent warmed by the sun. Temperatures are extremely low in the winter, sometimes below -60°C in the central and northern part of the area. The British research station Northice registered a temperature of -70°C in the 1950s. The cold surface “drains” heat from the lowest layer of air, the result being an almost permanent inversion, which may be very strong in the winter. The inversion layer is the cause of the katabatic winds mentioned earlier. They are strongest and most persistent in winter, while in the summer they are mostly felt at nightand in the early morning hours. Passing cyclones may affect the inversion layer and break down the wind pattern. However, the pattern will quickly be re-established after the passage.” From: DMI Report 17-04 Greenland – DMI Historical Climate Data Collection 1784-2016. John Cappelen (ed)
Click to access DMIRep17-04.pdf
And we know that increasing CO2 is affecting the temperatures in another way over Greenland because high altitudes and inversion, with CO2 cooling for some parts of ice sheet and for some parts of the year. But science cannot yet say how much. So if it will be some substantial sea level rise from Greenland melting, it will take some time.
We are now approaching the great tipping point of Greenland, according to climate “scientists”. It was seen in their crysetal balls (models) in 2010. As The Guardian could tell us, under the headline “Greenland ice sheet faces ‘tipping point in 10 years’ ”
“The entire ice mass of Greenland will disappear from the world map if temperatures rise by as little as 2C, with severe consequences for the rest of the world, a panel of scientists told Congress today.
Greenland shed its largest chunk of ice in nearly half a century last week, and faces an even grimmer future, according to Richard Alley, a geosciences professor at Pennsylvania State University
“Sometime in the next decade we may pass that tipping point which would put us warmer than temperatures that Greenland can survive,” Alley told a briefing in Congress, adding that a rise in the range of 2C to 7C would mean the obliteration of Greenland’s ice sheet.
The fall-out would be felt thousands of miles away from the Arctic, unleashing a global sea level rise of 23ft (7 metres), Alley warned. Low-lying cities such as New Orleans would vanish.
“What is going on in the Arctic now is the biggest and fastest thing that nature has ever done,” he said.”
And they could illustrate it with the most dramatic climate event in 50 years. “An enormous chunk of ice, roughly 97 square miles in size, has broken off the Petermann Glacier along the northwest coast of Greenland.”
So, what about a little report from our Jjourney to Doom: ” Summit Station in Greenland may have experienced the coldest July temperature ever recorded in the Northern Hemisphere at -33°C (-27.4°F). Much of Greenland has been colder-than-normal for the year so far and has had record or near record levels of accumulated snow and ice since the fall of last year. The first week of this month was especially brutal in Greenland resulting in the record low July temperature and it also contributed to an uptick in snow and ice extent – despite the fact that it is now well into their summer season.”
Frank,
Warm air masses do not sink onto colder surfaces. They can’t. The warm air is less dense than the air below it. That’s called a temperature inversion. Whenever the sun is below the horizon near the poles, the air is calm and the sky is clear, you get a temperature inversion. Only if there is sufficient wind do you get enough mixing to transfer sensible heat. When there isn’t sufficient wind, the surface cools until the radiative heat transfer balances.
For sea ice, the lower surface temperature limit is controlled by the rate of heat transfer from the sea water through the ice. That’s about -30 degrees at 2m ice thickness. At that point, the ice doesn’t get any thicker just from freezing.
DeWitt: Thank you for your reply. If you check out the paper, I believe you will find the author’s claiming that Greenland receives a lot of sensible heat in winter. Somehow. And given the radiative imbalances and negligible latent heat loss, I think there must be sensible heat flowing into Greenland.
For Greenland and Antarctica, can air descending onto the high plateau warm the surface (cooling itself) and continue descending toward the ocean? Katabatic winds?
Frank,
You’re not going to have a temperature inversion with katabatic winds flowing. That means there will only be sensible heat transfer from the air to the ground if the potential temperature increases with altitude. That means the lapse rate must be less than the adiabatic rate. That may be true over the Antarctic Plateau. I don’t know.
Some questions:
First quote from Holger Schmithüsen “The intensity maximum in the CO2 band above Antarctica has been observed in satellite spectra but its implication for the climate has not been discussed so far.” One conclusion is that one of the most important mechanisms behind long term sea level change doesn`t get any attention. What do this silence about radiative cooling tell us? Why is basic physics ignored in this way? An what about radiative cooling over Greenland, when models get it so wrong? More omission than uncertainty?
SOD wrote: If we imagine sea level as the level in a large bathtub it is relatively simple conceptually. As the ocean warms the level rises for two reasons: warmer water expands (increasing the volume of existing mass); ice melts (adding mass)
To this, the consensus adds a GIA or glacial isostatic adjustment. According to CU SLR Group website: http://sealevel.colorado.edu/content/what-glacial-isostatic-adjustment-gia-and-why-do-you-correct-it
“The correction for glacial isostatic adjustment (GIA) accounts for the fact that the ocean basins are getting slightly larger since the end of the last glacial cycle. GIA is not caused by current glacier melt, but by the rebound of the Earth from the several kilometer thick ice sheets that covered much of North America and Europe around 20,000 years ago. Mantle material is still moving from under the oceans into previously glaciated regions on land. The effect is that currently some land surfaces are rising and some ocean bottoms are falling relative to the center of the Earth (the center of the reference frame of the satellite altimeter). Averaged over the global ocean surface, the mean rate of sea level change due to GIA is independently estimated from models at -0.3 mm/yr (Peltier, 2001, 2002, 2009; Peltier & Luthcke, 2009). The magnitude of this correction is small (smaller than the ±0.4 mm/yr uncertainty of the estimated GMSL rate), but the GIA uncertainty is at least 50 percent. However, since the ocean basins are getting larger due to GIA, this will reduce by a very small amount the relative sea level rise that is seen along the coasts.”
I always thought that GIA compensated for the subsidence of ocean basins that provides the material needed to produce glacial isostatic rebound on land. However, the Peltier references appear be discussing a different phenomena: mass moving from ice caps near the Earth’s axis of rotation and moving the center of mass further from the axis of rotation. This influence the Earth’s rate of rotation (conservation of angular momentum) and the bulge at the equator produced by centrifugal (pseudo) force. This model may also account for subsistence and rebound at the same time; the terminology is hard to understand.
The issue is important, because changes in ice cap mass (as measured by GRACE) or volume (as measured by height) of the ice caps is complicated by assumptions about glacial rebound under the ice. The study linked below (Cazenave 2009) uses a large “GIA” correction to GRACE mass data (1-2 mm/yr), but it isn’t clear whether this correction compensates for rebound of denser rock under the melting ice. IF not, this would over-estimate the amount of melting.
Click to access Cazenave_et_al_GPC_2009.pdf
The amount of rebound under melting ice caps can be a very large correction factor when calculating melting from height change. The more rebound you assume, the more water entering the ocean. However, the more rebound you assume, the more the sea floor must be subsiding somewhere else in the world. However, the consensus has already agreed that the “global GIA” correction is -0.3 mm/yr, a choice that shouldn’t be independent of assumptions about rebound below ice caps.
Frank,
If the ocean floor is sinking then land is rising. I believe the -0.3mm/year only refers to sea level referenced to the geoid or the center of mass of the earth, I’m not sure which. Since the oceans cover ~70% of the Earth’s surface, then the land surface must be rising 7/3 as fast on average or +0.7mm/year. Land that was under an ice cap at the LGM would be rising faster.
As you say, the GRACE estimate of Antarctic ice mass is highly dependent on the magnitude of the isostatic adjustment rate for Antarctica, not an average global rate. IMO, the isostatic adjustment for Antarctica would be lower than the global land average, since the ice cap is still in place.
Dewitt: However, if you click on any of the links to GIA at CU, GIA is not being calculated simply to correct for the subsidence of the ocean floor. It is far more complicated than that.
Suppose one volume of rebounding land under Antarctica causes an equal volume of ice to slide into the ocean. SLR will not have risen because the ocean has increased by the same volume. The same will be true for two or ten volumes. However, different assumptions about volume require a different GIA correction.
Nobodysknowledge: So, what about a little report from our Jjourney to Doom: ” Summit Station in Greenland may have experienced the coldest July temperature ever recorded in the Northern Hemisphere at -33°C (-27.4°F). Much of Greenland has been colder-than-normal for the year so far and has had record or near record levels of accumulated snow and ice since the fall of last year. The first week of this month was especially brutal in Greenland resulting in the record low July temperature and it also contributed to an uptick in snow and ice extent – despite the fact that it is now well into their summer season.”
When you are discussing the last month or last year in Greenland or anywhere else, you are talking about weather, not climate. This is pointless.
You also cited the Guardian: “Greenland ice sheet faces ‘tipping point in 10 years’ “The entire ice mass of Greenland will disappear from the world map if temperatures rise by as little as 2C, with severe consequences for the rest of the world, a panel of scientists told Congress today.”
Yes, almost anything can happen, but how fast? The change between glacial and interglacial conditions involves about 120 m of SLR and 5 K. Assuming linearity, 24 m/K. However, as ice caps retreated poleward, the area of ice covered land that contributes to SLR shrinks, so this is a worst-case scenario. Every time I look at a polar projection of NH during glacials and interglacials, the GIS appears to be a relic of the last Ice Age. The lapse rate is part of the answer. Since the top of the GIS is 2? km above sea level, it is 13 K colder there than at sea level. If half melts, it will be only 6.5 K colder, creating something of a tipping point.
However, the GIS is also a relic of the Holocene Climate Optimum, a multi-millennial period when the Arctic much warmer in summer than today. The GIS survived and so did those cute white predators that decimate the local seal population every spring. I’d be interested in knowing how all of these alarmist scenarios are compatible with what is known about melting of the GIS during the HCO. I suspect the answer is that alarmist are talking about what will happen in the distant future, not the 21st century.
Frank wrote: ” I suspect the answer is that alarmist are talking about what will happen in the distant future, not the 21st century.”
I think the recent insane New York Magazine article and the reaction to it by the activists and much of the press tells us that the alarmists are not talking about what will happen, either in the 21st century or the distant future. They are talking about what they think will scare people into doing what the activists want. Reality is irrelevant.
Mike: I agree with what you write about alarmists, but not the distant future. Look at the ice cover during the LGM vs today using a polar projection. The GIS is just about the only ice sheet left in the Northern Hemisphere, and its southern end reaches 60 degN. Why is it still here? Some combination of cold (which should have a strong latitudinal dependence) and high snowfall. However, that cold is also due to its high elevation, which will drop once a significant amount of melting occurs. Ocean sediment cores off Greenland show that southern Greenland was forested during the Eemian interglacial, consistent with higher sea level then.
Click to access vinther_etal_nature09.pdf
As Ihave pointed to earlier in this thread: “It seems that the tempeature trend for the last 60 years for Greenland is close to zero, when looking at the temperature graphs.” But I could not resist the temptation to report this temperature record.
And I can second this: ” I’d be interested in knowing how all of these alarmist scenarios are compatible with what is known about melting of the GIS during the HCO. I suspect the answer is that alarmist are talking about what will happen in the distant future, not the 21st century.” Perhaps at least some thousand years.