In the last article – Opinions and Perspectives – 4 – Climate Models and Contrarian Myths – we looked at a few ideas that are common in many blogs but have no basis in reality.
The title of this article “Consensus Myths” doesn’t refer to what you will find if you read a broad range of papers in climate science. It refers to popular myths put forward by those defending climate models. The reality is more complicated.
While the contrarian myths are just plain ignorance of science, the consensus myths are closer to the truth, and more subtly misleading.
1. Here is a typical example:
While there are uncertainties with climate models, they successfully reproduce the past and have made predictions that have been subsequently confirmed by observations.
2. And a followup from the same site:
A common argument heard is “scientists can’t even predict the weather next week – how can they predict the climate years from now”. This betrays a misunderstanding of the difference between weather, which is chaotic and unpredictable, and climate which is weather averaged out over time. While you can’t predict with certainty whether a coin will land heads or tails, you can predict the statistical results of a large number of coin tosses. In weather terms, you can’t predict the exact route a storm will take but the average temperature and precipitation over the whole region is the same regardless of the route.
Reproducing the Past
So let’s look at #1. Here is a graph from that page:
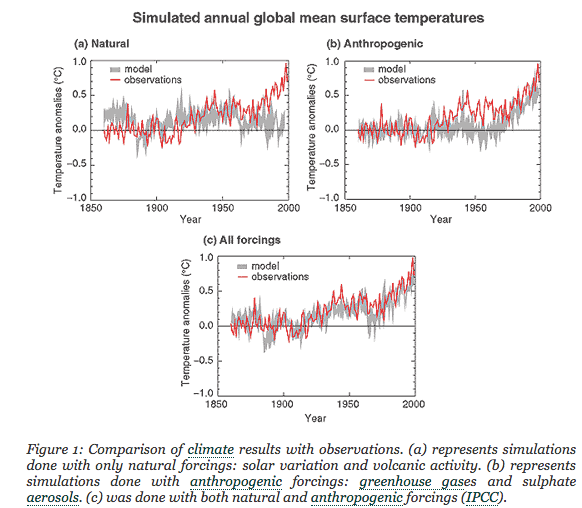
The bottom figure is the key. We can see the model and the observations match up on temperature anomalies. Clearly the author of that site has a point.
Here is another version of this graph (with also future projections based on various scenarios) – the gray lines are the model results:

From Mauritsen et al 2012
Figure 1
Now we are looking at actual temperatures (rather than anomalies) reproduced by climate models. Climate models – reproducing the past – are running between 12.5ºC and 15.5ºC. A range of 3ºC. Why should we trust a model that runs 2ºC cold or a model that runs 1ºC hot? Should we? Shouldn’t we? Is this successfully reproducing the past?
Here’s another example. I happen to live in Australia, not the country of my birth which is England, but it’s definitely the lucky country. Take a look at Australia (it’s bottom right for people confused by geography!). This graph shows rainfall simulated by different models over 25 years (1979-2005) compared with observations.
It’s nothing sophisticated like how accurate are models on seasonal rainfall, or decadal variation. It is simply the total rainfall over 25 years. The color indicates the ratio of model results to observations:
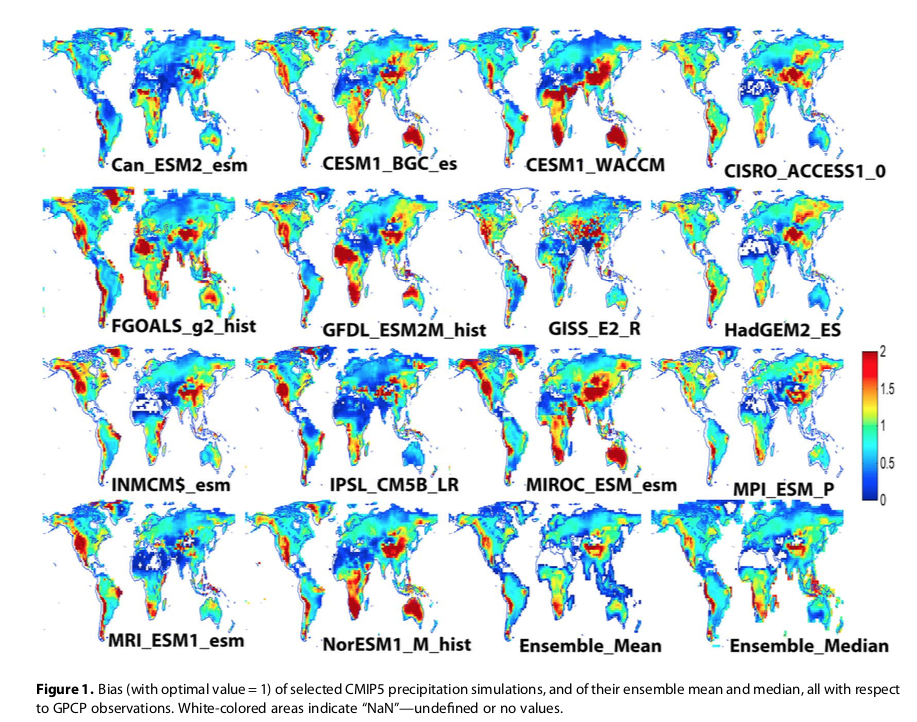
From Mehran et al 2014 – click to enlarge
Figure 2
I did try to access the complete datasets for myself but ran into problems. It’s possible that the scale 0-2 has just maxed on 2. I don’t know. Best case, some models have Australian rainfall at double the actual, some models have rainfall at 50% or less. Is this success?
At best we can say that models do some things well and some things badly. Just highlighting success in modeling past temperature anomalies is not the end of the story.
Some confident souls might suggest that if they get past temperature anomalies right, then they will get future temperature anomalies right. For consideration in due course..
Weather and Climate and Chaos
Now let’s look at item #2.
Climate models don’t attempt to tell us the weather on a given day. They do attempt to tell us the average of weather over a period. On this, the website cited is correct.
There is a large fly in the ointment unfortunately. It’s true that if you flip lots of coins you can predict the statistical outcome. Non-linear chaotic systems are a little different.
There is an extremely simple chaotic system, described by the famous Edward Lorenz. He simplified a convection model with fluid being heated from the bottom into a system of 3 variables and looked at the results.
The simple idea is that when you have a “deity-like view” (which means over a long enough time period) you can be confident that you know the statistics – the mean, the standard deviation and so on. But when you don’t have this deity-like view you can’t have any confidence in the statistics. You might watch the system over a “really long time” and calculate the statistics, but over twice that time, and 10x that time, the statistics may change. You don’t know how long you need to watch it for. More on this in the series Natural Variability and Chaos, especially Natural Variability and Chaos – Four – The Thirty Year Myth.
Here is an example of the quasi-periodic fluctuations – note that the graphs are showing the running average over a time period for each of the three variables (graphs 1,2,3), for three very slightly different starting conditions (red, blue, green):
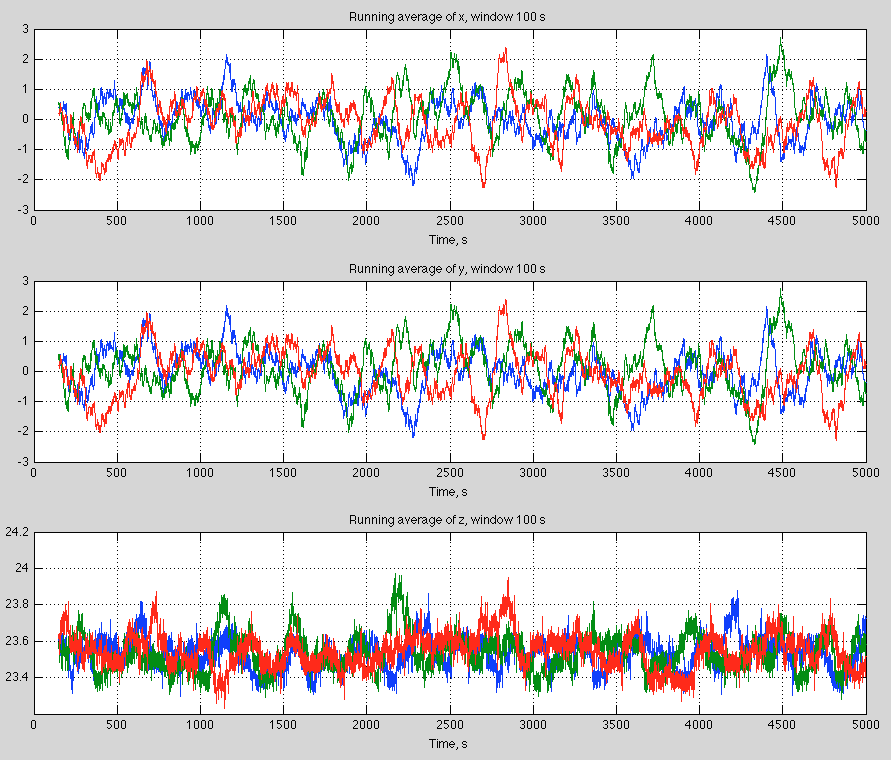
Figure 3 – Click to expand
The climate system is massively more complicated than the Lorenz 3-equation problem. No one has any idea how concepts from the “simple” Lorenz problem map to the complex problem. And the “simple” Lorenz problem is a gift that keeps on giving.
Conclusion
The storytime edition of why we can trust climate models isn’t one you find very much in climate science papers. Instead the question is what we can learn from climate models. Relationship status with climate models – it’s complicated.
Articles in this Series
Opinions and Perspectives – 1 – The Consensus
Opinions and Perspectives – 2 – There is More than One Proposition in Climate Science
Opinions and Perspectives – 3 – How much CO2 will there be? And Activists in Disguise
Opinions and Perspectives – 3.5 – Follow up to “How much CO2 will there be?”
Opinions and Perspectives – 4 – Climate Models and Contrarian Myths
References
Tuning the climate of a global model, by Mauritsen et al (2012)
Evaluation of CMIP5 continental precipitation simulations relative to satellite-based gauge-adjusted observations, A. Mehran et al, JGR (2014)


A method for comparing climate models with observational data
https://tambonthongchai.com/2018/09/08/climate-change-theory-vs-data/
Per this Real Climate blog on climate and chaos the simple Lorenz system isn’t applicable to climate because fluid flow is always reacting to changes in forcing. Per the blog adding a parameter to the Lorenz system which simulates “forcing” has a very linear and predictable effect.
The blog also notes that:
“all climate models do predict that the change in globally-averaged steady state temperature, at least, is almost exactly proportional to the change in net radiative forcing, indicating a near-linear response of the climate, at least on the broadest scales.”
http://www.realclimate.org/index.php/archives/2005/11/chaos-and-climate/
This illustrates Chubbs how simple systems can be misleading. I know for a fact that changing a parameter in a turbulence model often has a very nonlinear effect on the result.
The second point about linear responses is not important. The models effective forcings can be strong functions of parametrized processes that cannot be constrained with data very well. The linear response rate is almost certainly due to cancellation of errors.
I read the reference Chubbs and its not that bad actually. It doesn’t however for me really increase my confidence in climate models. Nothing in there contradicts the negative results that continue to accumulate both in climate modeling and in CFD generally.
dpy –
I don’t see negative results accumulating at all. If anything climate model forward projections are being validated at an increasing rate. After all, its is only since 2015 that the need to make an apple-to-apple comparison of climate models and observations became known. Many facets of the observed response to GHG, besides temperature, have also been flagged by climate models. This year the ability to forecast EBM results was added to the list.
As I pointed out previously, ECS is not the main result from climate models. Understanding the role and interaction between the different climate components and assessing the impact of chaos and natural variability are much more important results. We don’t have two earth’s but we can: 1) run an ensemble of climate model trajectories to check on the role of chaos, 2) evaluate the linearity of the climate response to forcing changes, 3) model past climates to understand better understand paleo info, 4) evaluate cloud physics poarameters etc. etc. etc.
Chubbs,
1. Using models to “understand” physics is for me usually not real science if the quantification is poor. You saw SOD’s charts of precipitation. That shows an important lack of skill.
2. Global mean temperature is easy to get reasonably right through tuning. Frank originally pointed out that aerosol models are a giant knob that can be used to make a model with a high TCR agree with GMST.
3. Given the crude nature of cloud, precipitation, and convection models used in practice, there is little reason to believe these models can offer us much in the way of understanding.
Chubbs wrote: “Per this Real Climate blog on climate and chaos the simple Lorenz system isn’t applicable to climate because fluid flow is always reacting to changes in forcing.”
El Ninos are the result of chaotic changes in fluid flow. They can warm the planet at rates of 0.5 K/year. Radiative forcing is warming at about 0.02 K/year. Over short time scales, chaos dominates forcing.
And it is know well known that the climate sensitivity of AOGCMs often increases with time. You 2005 post may be out of date.
SoD example 1:
“While there are uncertainties with climate models, they successfully reproduce the past and have made predictions that have been subsequently confirmed by observations.”
I have worked with enough models to know that you make a model fit the past for the wrong reasons and when this happens the model will not correctly predict the future. So I consider this argument invalid.
SoD example 2:
“A common argument heard is “scientists can’t even predict the weather next week – how can they predict the climate years from now”. This betrays a misunderstanding of the difference between weather, which is chaotic and unpredictable, and climate which is weather averaged out over time. While you can’t predict with certainty whether a coin will land heads or tails, you can predict the statistical results of a large number of coin tosses. In weather terms, you can’t predict the exact route a storm will take but the average temperature and precipitation over the whole region is the same regardless of the route.”
Weather/climate model predictions for a year from now are typically for monthly or quarterly average conditions, not for specific storm tracks or other weather events. And yet there is very little if any skill found in these predictions. Why would we expect annual predictions/projections to be any better?
My first attempt to comment seemed to disappear. I’ll try again.
I see all the time chaotic simulations in which the long term statistics are not really predictable. Google subcritical transition to turbulence. There are often multiple solution branches, bifurcations, and high dimensional attractors. A bifurcation can be between two (or a large number) of quite close states too. They are not always large changes. There is good evidence that these are problems in climate simulations as Robert Ellison has done a good job of harvesting some of the literature.
It seems to me based on my experience that whether climate is predictable is still an open question. The outlook for computing it is not very hopeful. The best we can do is give a rather broad range of possible outcomes.
However, you are right to point out the misinformation on Skeptical Science and elsewhere (some even perpetrated by climate scientists) on the subject.
Climate is not a “boundary value problem” in any meaningful sense. It is also not strictly speaking an initial value problem. Its more complex than that.
One think i have learned from this series, SOD, for which I thank you is from Frank about forcing estimates and how critical they are to computing TCR from the historical record. He also pointed out that models an always get the historical temperature right by simply tuning the aerosol model for example. In that sense its a knob, just as Linden said a long time ago.
It may be his opinion, but it doesn’t seem to be what happens in practice.
https://journals.ametsoc.org/doi/10.1175/BAMS-D-15-00135.1
verytallguy,
There are different ideas within the climate science community.
Here is Cloud tuning in a coupled climate model: Impact on 20th century warming, Jean-Christophe Golaz, Larry W. Horowitz, and Hiram Levy II, GRL (2013):
The Kiehl reference is Twentieth century climate model response and climate sensitivity, Jeffrey T. Kiehl, GRL 2007.
I think it was Nic Lewis who highlighted that CMIP5 models didn’t have this same inverse relationship but I haven’t checked his comment.
It does seem that up to IPCC AR4, at the very least (i.e. CMIP3 models) that the models with high sensitivity used high negative forcing (high aerosols) and models with low sensitivity used low negative forcing (low aerosols). Extract from Kiehl 2007:
An interview with Bjorn Stevens, director of the Max Planck Institute – check out around 36:30. (The whole interview is very interesting).
Thanks SoD.
I think the Stevens interview is very consistent with the Hourdin paper?
To my understanding:
– Model tuning is rarely (if ever) explicitly to historical temperature record.
– however, implicit tuning is hard to avoid in practice.
– greater explicit description and documentation of tuning strategies would be valuable.
Perhaps this is wrong, or you take different conclusions?
I am certainly no expert in this.
vtg and SOD, Modelers do however explicitly tune the models for top of atmosphere radiation balance. Models generally however seem to have an ocean heat uptake that is too high according to Frank. That’s another way to make a model with a high TCR match the historical temperature integral better. Cloud models can likewise be used to alter the “effective” forcing values to better match temperature.
The problem here is that tuning is usually undocumented. We do know however that wide ranges of TCR and ECS are possible with plausible values of sub grid model parameters.
Turbulence models display structural instability (as is well known). You can change the parameters and produce structurally totally different answers. There is evidence of the same thing for climate models. Modern turbulence models use global PDE’s to find the eddy viscosity. Earlier local algebraic models were quite deficient. Climate models sub grid models are mostly algebraic as I understand it.
The more you understand about climate models, the more it becomes obvious that they have little change of getting much right that is not implicitly tuned for.
dpy,
A little more precision in your citations would be helpful!
Curry has a new post reviewing recent papers on ocean heat uptake that reviews some of the recent papers. As usual in climate science there are a rather broad range of results.
SoD,
your characterisation of Skeptical Science presentation of models, is, I think, misrepresentative and incomplete.
You’ve picked up one post, which focuses on global temperature. It’s perfectly possible that models can represent this bulk parameter to reasonable accuracy yet get regional rainfall substantially wrong.
A brief search of the site shows that they highlight limitations on rainfall elsewhere, eg
https://www.skepticalscience.com/scientists-discuss-improve-climate-models.html
verytallguy,
Misrepresentative?
Their page is titled “How reliable are climate models?”
I highlighted their major claims to answer this question. I think “Representative” is more accurate, but we can agree to differ.
Given the length of the post it seems reasonable to me on the claims they make. More detailed aspects are covered elsewhere on the site – far from hiding precipitation they explicitly call it out as a gap. I hasten to add I only did a very brief search, i haven’t remotely attempted a full critique of them.
With regard to skepticism of the climate science literature. That’s amply justified by the Replandy case. On the pause, there are many contradictory papers not all of which can be right. You would be well served I think by reading up a little on the causes of the replication crisis and the misuses of statistics that are a root cause.
https://royalsocietypublishing.org/doi/full/10.1098/rsos.160384
https://www.nature.com/news/registered-clinical-trials-make-positive-findings-vanish-1.18181
https://www.significancemagazine.com/2-uncategorised/593-cargo-cult-statistics-and-scientific-crisis
I also have a lot of first hand experience with the modeling culture in which you publish only the good results while attributing all previous and less convincing results to “bad gridding” or “suboptimal parameter choices.” The recent paper on climate model tuning calls for more transparency in this regard. That would be very helpful to any accurate assessment of model value and skill.
Well, The Skeptical Science post SOD highlighted on models is very superficial and doesn’t highlight any of the recent negative results that cast doubt on the skill of climate models. It’s really a one sided superficial attempt to cast doubt on skeptical misinformation by using more misinformation.
The post VTG highlights is better because its really just extended quotes from climate scientists.
However, neither article really discusses most of the negative results about tuning, etc. that are continuing to appear. Neither article shows any knowledge of new results in related fields or show any knowledge of the underlying mathematics of these simulations. What SOD has presented here on this blog is vastly better and is actually informative.
There has been some recent work in CFD on the weather and climate model method of discretization of the Navier-Stokes equations by Jameson. Generally the method is not very satisfying.
Well, if you’re going to claim recent results, you should cite them, rather than assert the fact.
Of course it’s superficial, it’s concisely trying to get across the key points from the literature.
It’s definitely not misinformation. It does not claim absolute accuracy from models and makes it clear there are uncertainties.
You just don’t agree with it – but as you don’t agree with much in published literature, so that’s not exactly surprising. Disagreeing with you is not synonymous with misinformation.
What it does present is accurate and in line with the literature.
Anyway, I’ve put a post on the thread over there to invite comments here.
VTG, Sod explained this in detail in the post. You say essentially nothing about his main points.
1. SkS uses the temperature anomaly as something models get right. Well, if they are tuned (perhaps unconsciously for that), that means very little.
2. In terms of absolute temperature, the story is not nearly as good.
3. Regional climate metrics like precipitation SOD showed to be really badly wrong in models.
4. TLT is not a good match for observations (numerous datasets).
5. Cloudiness as a function of latitude is poorly reproduced. This is important for overall energy balance.
6. Effective forcings in models cover a broad range, including aerosol forcings.
7. What these deficiencies show is that GMST agreement is due to cancellation of errors. This is shown by Zhou et al where it is shown that plausible parameters in the precipitation and cloud model can be used to engineer ECS over a pretty broad range.
But the fundamental problem with the SkS post is the heavy selection bias. They mention only a few measures of skill which models seem to do OK with. They pass over in silence the other important ones where skill is lacking. Is that bias accidental or the result of novices and non-scientists setting out to make a point they don’t know much about.
The coin toss analogy is deeply misleading. Its a classical case of normally distributed statistics. There is no support offered that climate model outputs are in this class of datasets. That’s because there is none. Chaotic systems exhibit structural instability and often chaotic behavior in the statistics over long time periods in some cases.
I think Frank’s comments are on an earlier post in this sequence. You could ask him the source for his data.
dpy, my ask is very simple. If you make a claim, provide the reference.
It’s quite impossible to have a sensible discussion with an argument of “Frank said so”.
Please read the Hourdin paper on tuning.
I have read the paper on tuning at least in part. It is a plea to come clean and document the tuning process. That would be quite helpful.
You can start here VTG at point 17. It’s somewhat old by now but references are provided.
Click to access briefing-note-on-climate-sensitivity-etc_nic-lewis_mar2016.pdf
I guess when the discussion gets technical, the non-technical commenters get going (i.e., abandon the field).
“I guess when the discussion gets technical, the non-technical commenters get going (i.e., abandon the field).”
That’s a pretty surreal comment dpy. It doesn’t obviously have technical content, for starters!
Please include citations for your claims and we’ll get along just fine.
Thank you.
“You can start here VTG at point 17. It’s somewhat old by now but references are provided.”
I’m not sure what specific point you are trying to make here dpy.
It’s well understood that there are uncertainties in model predictions – as highlighted by the SkS page itself.
Nic Lewis has a particular perspective on this, and his document is not peer-reviewed.
There are other perspectives which provide quite different conclusions. The least certain aspect of sensitivity is generally agreed to be cloud feedback. A recent review concludes:
(my bold)
https://www.nature.com/articles/nclimate3402
It would be wise to look beyond a single individual’s perspective.
VTG, This all started with discussion of the SKS model post and why it was misleading. I gave you the Lewis reference because it has in one place a lot of references with negative results on GCM’s on clouds, convection, and microphysics. You just asserted that clouds were now better understood which offers no quantification of their effect and offers no insight into GCM skill. Lewis showed that cloud fraction as a function of latitude is poorly simulated by models. They are all over the place. But yet that’s quite important to getting overall cloud feedback right.
SOD showed here an except from Golaz et al about cloud microphysics parameters and their strong influence on historical GMST. In another paper Zhou et al also show that ECS can be engineered over a broad range using these parameters. ECS in climate models is an accident of tuning because the energy flows in the system needed to get it correct are know to be wrong in detail and the feedbacks are often wrong too.
But this just confirms what we know from first principles. The truncation errors in climate model runs are so large that any apparent skill must be due to tuning the cancellation or errors to match some output functions.
SOD also showed the dramatic lack of skill in predicting regional climate and gave a reference.
So if you were really interested you could easily review these papers. It’s an old debating tactic to demand references and when they are provided pretend they were not provided. It also helps understanding if you would read SoD’s main posts here and understand them. Quoting stray sentences from the literature does not constitute understanding.
dpy,
you chose to post a link to an un-peer reviewed paper by Nic Lewis with 40ish points (!) on why sensitivity is low. Why you’re now complaining that I addressed that is surely mysterious.
Rather than respond to all 40 points(!) I picked the most important, cloud feedback uncertainty.
I did not *assert* that this is better understood, I referenced a review paper in Nature which concludes that. You really do need to stop confusing citation and assertion.
On models, you are, I’m afraid, stuck with the notion that unless they are perfect, they are completely useless.
A lot of this is just obfuscation by you VTG. The main point is that the SkS post SOD references is indeed a piece of misinformation. It documents in detail a few measures that models do OK on (perhaps because they were tuned for those measures) and omits the huge body of documentation of other measures (many of which impact ECS, TCR, and energy flows) that models do poorly on.
Your misrepresentation of my view on models is a rhetorical ploy. No model is perfect. The problem here is that climate models projections are little better than guesses because ECS, TCR, and even feedbacks can be tuned over a broad range by adjusting parameters within ranges that are consistent with the data. Thus projections are not of much scientific value.
Your talking point about peer review is misinformed. Peer review is a poor system that has failed to prevent the replication crisis. This crisis affects climate science too as the competing pause papers show.
https://www.thelancet.com/journals/lancet/article/PIIS0140-6736(15)60696-1/fulltext
https://royalsocietypublishing.org/doi/full/10.1098/rsos.160384
https://www.nature.com/news/registered-clinical-trials-make-positive-findings-vanish-1.18181
https://www.significancemagazine.com/2-uncategorised/593-cargo-cult-statistics-and-scientific-crisis
The third one is particularly telling with regard to model results. This mechanism almost certainly is at play in model evaluation papers and leads to the literature being biased in the positive direction.
dpy,
I said you thought models were useless. You say they are “little better than guesses”
I don’t think that’s a misrepresentation.
Modern eddy viscosity turbulence models are not perfect but they are very useful for predictions outside the data used for tuning. Weather models are also not perfect but are quite useful for predicting the weather on time scales of several days. Climate models are in a different category.
VeryTallGuy: My numbers for Effective Radiative Forcing (ERF) came from the Supplemental Material for Otto (2013) top link, with the journal article and
Click to access ngeo1836-s1-corrected.pdf
https://www.nature.com/articles/ngeo1836
Click to access ngeo1836%281%29_with_coversheet.pdf
This paper covered the forcing and temperature change between the 1970s, 1980s, 1990s and 2000s (between average state for each decade). It derived estimates for ECS and TCR. Since 16/17 authors co-authored section of AR5 relevant to ECS and TCR, this data might be considered to be the consensus for this period.
There was also discussion of the last 40 years. My data came from eyeballing the data Figure 2 of Lewis and Curry (2018). During the last 15 years, aerosols have declined, and correcting aerosol forcing isn’t as important.
Click to access LewisCurry_The-impact-of-recent-forcing-and-ocean-heat-uptake-data-on-estimates-of-climate-sensitivity_JCli2018.pdf
Click to access Lewis_and_Curry_SI_JCLI-D-17-0667a.pdf
Click to access LewisCurry_The-impact-of-recent-forcing-and-ocean-heat-uptake-data-on-estimates-of-climate-sensitivity_JCli2018.pdf
Frank,
dpy’s original point was
“Models generally however seem to have an ocean heat uptake that is too high according to Frank. ”
Is that what you’re claiming – that OHC is consistently high in models?
For estimating TCR I don’t think ocean heat uptake is used. I checked the AR5 values and indeed the obversataonal estimates of ocean heat uptake are all lower than the CMIP5 mean with one for which the 90% confidence intervals don’t overlap.
Cheng et al have a new paper using updated data that shows good agreement with the updated datasets with CMIP5. Whether these new results will stand up is uncertain as the errors bars are almost certainly understated.
In any case Lewis and Curry 2018 uses the updated datasets with the higher values of ocean heat uptake so their result is unaffected by these new numbers.
Further, the Cheng et al paper cites the higher uptake numbers as the cause of the Pause. Just another paper contradicting the outlier Lewindowsk, Mann, Ransdorf paper claiming that the pause didn’t exist. Just another example of 2 climate science papers one of which must be wrong.
I doubt that Lewandosky and Cheng have any significant disagreements.
You know JCH that Trenberth has always felt that ocean heat uptake was underestimated so its not surprising that their paper says it’s the cause of the pause. It’s just one sentence in this latest paper but it agrees with lots of other papers on the pause.
In reality Clive Best has a great post where he shows that the pause did really exist but disappeared because of adjustments to the surface data sets and other changes including addition of Arctic stations and removal of Southern Hemisphere stations that were showing lower rates of warming.
So the pause did exist and all those papers trying to explain it were correct about that. Lewindowski et al publish a paper showing the pause never existed using the adjusted datasets and ignore the obvious explanation Best showed. Just another example of bias and misdirection in the climate science literature.
I suspect Lewindowski had no scientific input to the “no pause” paper’s science. I’m sure he and Oeskes contributed the pseudo-science about how all those other climate scientists were victims of confirmation bias. As if Lew and Oreskes aren’t experts on bias being notoriously subject to it themselves. More likely they haven’t changed and are still infested with bias.
You don’t get it. There is nothing wrong with Lewandowsky.
dpy, “Cheng et al have a new paper…”
Please can you provide proper citations. Ideally with a link but as a minimum sufficient to enable the work to be identified.
How fast are the oceans warming?
There is another OHC study out as well:
Global reconstruction of historical ocean heat storage and transport
article about the two studies
VeryTallGuy: Rather than debating what dpy6629 said, let me clarify what I do and don’t know about ocean heat uptake.
TCR is simply dT/dF. Some climate models have a TCR much higher than the central estimate expected from observed dT and current understanding of dF. These models must either: 1) hindcast dT that is too big OR 2) the central estimate for observed dT is too small OR 3) the dF produced by the model is too small (perhaps too much negative aerosol forcing) OR 4) the IPCC’s adjusted central estimate for dF is too big. If the central estimate for the pdfs of dT and dF used in EBMs are wrong, there is nothing we can do or learn. Otherwise, those high TCR models are wrong.
That leaves AOGCMs with low TCR (say below 1.8 K), few of which have an ECS within the 5-95% ci in the most refined EBM (L&C 2018): 1.5 K (1.05-2.45 K. Mathematically (from the definitions in EBMs):
TCR/ECS = 1 – dQ/dF
So, if an AOGCM has a reasonably low TCR and an unreasonably high ECS (compared with EBMs), the only way I can see for the model to produce this result is for dQ (ocean heat uptake) to be too big. IIRC, vertical “diffusion” of heat does vary by a factor of two between models.
I reach the same conclusion thinking in terms of the climate feedback parameter (CFP, additional radiation emitted or reflected per degK of warming). If the CFP is -2 W/m2/K (ECS 1.8 K/doubling), current forcing is about 2.7 W/m2, and current warming (dT) is about 1 K; then warming is sending about 2 W/m2 more radiation to space, leaving 0.7 W/m2 to warm the ocean. If the CFP is -1 W/m2/K (ECS 3.6 K), then warming is currently sending an addition 1 W/m2 to space, leaving 1.7 W/m2 to warm the ocean. That disagrees with ARGO.
Unfortunately, there is no compendium of dF, dT and dQ from hindcasting historical warming. AFAIK, the exact model forcing change (dF) for hindcasts isn’t directly available.
To be completely candid, I have tried several times to exchange with Nic about how too much ocean heat uptake can suppress current transient warming in a model. He seemed totally uninterested in the suggestion that the parameters that control vertical heat transport in the ocean have simply have been tuned to produce a high ECS from a low TCR. I doubt he would endorse the suggestion that ocean heat uptake is simply a tunable fudge factor. Both he and some consensus scientists appear to be focused on how local warming can be mostly sent to space via a high local CFP or retained if the local CFP is low. They are focused on the spacial pattern of warming. For example, the Western Pacific Warm Pool has towering thunderstorms with very high cloud tops. Due to high humidity and its effect on lapse rate, a warmer surface may not result in warmer cloud tops there. It is a difficult place for more warmth to escape to space. On the other hand, AOGCMs and other data suggest that the CFP for clear skies (only WV+LR feedback) is slightly more negative than -2 W/m2/K.
Is this true?
As I understand it, it’s a model metric. It’s defined as the temperature increase after 70 years compounded 1% CO2 increases, which leads to a doubling (IPCC TAR).
As such it can’t be directly measured, and any inference of it for the real earth depends on some kind of model. So I think (I’ve not looked into it deeply, so could be wrong) the EBM method, even for TCR, needs to include ocean heat uptake, although the influence of that is less than it would be for ECS as in the real world, forcing is not increasing equivalent to 1% CO2/year.
The concept of TCR is a simple one and I think most of the climate science literature assumes that DT/DF is independent of the pathway used to get to the final forcing. While this may not be strictly true in reality, its probably a reasonable simplification for small changes in F (or more correctly ERF). But its a subject for further research as you never know when nonlinearity or “internal variability” (itself a vague and perhaps impossible to define term) starts to make a difference.
The problem here is that climate science is where aerodynamics was 100 years ago. There are simplifications that are OK like lift is a linear function of angle of attack (except where it isn’t) or in climate science that DT/DF is well defined and constant.
I think this is trivially untrue, otherwise there would be no need to specify a timeframe for the doubling, and ECS and TCR would be the same.
But maybe there is some other point you’re making here?
OK, so I went back to look at the Lewis and Curry paper.
They indeed do NOT take account of deviations from the 1%/year forcing in calculating TCR:
It seems that deviations are not significant enough to make a material difference to the calculation – in principle they may be, but not in practice.
Click to access lewiscurry_ar5-energy-budget-climate-sensitivity_clim-dyn2014_accepted-reformatted-edited.pdf
Of course vtg you missed the point. For small changes in Erf the exact path of the change shouldn’t matter too much and the response will be linear. All simple forcing/ feedback analyses make some assumption like this. Climate models should show this behavior too if they aren’t Fundamental flawed.
On second thought VTG you have a point. There is a difference between very long term response and short term response. Energy balance methods all make the linearity assumption and there is a huge literature on the subject.
In any case on the timeframes used for energy balance methods the increase in forcing is probably not too far from the way TCR is assessed using models. Thus these 2 ways of doing the calculation should be pretty close.
Model TCR I think is defined to be an approximation to how emissions have gone historically or might go in the future.
In any case the point frank makes is correct.
See this comment and link on linearity of response
VTG wrote: “OK, so I went back to look at the Lewis and Curry paper. They indeed do NOT take account of deviations from the 1%/year forcing in calculating TCR”.
CMIP 5 has calculated TCR and ECS for various models from 1%/yr experiments, from historic forcing experiments and from instantaneous 2X and 4X experiments. Comments from Nic indicate that the differences in TCR and ECS produced by these methods are minor and not related to their disagreement with EBMs. I don’t have a reference to prove this.
The relationship between ECS and TCR is doesn’t change with warming rate: The current radiative forcing is about 2.7 W/m2 and the current ocean heat uptake is about 0.7 W/m2, so the difference (2.0 W/m2) must be going to space because of the 1 K of warming we have experienced. So we are about 70% of the way to a new steady state.
Simple calculations show that a 1 W/m2 radiative imbalance is capable of warming the atmosphere plus a 50 m mixed layer of ocean at an initial rate of 0.2 K/yr, IF ALL THE HEAT REMAINS IN THE MIXED LAYER AND ATMOSPHERE. As the planet warms, however, a 1 W/m2 forcing becomes a smaller and smaller radiative imbalance at the TOA as the warmer planet radiates and reflects more heat to space. So warming will slow. Halfway to a new steady state, the imbalance will be 0.5 W/m2 and the warming rate will be 0.1 K/yr. The new steady state temperature depends on climate sensitivity. If ECS is low (1.8 K/doubling, EBM), the new steady state after a 1 W/m2 forcing will be 0.5 degK warmer and the warming rate will be cut in half in about 2 years. If ECS is high (3.6 K/doubling, typical AOGCM), the new steady state from a 1 W/m2 forcing will be 1 K warmer and the warming rate will be cut in half in about 4 years. In either case, the atmosphere and mixed layer can approach steady state within about a decade. So, on a decadal time scale, the atmosphere and mixed layer are nearly in a steady state with respect to a change in forcing. So, as best I can tell, it shouldn’t make too much difference to the mixed layer and atmosphere whether a 3.6 W/m2 forcing from 2XCO2 develops over 70 years, 35 years, or 140 years. A doubling over 7 or 14 years would be a very different story.
Of course, heat does get transported below the mixed layer. One might say the effective heat capacity of the ocean compartment in steady state with surface temperature grows with time. Doubling the depth of the mixed layer in the above calculation in the above calculation wouldn’t make a doubling over 70 years much different from a doubling over 140 years.
If this seems like a lot of hand waving (to some extent it does to me) the solution is to make a multi-compartment model. AOGCMs are multi-compartment models. They apparently get similar TCRs from historic and 1% pa experiments. Maybe the above handwaving provides a feeling for why this happens.
VTG: Technically you are correct that TCR is the temperature change (dT) after doubling CO2 (dF) over 70 years (1% pa) averaged over two decades. As I just discussed, there isn’t much difference if the rate differs from 1% pa. And the proper name for ECS from an EBM is “effective ECS”, because slow feedbacks (changes in surface albedo, ice caps, vegetation, and outgassing of CO2 with warming) may not reach steady state within a 70-year 1% pa experiment. In abrupt 2X and 4X CO2 experiments, dF is plotted against dT and the “line” extrapolated to dF = 0 to obtain ECS and to dT = 0 to obtain the effective radiative forcing. In practice, there is often a bend in the “line” around 20 years.
It is my understanding, that none of these details explain the divergence between AOGCMs and EBMs.
If chaos is important, and close climate trajectories diverge with time, why would a a simple linear model with very limited and uncertain data work? How would you know if it did?
Same reason wing lift is a linear function of angle of attack over 4 or 5 degrees. Problem is finding the slope and the intercept.
BTW Chubbs, this analogy illustrates why matching GMST with models is not very meaningful.
1. This metric is almost certainly unconsciously tuned for so matching it not meaningful in demonstrating model skill.
2. Turbulence models are also tuned for the subcritical lift curve slope. That’s fine but then other metrics must be used to evaluate skill.
In short, metrics other than those used for tuning must be used to evaluate skill.
The future temperature trend isn’t used in tuning, yet models have matched it time after time.
Your airplane wing analogy isn’t necessarily applicable, unless you tell me how you find the slope and the intercept.
Well the slope and intercept are critically dependent the dynamics of the flow field as discussed on the later post (#6). They are determined often in wind tunnel tests or with very well validated CFD.
global average temperature anomaly is almost subconsciously tuned for by modelers. Thus getting it “right” tells us little about the skill of the model. Much more important are things like energy flows in the system.
Unfortunately we don’t have a wind tunnel to make repeat climate measurements under well controlled conditions so your analogy is not a very good one.
Chubbs, you missed the point. The details of the dynamics are critical to getting the slope and intercept right just as with climate models. If dynamics are wrong, any skill is due to cancellation of errors.
There’s an implication here that climate models are valid ‘science’. If so, where are the specifications for these models? What axioms, assumptions, and equations lie behind them? Where are these models defined?
Where is the discussion in scientific journals where criticisms are made and answered? In particular, where are the detailed replies and refutations of issues raised by Dr Roy Clark and Dr David Evans?
Dr Roy Clark’s: https://greenfallacies.blogspot.com/2019/01/book-review-dynamic-greenhouse-effect.html
Dr David Evans: http://sciencespeak.com/climate-basic.html
All I see are modellers making a career out of it who are intellectually incapable of even reading criticism from another scientist. Looks more like pseudoscience than science.
[…] « Opinions and Perspectives – 5 – Climate Models and Consensus Myths […]
[…] Opinions and Perspectives – 5 – Climate Models and Consensus Myths […]
[…] Opinions and Perspectives – 5 – Climate Models and Consensus Myths […]
[…] Opinions and Perspectives – 5 – Climate Models and Consensus Myths […]
Reblogged this on Climate- Science.