The IPCC 5th Assessment Report (AR5) from 2013 shows the range of results that climate models produce for global warming. These are under a set of conditions which for simplicity is doubling CO2 in the atmosphere from pre-industrial levels. The 2xCO2 result. Also known as ECS or equilibrium climate sensitivity.
The range is about 2-4ºC. That is, different models produce different results.
Other lines of research have tried to assess the past from observations. Over the last 200 years we have some knowledge of changes in CO2 and other “greenhouse” gases, along with changes in aerosols (these usually cool the climate). We also have some knowledge of how the surface temperature has changed and how the oceans have warmed. From this data we can calculate ECS.
This comes out at around 1.5-2ºC.
Some people think there is a conflict, others think that it’s just the low end of the model results. But either way, the result of observations sounds much better than the result of models.
The reason for preferring observations over models seems obvious – even though there is some uncertainty, the results are based on what actually happened rather than models with real physics but also fudge factors.
The reason for preferring models over observations is less obvious but no less convincing – the climate is non-linear and the current state of the climate affects future warming. The climate in 1800 and 1900 was different from today.
“Pattern effects”, as they have come to be known, probably matter a lot.
And that leads me to a question or point or idea that has bothered me ever since I first started studying climate.
Surely the patterns of warming and cooling, the patterns of rainfall, of storms matter hugely for calculating the future climate with more CO2. Yet climate models vary greatly from each other even on large regional scales.
Articles in this Series
Opinions and Perspectives – 1 – The Consensus
Opinions and Perspectives – 2 – There is More than One Proposition in Climate Science
Opinions and Perspectives – 3 – How much CO2 will there be? And Activists in Disguise
Opinions and Perspectives – 3.5 – Follow up to “How much CO2 will there be?”
Opinions and Perspectives – 4 – Climate Models and Contrarian Myths
Opinions and Perspectives – 5 – Climate Models and Consensus Myths
Opinions and Perspectives – 6 – Climate Models, Consensus Myths and Fudge Factors
Opinions and Perspectives – 7 – Global Temperature Change from Doubling CO2


And, of course, this is a major problem with models. It’s well known that they have no skill at the regional scale. This is why sub-scale modeling, where the resolution over a region is increased and a coarser resolution model is used for the rest of the planet, doesn’t lead to improved regional results.
Failure to get the pattern right may also explain the large spread in the absolute global average temperature between models.
It is actually much worse than that. The first assumption always made in model “plugs” is that the temperature rise over the last 150 years is mostly due to human activity, despite the clear evidence that such large variations occurred in the more distant past (over the Holocene), and human activity was not responsible for those.
Leonard notes: “the first assumption always made in model “plugs” is that the temperature rise over the last 150 years is mostly due to human activity, despite the clear evidence that such large variations occurred in the more distant past “.
In contrast to AOGCMs, energy balance models assess climate sensitivity using estimates of forcing and the resulting transient change in temperature. However, there are three kinds of climate variability: naturally-forced (traditionally solar and volcanic), anthropogenically-forced, and “unforced” or internal variability. Climate scientists have accurate information from satellites that allows them to correct for the small amount of natural forcing during the last half-century. leaving only anthropogenicly-forced warming contaminated with unforced variability. Going back to 1900, they infer from attribution studies (the “fingerprint” of warming observed in climate models with various forcing) and from other evidence that the 1920-1945 warming was mostly unforced, perhaps 0.3 K. If one accepts AR5’s best estimate for aerosol forcing (-0.9 W/m2?) rather than the more-negative values produced in AOGCMs during older attribution studies, I suspect that there was some unforced cooling in the 1950-1970 pause. And there probably was unforced variability in the 2000’s “hiatus”. But all of these examples of unforced variability are a small fraction of the 0.9 K of nearly global warming (outside the Antarctic Plateau) in the last half-century.
When I look to earlier periods for Leonard’s “clear evidence of large variations in the past” (comparable to the last half-century), I run into serious problems. Past climate fluctuations can be due to a combination of naturally-forced and unforced variability. We don’t appear to have the tools to separate one from the other (unless you want to accept modelers attempts to explain the whole LIA in terms of solar and volcanic forcing). Unless we can extract the unforced component, it doesn’t serve as a precedent for how much unforced variability might have contributed to the 0.9 K of warming in the last half-century. Nor do we have the proxy data to determine that past variations have been “global” rather merely regional. There are clear signs of large temperature variations in Greenland ice cores (LIA, MWP, RWP, Minoan WP), but no corresponding changes in Antarctic ice cores. Greenland is subject to Arctic amplification and its temperature was notoriously unstable (warming 10? degC for brief periods) during the LGM.
If large global temperature variation existed, the best place to look would be in Marcott’s global composite reconstruction of ocean sediment (80%) and ice cores from the Holocene. If one ignores the dubious 20th-century hockey stick blade debunked by McIntyre, there is no significant variability except a slow decline in temperature from the Holocene Climate Optimum mostly centered in the northern extra-tropics and presumably driven by orbital mechanics. Ocean sediment records (marine isotope stages) convinced geologists that a series of glacials and interglacials had occurred long before ice cores. I’m not sure how clearly warming of the last half-century would appear in the middle of such a record given the century time resolution typical of ocean sediment cores and the potential for noise to suppress variability in temperature reconstructions.
The best I can conclude from the our inadequate proxy record is that no unambiguous evidence exists for near-GLOBAL unforced variability comparable to warming in the last half-century – but the absence of evidence shouldn’t be construed to mean proof of absence. Perhaps I’ve gotten this wrong – all skeptics seem to agree with Leonard.
Ironically, a climate that is relatively stable to forced change has a larger climate feedback parameter (say -2 W/m2/K) that will suppress unforced variations and return to a steady state. One the other hand, high climate sensitive (-1 W/m2/K) implies more susceptibility to unforced variation.
That the GCMs fail to match observed patterns is but one of three reasons their projections should be considered with much skepticism. The other two reasons are 1) that they fail to agree with each other, and 2) almost uniformly estimate sensitivities which are inconsistent with (and greater than!) empirically based estimates.
These all point to the same more fundamental issue: the GCMs obviously do not accurately capture important underlying physical processes. The great George Box noted that even a wrong model can be useful. GCMs are most certainly not useful in guiding sensible public policies, whether regional or global.
For the surface to have warmed less than models because of a pattern effect, there has to be a place where the pattern is less warming. And are that keeps getting discussed is the eastern Pacific. If the eastern Pacific is cooling, estimates of climate sensitivity based upon observations are going to be low. When the eastern Pacific flips to accelerated warming, so does the globe. Since 1900, that seems to be the drill. It looks a lot like the PDO. The negative phase that started around 1943 caused some cooling of the earth’s surface; the negative phase that started around 2000 caused a slowdown in the rate of warming. I don’t see the problem with this as its potential consequence is pretty obvious.
And the wild discrepancies between models?
The inconsistent patterns between models? (rainfall, etc)
You can whistle as you walk past the graveyard, but the ghosts are unlikely to listen.
Per the papers below, there is a big uncertainty in aerosol forcing due to pattern effects and cloud interactions so having observed temperatures doesn’t help much. Climate models have a known forcing but the temperatures are uncertain, so pick your poison.
Since 1970, GHG have swamped aerosols, so there is much less forcing uncertainty. Recent 30 to 40-year temperature trends imply TCR is around 1.8C. Add in large OHC increases and low sensitivity becomes very unlikely.
https://www.nature.com/articles/s41467-018-05838-6
https://www.researchgate.net/publication/330478810_Aerosol-driven_droplet_concentrations_dominate_coverage_and_water_of_oceanic_low_level_clouds
Chubbs,
Since 1970, aerosol emissions in Europe and North America have fallen rather dramatically. Not sure if China has completely compensated for that drop or not, but in any case, it is far from clear what historical aerosol effects have been. Hell, it is far from clear what aerosol effects are right now.
Using CMIP5 forcing data, the ratio of aerosol to GHG forcing was 0.48 for the period 1870–>1970, dropping to 0.10 for the period 1970–>2015. So forcing uncertainty is much lower after 1970. That’s when you want to get Delta T/Delta F correct in an empirical method.
Per the article I linked above, aerosols have a different effect when emitted in Europe vs China vs India. So moving aerosols from Europe to Asia has a pattern effect that isn’t reflected in the single global average forcing # used in EBM.
And which of the models match the pattern effect of moving aerosol emissions around? Should we not then declare the models that don’t match that pattern are wrong? The models broadly disagree with each other on climate sensitivity, rainfall patterns, and warming patterns… and lots of other things. If any actually capture reality in a useful way (that is, able to make useful predictions), then there ought to be rational ways to discount the rest and see how the selected few do predicting patterns and the rate of warming in the coming decades. Won’t happen, of course, since the models are as much creatures of political influence as anything else. When I see modeling groups being disbanded because people conclude their models are rubbish, that is when I’ll know technical progress on models is being made.
stevefitzpatrick,
There is a large volume of literature on how to assess models. They (the models) are all “wrong”, but some might be useful. It’s not clear how to assess them.
Vs current climatology?
Vs recent history on temperature or rainfall or cloud cover or … (other parameter)
Vs reproducing important physical processes
It’s not political. It’s just a very hard problem.
There isn’t a B Team sitting there ready to go, but held back by some vested interests. There is no B Team.
SoD,
I agree it is a hard problem, and the discrepancies between the various models say the same thing. I also see that progress is minimal, while expense, and political hysteria based on model projections, grow ever larger. If there is no broadly recognized way to evaluate the models (which is to say, evaluate which are more accurate and so useful in making accurate projections and which should be discounted), then it is very difficult to see how progress will ever be made. In the current rather crazy situation there are endless excuses on offer for why models disagree with reality (and with each other!), and even more reasons on offer for why all the reasonably consistent EBM estimates ‘must be wrong’. The arm waving is so furious that some people seem likely to take to the air at any moment.
It seems to me the focus should be on narrowing the largest uncertainties: deep ocean heat uptake, influence of aerosols (both direct and on clouds), and understanding all the fudged processes (convection, clouds, rainfall) taking place below the grid scale of models. Taking model projections seriously at this point strikes me as an embrace of irrationality.
SOD writes: “It’s not clear how to assess them.”
The critical question is how the planet responds to warming: How much do OLR and reflected SWR increase per degK of surface warming? These are the key factors that control ECS. The biggest changes in OLR and OSR that we can observe are associated with the 3.5 K of seasonal warming that occurs every year. Models do a poor job and mutually-inconsistent job of reproducing those seasonal changes (except WV+LR feedback through clear skies). So there is no reason to believe that AOGCMs can predict the feedbacks that will occur in response to global warming. Tsushima and Manabe (2013) put it more diplomatically:
“Here, we show that the gain factors obtained from satellite observations of cloud radiative forcing are effective for identifying systematic biases of the feedback processes that control the sensitivity of simulated climate, providing useful information for validating and improving a climate model.”
“One can argue whether the strength of the feedback inferred from the annual variation is relevant to global warming. Nevertheless, it can provide a powerful constraint against which every climate model should be validated.”
Chubbs writes in various comments: “Recent 30 to 40-year temperature trends imply TCR is around 1.8C.” “Per the article I linked above, aerosols have a different effect when emitted in Europe vs China vs India.”
Aerosol forcing is a confusing subject, and I believe some of your information is incorrect. In the case of GHGs, we have laboratory measurements that allow us to calculate their radiative forcing through today’s atmosphere, or in an AOGCM, through a hypothetical future atmosphere. Aerosol forcing is more complicated. The reflection of sunlight is a fairly straightforward problem, and probably varies only slightly with geography. The attenuation of SWR by stratospheric aerosols is directly measured at Mauna Loa, and I suspect we have similar measurements where tropospheric aerosols are common. These forcings are anchored in measurements.
However, to my knowledge, the aerosol indirect effect on clouds can not be measured. This is a quantity that only comes from AOGCMs. Tunable parameters in AOGCMs control the magnitude of the Toomey effect, the decrease in droplet size caused by increasing numbers of cloud condensation nuclei. Theory and laboratory experiments show that smaller droplets reflect more SWR, making aerosol forcing more negative. The number of natural cloud condensation nuclei varies dramatically geographically, so the magnitude of the Toomey effect depends on where aerosols are present. The Toomey effect is transient, smaller water droplets evaporate and make thermodynamically more stable larger droplets. The chapter in AR5 on aerosols concluded that – with some minor exceptions – there is little evidence that a significant Toomey effect is operating in our climate system. Since our only quantitative data about aerosol forcing came from AOGCMs, many of the forcings we encounter are now obsolete. The idea that aerosol forcing varies dramatically with geography may also be obsolete, since this presumably arises mostly from the aerosol indirect effect. IIRC, the direct aerosol effect is -0.5 W/m2, the best estimate for the aerosol indirect effect is -0.4 W/m2 (with some studies reporting zero). AR4 asserted aerosol could be as negative as -1.9 W/m2 and aerosol forcing from the average AOGCM was significantly more negative than the expert’s revised best estimate.
The historic hindcasts from CMIP models and their multi-model mean presumably are biased by obsolete aerosol forcing, including TCR and ECS from historic runs. When one uses obsolete values for aerosol forcing in an EBM, the total forcing is too low and the climate sensitivity is too high. Otto (2013), written by many of the same IPCC authors responsible for the new consensus on aerosol forcing, revised published estimates of aerosol forcing (from AOGCM’s) downward, which is why they reported much lower climate sensitivity than earlier workers. Their best estimate is 1.3 K/doubling (0.9-2.0, 95% ci). Their TCR for 1970-2009 is 1.4 K/doubling (0.7-2.5) and judged less reliable due to Pinatubo. Lewis and Curry (2018) reported a TCR of 1.3 K using C&W’s adjustments to HadCruT (1.2 K without). If you have conflicting TCRs from elsewhere, please cite the source – but first ask yourself if your source is obsolete.
Since about 2000, aerosols have been falling. Soon, it may be possible to analyze data over a period where the total amount of aerosol hasn’t changed. (Those still using models with a large aerosol indirect effect may claim a forcing change from geographic changes in emissions.)
Frank, a recent measurement study found a large indirect aerosol effect, larger than that used in climate models (linked for second time below). Several other recent studies have also found large aerosal effects, direct and indirect, so don’t agree with your text above re-aerosals. Aerosal effects are still uncertain and limit the usefulness of observations for estimating TCR or ECS, particularly pre-1970 observations.
Otto uses a 19’th century baseline, similar to L&C, so not surprising that results are similar to L&C. I do agree that aerosals are becoming less important. Per my comment above, since 1970, GHG forcing has predominated over aerosal forcing by roughly 10 to 1. My TCR estimates are up-to-date and are made quite simply by dividing the average rise in temperature by the average rise in man-made forcing using post-1970 data only. Over recent decades, tempertures are rising faster than predicted by EBM and more in-line with climate models.
https://www.researchgate.net/publication/330478810_Aerosol-driven_droplet_concentrations_dominate_coverage_and_water_of_oceanic_low_level_clouds)
Chubbs: Thanks for the link to Rosenthal (2019). The last paragraph of the paper concludes:
“If the reported observed large sensitivity of shallow marine clouds to aerosols were incorporated in GCMs, they likely would simulate global cooling, whereas the world is actually warming. This argument has been used to dismiss such large sensitivities.”
So this paper isn’t debating whether the AR4 or the modestly less-negative AR5 best estimate for the aerosol indirect effect (-0.1 to -0.9 W/m2) is correct. This paper is saying that the aerosol indirect effect from marine stratocumulus clouds alone more than negates all of the forcing from rising GHGs and everything about clouds in AOGCMs needs gross revision.
Does anyone have access to the perspective that Science published along with this article?
How do aerosols affect cloudiness?
Science 08 Feb 2019:
Vol. 363, Issue 6427, pp. 580-581
DOI: 10.1126/science.aaw3720
FWIW, you can find AR5’s data on forcing vs time used to make Figure 8.18 in Annex II here:
https://www.ipcc-data.org/sim/index.html
Yes, this paper isn’t the final answer on aerosols. If it is correct though we need to be cautious about the aerosol forcing estimates used in EBM and climate models. However climate models can get the right answer by fitting recent observations with compensating errors. Fortunately aerosols have become less important recently, so we can project forward using the recent rise in temperature. Unlikely that the recent 0.18C per decade rate of rise is going to decrease.
There are great exaggeratons and great oversimplification in the aerosol effects. Human emissions is only a part of the total emission. Nature gives a great component. So the offset of warming is much smaller than assumed.
“Without a measure of the amount of natural aerosols that were present in the atmosphere a few hundred years ago, it’s hard to know how much things have changed since humans started adding manmade aerosols into the mix. That makes it difficult to calculate the exact size of the cloud-aerosol cooling effect. Professor Ken Carslaw says these natural aerosol uncertainties have “essentially been neglected in previous studies”.” https://www.carbonbrief.org/natural-aerosols-complicate-climate-understanding
I don’t know how well models get the aerosol pattern effect correct, however I am sure that they do a better job than using a single global # for aerosol forcing. Aerosols are probably the most important reason for low-bias in EBM. Per the paper below, using an ensemble of climate model runs simulating the 20’th century and replicating EBM, returns a TCR of 1.44 vs the true climate model TCR of 1.8.
https://eartharxiv.org/mn68e
While climate models can’t match the patterns in our single climate realization. They do provide an estimate of how much variability we might expect from one realization to another; fairly substantial it turns out, mainly due to variation in ocean circulation interacting with sea ice and clouds.
Exactly why are you sure a single global value for aerosol effect is less accurate? It sounds more like a statement of faith than reason.
You assume (of course) that EBM estimates of sensitivity are biased low. I similarly assume model estimates of sensitivity are biased high on average, and some biased insanely high. Of course, you don’t address why different models project substantially different sensitivities…. some have to be very wrong.
I don’t assume anything. My statement on a single global value for aerosol forcing is taken from the paper I linked. The other paper I linked indicated that EBM were biased low.
However my main problem with EBM is they don’t match recent observations.
We have 40 years of global temperatures increasing by 0.18C per decade, roughly 1.8 TCR. Our current heat imbalance 0.8 W/M2. No climate model needed to see where we are headed. Just project out recent trends. Are you expecting something different?
You say you don’t assume anything. I note again:
“Of course, you don’t address why different models project substantially different sensitivities…. some have to be very wrong.”
It appears to me you do assume broad disagreement between GCMs doesn’t mean much of anything important about the models. But disagreement between the average of GCMs (which disagree with each other!) with convergent EBMs means the EBMs are wrong. I find that most odd.
Climate models are uncertain yes, but I don’t see much bias vs recent observations. We usually focus on the mean, but EBM studies have fairly broad uncertainty ranges and they aren’t including uncertainty due to one realization or aerosol spatial patterns. Switch Best for Hadcrut and EBM estimates increase by 20%. Run EBM using a post-1970 baseline and numbers also increase. Below is a non-linear EBM, which fits obs well, and with ECS similar to climate models.
https://agupubs.onlinelibrary.wiley.com/doi/full/10.1029/2018EF000889
So there is no lack of EBM spread. In fact a consistent uncertainty analysis of both approaches would probably show broad overlap in ECS range between climate models and EBM.
There are many other ways of estimating ECS besides EBM and climate models, generally in agreement with climate models, but also with a wide spread. That seems to be the nature of the beast.
Chubbs writes: “Below is a non-linear EBM, which fits obs well, and with ECS similar to climate models.”
This isn’t an EBM. This is a model built from an ensemble of possible feedbacks with various strengths and time dependences. A set of feedbacks producing output allegedly compatible with both EBMs and AOGCMs has been selected. It is true that feedbacks operate on different time scales: Planck feedback is instantaneous, water vapor, lapse rate and LWR cloud feedback develop in days to weeks. Changes in surface albedo require months for seasonal snow cover and sea ice and years to millennia for other parts of the cryosphere. Fortunately. the total ice-albedo feedback is small (+0.3 W/m2/K) in most AOGCM’s, so its time dependence is minor issue. Several groups have results suggesting that reflection of SWR by clouds takes several months, but not longer, to fully respond to changes in surface temperature. The term effective climate sensitivity is used when assessing climate sensitivity over periods too short to represent an equilibrium change.
However, these time-dependent feedbacks are clearly not responsible for the discrepancy between EBMs and AOGCMs. AOGCMs incorporate feedbacks over about 150 years (or 70 years in older 1% pa runs). Otto (2013)’s EBM covered 40 years, Lewis and Curry covered 130 years (though most of the change was in the last 40). The time-dependence of the above feedbacks doesn’t explain the inconsistency between EBMs and AOGCMs.
The authors have added a new time-dependent “feedback”, the “cloud response to sea surface temperature adjustment feedback”, to describe the “the slow cloud feedback occurring as the spatial pattern of sea surface temperatures (SSTs) change in response to warming over many decades”. The paper references many other papers discussing time-dependent changes in feedback. The amount of this feedback varies from model to model, and a few show almost none of this phenomena.
We already knew that the spatial pattern of sea surface warming is responsible for the discrepancy between AMIP experiments (those forced with historic SSTs) and historic runs (forced by historic GHGs and aerosols). All AOGCMs exhibit a climate feedback parameter consistent with a low ECS (similar to EBMs) when forced with historic SSTs, and a much higher ECS when forced with rising GHGs. In the latter case, the model regionally accumulates heat in a pattern we don’t observe. EITHER MODELS ARE WRONG or chaotic fluctuations in ocean phenomena like the AMO, PDO and ENSO have directed our climate into a pattern that a hundred historic AOGCM runs didn’t hindcast. (The former possibility is heresy).
The post linked below from Isaac Held shows an AOGCM doing a spectacular job of reproducing seasonal changes in the large scale flow of the atmosphere when forced with observed SSTs, but a poorer job when ocean temperature evolves without direction.
https://www.gfdl.noaa.gov/blog_held/60-the-quality-of-the-large-scale-flow-simulated-in-gcms/
So, this “non-linear EBM” doesn’t “fit observations well”; it simply reproduces a time-dependent change in feedback that has only been observed in AOGCMs.
Goodwin did use an energy-balance model, but it was extended with more fitting parameters and using more data. A linear model only estimates one parameter, so although the fitting period extends over 100+ years, EBM can’t resolve the recent more-rapid rise in temperatures.
I am not convinced that feedback timing is the sole explanation for the non-linear response, aerosols could also cause non-linearity since they do not ramp uniformly in time, but are front-end loaded instead. Bottom-line there are many ways to fit simple models to the available observations. Non-linear fits, which can resolve the recent observations give higher TCR+ECS than EBM.
I see two components to the “pattern effect”.
1) the east Pacific and round Antarctica on average first warm more slowly than other places, then they warm faster (e.g. https://doi.org/10.1073/pnas.1714308114). The models generally agree on this.
2) is whether there’s been a big natural (or maybe aerosol driven) change in the Pacific temperature pattern in obs that is outside what most of the models get (doi: https://doi.org/10.1029/2018GL078887).
I think 1) is pretty easy to understand and seems rock solid. Areas of the ocean where old, colder water comes to the surface take longer to heat up. Eventually the upwelling water comes from the start of the global warming period and temperatures rise faster.
Upwelling regions have colder SSTs and strong inversions with lots of reflective low clouds. The later warming weakens the inversion, reducing the cloud amount and changing global feedback. Antarctica is trickier but it looks like the overall effect is to boost warming.
So long as you agree that upwelling regions warm more slowly and that they tend to have stronger feedbacks than the global average, you get a long term “pattern effect”, I don’t think that’s a great mystery any more and the models largely agree on this one. Pattern effect 2) needs a different discussion.
MarkR: Thanks for the links to articles. However, if you are going to discuss ocean upwelling, you probably don’t want to refer to results from abrupt 4X CO2 experiments. Those experiments result in a large amount of warming (IIRC 1.5 K the first year and 4 K the first decade). There has been little time for heat to be transported below the mixed layer, so the ocean’s stability towards overturning has been artificially increased in a manner that our planet will not experience. Gregory plots (TOA imbalance vs Ts) from 4XCO2 experiments provide simple way to extrapolate an ECS and instantaneous forcing for 4XCO2, but otherwise I’d suggest output from RCP or 1% pa experiments.
I’m confused about when the water upwelling under marine boundary layer clouds is expected to warm. If this involves the deep ocean, the time scale of warming is roughly a millennium. By then, atmospheric CO2 will have begun to equilibrate with the deep ocean sink and dramatically reduced atmospheric levels of CO2. IIRC, the airborne fraction at equilibrium will be about 20%. Shallower overturning
MarkR wrote: “As long as you agree that upwelling regions warm more slowly and that they tend to have stronger feedbacks than the global average, you get a long term “pattern effect”, I don’t think that’s a great mystery any more and the models largely agree on this one.”
Frank suggests: “the models – that can’t replicate the feedbacks observed during seasonal warming nor warming over the past 40 years – largely agree on this one.” The increase in climate sensitivity with time (or is it with warming) in models has been a popular subject ever since Otto (2013) demonstrate that historic effective climate sensitive was low. The question is whether models demonstrate any real skill in predicting changes in boundary layer clouds or the pattern of SST warming. Hopefully someone will address these issues.
Both papers fall in the general category of ‘It’s Models, all the way down.’ At least Andrews et al come right out and say:
“Assuming the patterns of long‐term temperature change simulated by models, and the radiative response to them, are credible; this implies that existing constraints on EffCS from historical energy budget variations give values that are too low and overly constrained, particularly at the upper end.”
Seems to me a pretty big assumption.
You can’t validate a model by comparing the model output with itself. Make predictions (about the future, not post-dictions about the past), then compare to measured future reality.
I’ve never seen any validation of EBM predictions or even a chart showing temperature obs and the EBM fit.
Roy Spencer had a blog post where he compared temperatures from his EBM with the data. The agreement was good.
I guess the question is why anyone would think otherwise.
Chubbs wrote: “I’ve never seen any validation of EBM predictions or even a chart showing temperature obs and the EBM fit.”
An energy balance model in general is simply an application of the law of conservation of energy to a particular situation. In his first few blog posts, Isaac Held describes varies energy balance models that have been applied to climate and the output of climate models. What you are referring to as an EBM is a TWO-COMPARTMENT MODEL consisting of the surface (atmosphere+mixed layer of the ocean) and the deep ocean. Held explains why this EBM predicts a linear relationship between forcing change dF and warming dT on decadal time scale: dT = TCR*dF.
https://www.gfdl.noaa.gov/blog_held/3-transient-vs-equilibrium-climate-responses/
EBM’s are “validated” in the sense that they fit the output of climate models reasonably well. If AOGCMs are valid models of our planet, EBMs can also be applied to observed forced changes in the temperature of our planet.
Does anyone know of a recent textbook or review that deals with the application of various energy balance models (multi-compartment models) to climate. Multi-compartment models for analyzing the output of climate models appear to have been developed rather recently. TCR was first defined in 2001. Most papers seem to rely on an ad hoc collection of equations without addressing the important question Chubbs asked above: How do we know when an EBM is valid? All EBMs are based on conservation of energy, but we often make assumptions when we apply COE to a particular situation.
http://www.drroyspencer.com/2018/02/a-1d-model-of-global-temperature-changes-1880-2017-low-climate-sensitivity-and-more/
I thought this blog post was pretty good and showed that EBM’s can indeed do a pretty good job of matching average temperatures. Of course that should be easy if you believe the IPCC doctrine that average temperatures are a strong function of forcing.
Point 2) is more complex, but 1) uses model output too. The argument being that physics is our best guide to the future.
Do you have an issue with any of the points? i) there are areas where cold water upwells in the ocean, ii) a constant supply of colder water slows down local warming until the upwelling water is from the warming period, iii) a cooler surface increases inversion strength, iv) low clouds respond to inversion strength?
Do you think any of those are wrong? Why?
“The reason for preferring observations over models seems obvious – even though there is some uncertainty, the results are based on what actually happened rather than models with real physics but also fudge factors.” – scienceofdoom
Quite true. There are robust sources going way back in some relevant disciplines bearing upon ocean heat uptake, ocean heat content, sea level impacts (Beyond Fingerprints: Sea Level DNA – 2).
I don’t think that’s right. There are NO observations of ECS. The so-called “observations” are actually estimates using a model (the linearized energy balance model that sets the response equal to surface temperature). If you apply that methodology to a climate model with known ECS, it does not always yield the right answer. So there are valid reasons for looking critically at the “observations of ECS.”
Here’s a paper that shows this: https://www.atmos-chem-phys.net/18/5147/2018/
My comment got mis-formatted. The top three paragraphs (“This comes out … fudge factors.”) should be a quote from SoD’s original post. Sorry!
No problem, I fixed it up.
Yes Andrew, We have been over this before. Nic Lewis wrote a very convincing response to your paper.
On another thread you showed some examples of how large and long surface temperature departures from an ensemble average can be. Your paper I think just highlights that large variability in one GCM. If indeed the real system has that much variability it would in my mind cast doubt on attribution studies too. It’s just another example of the large uncertainties in climate science, making it subject to bias caused by “selecting” a particular model or set of data.
I also suspect that mid tropospheric temperatures have higher uncertainty than surface measurements. The record is much shorter and the coverage spotty with radiosondes.
I am endlessly amused how climate science is totally uncertain — unless it’s a result I like. So there’s too much variability for attribution studies, but no uncertainty at all about low ECS.
Andy wrote: “I am endlessly amused how climate science is totally uncertain — unless it’s a result I like. So there’s too much variability for attribution studies, but no uncertainty at all about low ECS.”
Andy: I agree with you that scientists should adopt consistent view of all of the evidence regardless of their personal biases. However, no matter how one looks at it, models are “likely to be wrong*. Either:
A) models produce too low an ECS to agree with EBMs OR
B) models produce too little unforced/internal variability to explain their inconsistency with EBMs.
Can you resolve this dilemma for me?
By “likely to be wrong”, I mean that if we compare the pdf for ECS for the 100-member historic ensemble in your paper – output which includes unforced/internal variability – and the pdf for an EBM, and calculate the pdf for their difference, the 70% confidence interval will not include zero. This is the far below the normal standard for scientifically demonstrating that EBMs are inconsistent with AOGCMs and invalidate AOGCMs as viable theories, but consistent with IPCC’s policy on how to describe such findings to policymakers and the public.
I don’t have a strongly held view on the value of ECS. It looks to me that estimates are all over the map. I will just note that Nic Lewis has a lot of credibility for me since he has no pubic political or policy opinions (except that he has expressed mild approval for a carbon tax). He seems to stick to the science.
Nic is obviously very skilled in statistics. It does appear to me that this is a defect of climate science and many other fields too. Most papers (even those that rely heavily of complex statistical analysis) don’t seem to have professional statistician involvement. In medicine it is common practice to hire a professional to develop study statistical methods and apply them. And of course reregistration of trials is becoming more common and has in one case resulted in a sharp decline in reported positive results.
I also believe that SOD’s critique of climate models is absolutely supported by first principles numerical analysis. Since the truncation discretization errors are quite large (we know this from 60 years of work on aeronautical turbulent simulation practice and theory) any skill must be due to tuning to produce cancellation of errors. Quantities not related to those used in tuning will be skillful only by change. Aeronautical simulations usually are tremendously simplified of course compared to the real atmosphere.
In addition, it would be a miracle if a strongly turbulent process like convection could be modeled well by a relatively simple sub grid model. We can’t do that for simple large turbulent boundary layer separation or for simple turbulent shear layers despite 60 years of intense research. These phenomena seem to require eddy resolving simulations which of course have their own severe challenges. Among these is the impossibility of using classical methods of numerical error control. Without numerical error control or estimation, it’s really hard to avoid the selection bias problem. Particularly in the new soft money research paradigm, its very tempting to simply run the simulation varying parameters and grid until you find one that looks credible and then you publish that one. It’s a constant danger that I’ve seen play out over and over again in the literature. Those who develop the models know these problems very well. Often those who run the models develop an unjustified faith in their skill at getting “good” answers. At least there seems to be a consensus among climate model developers that these practices need to be ended.
Frank: I think it’s important to realize that the PDFs from the EBM papers (e.g., Lewis and Curry, Otto et al.) is different from the uncertainty in the Dessler et al. PDF. In my paper, the uncertainty is ONLY due to internal variability — because it’s a perfect model study, there is no uncertainty in things like radiative forcing. In the EBM studies, the PDF is due to uncertainty principally in radiative forcing. If I add some fake radiative forcing uncertainty to my PDF, it would expand. I did a quick calculation adding 1 W/m2 of uncertainty to RF (5-95%) and the width of my PDF increased by about 50%. And the EBM papers don’t include internal variability uncertainty in their PDFs, so including that would increase their width. Overall, I’m confident that an apples-to-apples comparison would show considerable overlap between the PDFs.
Andy: Thank you for taking the time to reply to my question about comparing the pdfs of AOGCMs and EBMs.
Andy wrote: “I think it’s important to realize that the PDFs from the EBM papers (e.g., Lewis and Curry, Otto et al.) is different from the uncertainty in the Dessler et al. PDF. In my paper, the uncertainty is ONLY due to internal variability — because it’s a perfect model study, there is no uncertainty in things like radiative forcing. In the EBM studies, the PDF is due to uncertainty principally in radiative forcing. If I add some fake radiative forcing uncertainty to my PDF, it would expand. I did a quick calculation adding 1 W/m2 of uncertainty to RF (5-95%) and the width of my PDF increased by about 50%. ”
Why would you add radiative forcing uncertainty to your pdf? You are inputting historic data on the AMOUNT of various forcing AGENTS and relying on your model to correctly calculate the AMOUNT of RADIATIVE FORCING these agents produce. If your model does that wrong, the model is wrong. Radiative transfer calculations are very accurate – provided that the correct temperature, pressure and composition (especially humidity and clouds) data for all grid cells is used by the radiative transfer module. We know that weather prediction programs fail to be skillful after about a week due to the effect chaos on this input data. The FUNDAMENTAL ASSUMPTION behind AOGCMs is that this chaos will average out over any particular period in the future, say 2090-2110. In other words, AOGCMs can predict climate change without getting the future weather on any day correct or predicting the Super El Nino that will occur in 2102 or the relative paucity of strong El Ninos in the 2090s. With 100 runs, you have excellent information about the combined effects of initialization uncertainty and unforced/internal variability.
Your paper analyzed the period 1850–2005, for which AR5 believes the forcing change is 2.3 W/m2. Now you are telling readers that the forcing your AOGCM generates could be off by +/1 W/m2 or +/-50%. That seems crazy. The output from any single climate model doesn’t have an additional +/-50% fudge factor added to it before being presented to policymakers! So why should this fudge factor be added when validating your model against an EBM?
Andrew, I think Lewis and Curry did take account of internal variability. Nic’s blog post (linked in an earlier comment) on your paper says in the summary:
I would say however that the fact that the IPCC range of ECS hasn’t narrowed since the Charney report shows that climate science is not making much progress on the primary quantification issue in its remit. And now we are hearing that CMIP6 models have significantly higher ECS than CMIP5 models. That I think is Frank’s point.
I do wish that climate science could wean itself off of the reliance on climate models and return to theory and fundamentals. Despite initial overestimation of the effect size, the iris effect seems to me to be one of the few new insights of the last 30 years of research. Lindzen is a prime example of a contrarian who can think outside the box and take chances with his research. One of his students finally demonstrated the cause of the ice age cycles convincingly.
The average quality of what passes for science in computational fluid dynamics generally (which includes weather and climate models) has materially declined over time. That’s partially due to the dramatic increase in the supply of scientists who need to make a living, which these days requires a massive resume of publications, and partly due to the dominance of simulation studies. Most of these are actually flawed by selection and positive results bias, but they seem to be demanded by a flawed system. The big lie here that the scientific soft money culture has generated is that CFD is a solved problem. Thus funding for fundamental work has dried up leaving scientists to just run the codes on ever more complex problems and compete with each other to generate the best “selected” and close to “perfect” results from fundamentally uncertain simulations.
dpy6629 wrote: “In addition, it would be a miracle if a strongly turbulent process like convection could be modeled well by a relatively simple sub grid model. We can’t do that for simple large turbulent boundary layer separation or for simple turbulent shear layers despite 60 years of intense research.”
In the linked blog post, Isaac Held claims that the large scale flow in the atmosphere is primarily 2-dimensional and therefore vastly simpler compute. He also shows that the large scale flows his models do produce agree extraordinarily well with observations (reanalysis). The fact that other models don’t agree as well suggests to me that bias from the climate model used to re-analyze observation is not the reason for this agreement. Any comments?
https://www.gfdl.noaa.gov/blog_held/60-the-quality-of-the-large-scale-flow-simulated-in-gcms/
Am I correct in understanding that this large scale flow is primarily the result of the Coriolis effect operating on the Hadley, Ferrel and polar cells?
The key fact I picked up from this post is that the agreement depends on running the model in AMIP mode – ie providing the model with observed SSTs. Furthermore, CMIP5 models provide climate feedback parameters consist with EBMs when forced with historic SSTs.
Yes Frank, Held and I had a brief email exchange about this.
1. What he is talking about is Rossby waves. These have mild pressure gradients and are close to 2D, well at least one can make the case.
2. It is incorrect however to say that 2D flows don’t have issues with turbulence modeling. Whenever there is flow separation the errors can become large. You can get fully developed vortex streets in 2D too. The atmosphere doesn’t have much separation though and this is Held’s argument.
3. The problem here is that in the real atmosphere turbulence is highly variable and can be very large as anyone who has flown in an aircraft can attest. This is true even outside of convective cells. Wyoming is notorious for severe clear air turbulence which I experienced once. It was quite scary.
4. Turbulent fluid has effectively an augmented viscosity compared to laminar fluid. The higher the level, the higher the viscosity. Turbulence models do just that, they add a variable viscosity that is convected by nonlinear PDE’s. Weather and climate models (and indeed all CFD methods) have numerical viscosity in addition in order to be stable. This viscosity can be very large if the grid is not really fine. Since turbulence is ignored except near the surface, the effect of turbulence is ignored. Now of course years of tuning may have yielded a numerical viscosity that in the average is roughly right, but the dynamics will still be wrong.
4. I have noticed in long term weather forecasts what looks to me like pressure gradients tending to relax over time, perhaps due to this numerical viscosity.
5. Convection is different. It’s fully developed 3D turbulence. So Held’s claim is inapplicable. Convection in the atmosphere is vastly more complex than a simple separated boundary over a backward facing step. Turbulence models fail for this latter problem despite 60 years of intense research. Eddy resolving simulations seem to be required to get in the ball park of experiment. I don’t find it credible that simple sub grid models can possibly give skillful predictions of tropical convection, where vertical velocities can exceed a hundred miles per hour. If they had something it would be being used in other branches of CFD.
6. The modeling community I’m sure knows this and has been working on things like aggregation of convective cells. I fear the road ahead is very long and lined with ravenous wolfs.
7. As always in CFD, the users of the codes, and the hordes of climate scientists mostly just run the codes, don’t understand these issues unless they have more rigorous mathematical training. They often just run the code until they get a defensible result and then publish.
That’s why I lament about the state of fluid dynamics research. The incentives don’t favor making fundamental progress and encourage (as I said above) causing a brownout so as to power ever more massive computers to churn out more and more results that provide little insight and have essentially no error quantification.
I personally believe the uncertainty in climate models is much higher than the IPCC’s analyses, which use an invalid statistical approach. To find a lower bound on uncertainty you need to systematically vary all parameters of the simulation. And of course, uncertainty is highly dependent on the type of problem specified. I have personally generated high quality data proving that aeronautical simulations have much more uncertainty than most in the community believe. Regulatory agencies still require very extensive and very costly campaigns of flight testing for this reason.
Frank, I revisited Held’s post that you linked. I don’t disagree all that much. However, he is showing QUALITATIVE agreement of Rossby waves which is the part models are pretty good at. It’s only a small part of the climate system which includes the oceans and the tropics too.
“That’s why I lament about the state of fluid dynamics research.”
dpy, Why don’t you just solve Laplace’s tidal equations like I did and simply add in the tidal forcings? Then you can model fluid climate behaviors such as ENSO and QBO — follow the recipe in the monogaph, or keep track of the closely related research of Delplace and Marston.
I looked a science paper by your authors and it looks qualitative to me. Can you point me to some analysis of overall statistics for a real world situation?
The assumption you are making is that these behaviors are statistical. They are not. They are single instances of standing waves.
You need to define a standing wave. Chaotic flows generally have patterns of vorticity that are statistically distributed and only the statistics have any chance of being diagnostic of skill of any model of them. We know that ocean dynamics near the equator have chaotic characteristics (at least I gather that from ENSO predictions for example).
The absolutely fixed standing wave in space and the absolutely fixed synching to an annual impulse in time preclude a chaotic origin to ENSO. It’s as if some random guy off the street glanced at a tidal pattern and called that chaotic. In fact, every variation in the earth’s length-of-day has a tidal forcing and this is propagated to the inertial sloshing of the equatorial thermocline, thus leading to ENSO dynamics. And it doesn’t hurt that I know how to solve Navier-Stokes given topological constraints (see Delplace and Marston) while you don’t.
Well, the errors here are manifold Paul. A standing wave usually refers to a resonance for example in electromagnetics. Once the periodic phase is factored out, the wave is absolutely constant. Of course Maxwell’s equations are linear and regularity theorems are available that its well posed.
That’s not the case at all with the ocean or even with the shallow water equations. Tidal records also are not “standing waves.” They reflect all kinds of weather effects especially wind direction or storm surges. These are chaotic of course. The “forcing” at least is chaotic so ENSO has all the statistical properties of regular chaos.
It’s a little bit like saying that a turbulent boundary layer is not chaotic because we have very good turbulence models that can make it a steady state problem at least for very mild pressure gradients. Of course its chaotic. A given model can’t show whether it is or isn’t.
Quibbling about where that chaos comes from is irrelevant. I’m not going to waste any more time on an argument you have been making on the internet for at least a decade that is just childish and really rather meaningless. ENSO is chaotic period.
The state of the art in fluid dynamics research is not for the faint of heart.
Tauber, C, P Delplace, and A Venaille. “A Bulk-Interface Correspondence for Equatorial Waves.” Journal of Fluid Mechanics 868 (2019).
Souslov, Anton, Kinjal Dasbiswas, Michel Fruchart, Suriyanarayanan Vaikuntanathan, and Vincenzo Vitelli. “Topological Waves in Fluids with Odd Viscosity.” Physical Review Letters 122, no. 12 (2019): 128001.
The above two cites are indicative of the recent spate of research linking topological constraints to fluid behavior.
So I recommend that you can either catch up, or continue to “lament about the state of fluid dynamics research”
Paul Pukite, You are trotting this idea out as if its something new and exciting. It’s not. Many chaotic flows have a “standing wave” steady state base flow. That’s even true for flow over a backward facing step. After 100 years of research on turbulence models, we are not much closer to being able to use this decomposition. It appears that resolving the turbulence is needed to get improved answers.
ENSO is chaotic and your repeated assertions that it is not are wrong. Tidal records are chaotic and your reference to them is simply wrong.
And please stop your snide suggestions on twitter that are little more than personal smears.
SOD, what we have here is classical passive aggressive behavior. On your blog, Paul Pukite sticks to the technical while on twitter quoting my comments and attacking.
I have presentations at the last 3 AGU meetings and an AGU monograph chapter published by Wiley on the topic. Have received lots of positive feedback, excepting for AGW skeptics who invariably seem threatened by the findings.
Paul, It’s has nothing to do with “feeling threatened.” Perhaps you are projecting your own emotional needs for approval onto other people.
Technically this idea of “standing waves” is nothing new and doesn’t really help in actually predicting anything. It really is about the chaos and predicting that component.
ENSO is not chaotic. The Lyapunov exponent for any reasonable ENSO model turns out non-chaotic : any selection of initial conditions generates a solution that synchronizes with an annual cycle.
Well then why can’t anyone predict ENSO a year in advance? Your Lyopanov exponent must be for a simplified model as its impossible to calculate something like that for a full model of the ocean/atmosphere. You just keep repeating these snippets with no context and they can’t be right.
Simplified models can be very useful and this work you cite is useful. It’s just that as a predictive tool its not there yet and may never get there.
A climate science skeptic requesting predictions is simply imposing a delaying tactic. Predictions are a moot point when there is enough historical data for many conceivable cross-validation measures to be yet performed.
As an example, autocorrelation of the ENSO power spectrum shows a distinct 1-year correlated shift in all frequency components:
This is a consequence of Floquet (math) or Bloch theory (condensed matter physics), concisely expressed as F(t) = exp(-iωt)P(t), whereby a clear periodic function can be extracted from a signal.
All my work and the topological analysis for systems showing chirality is being done by scientists with a strong background in condensed matter physics theory.
Dasbiswas, Kinjal, Kranthi K. Mandadapu, and Suriyanarayanan Vaikuntanathan. “Topological Localization in Out-of-Equilibrium Dissipative Systems.” Proceedings of the National Academy of Sciences 115, no. 39 (September 25, 2018): E9031–40. https://doi.org/10.1073/pnas.1721096115.
This is just the tip of the iceberg as many more research papers and presentations will be coming down the pike.
Well Paul, You say:
“A climate science skeptic requesting predictions is simply imposing a delaying tactic.”
You should stop ascribing motives to people whose motives you can’t possibly know. It’s called reading minds and is an obvious and dishonest rhetorical tactic.
Asking for predictions is what I always ask for people selling a particular modeling method. There are thousands of CFD salesmen out there. Most are more honest and direct than you in that they usually respond to direct questions with a real answer if they want me to buy their research.
You have been asked this same thing scores of times over the last 10 years on various climate blogs and have always done exactly what you are doing here.
In CFD skepticism is justified and I have strong evidence that CFD is in fact much worse than salesmen like you make out. If you won’t answer a direct question, I won’t believe in what you are saying. You won’t help your case with bullying tactics and deflections. The fact that you don’t seem to understand this further harms your case with those reading this thread.
There is some new understanding in this line of work you are advocating. But its so far not relevant to predicting anything which is the gold standard of all CFD.
Well dpy6629 if you really want a prediction all you have to do is run the model. So knock yourself out.
And if you want to debunk the solution to Laplace’s Tidal Equations along the equator, feel free to do that also. I have it all in the can and unless you want to argue particulars, hand-wavy rhetoric asserting “because chaos” is pointless.
Paul, There are literally tens of thousands of CFD codes and methods out there, many freely available from Universities or NASA. It is not my job to evaluate the skill of any of them. The burden of proof is on those who are trying to sell or promote their favorite method or code. It’s your job and your collaborators to show that this method is valuable and skillful.
It is not in my view very interesting or a new fundamental insight. Kind of like a special case of Reynolds averaging which converts a chaotic turbulent flow into a steady state problem for which conventional numerical methods have a better chance of working.
The really important problems in CFD are turbulence modeling and finding some way to evaluate uncertainty in time accurate eddy resolving simulations.
“The burden of proof is on those who are trying to sell or promote their favorite method or code. It’s your job and your collaborators to show that this method is valuable and skillful.”
OK, I did. It was peer-reviewed and published. It’s up to others to either (1) invalidate the model or (2) devise a better model. Option (3) of me coming up with a strategy to invalidate my own model or devise a better model is you once again baiting me into a delaying tactic.
So, it looks like you are the one that is engaging in a discussion and lacking any ammo to back up what you are claiming.
Paul, This conversation has been no more productive than at least 5 others over the last decade.
You have been asked over and over again for an ENSO prediction. You always deflect, dodge, repeat marketing claims, and squirm but never deliver. Virtually any casual observers will conclude that your ideas are incapable of doing so because ENSO is chaotic.
“You have been asked over and over again for an ENSO prediction. You always deflect, dodge, repeat marketing claims, and squirm but never deliver.”
You must not have been one of my peer-reviewers then?
From Dan Hughes, via email. Dan attempted to comment via the website but didn’t succeed.
—-
It is a very hard problem. But it is not an impossible problem.
All aspects that are important relative to applications require “assessment”. The nomenclature in modern scientific and engineering computation is Verification and Validation.
Related:
Richard B. Rood, Validation of Climate Models: An Essential Practice, Post-review Draft – Accepted for Publication, July 26, 2018.
To appear in: “Computer Simulation Validation – Fundamental Concepts, Methodological Frameworks, and Philosophical Perspectives”.
“Abstract
This chapter describes a structure for climate model verification and validation. The construction of models from components and sub-components is discussed, and the construction is related to verification and validation. In addition to quantitative measures of mean, bias, and variability, it is argued that physical consistency must be informed by correlative behavior that is related to underlying physical theory. The more qualitative attributes of validation are discussed. The consideration of these issues leads to the need for deliberative, expert evaluation as a part of the validation process. The narrative maintains a need for a written validation plan that describes the validation criteria and metrics and establishes the protocols for the essential deliberations. The validation plan, also, sets the foundations for independence, transparency, and objectivity. These values support both scientific methodology and integrity in the public forum.”
The book is on the Springer site: https://www.springer.com/us/book/9783319707655. And at Amazon.
I have not yet found an online ToC.
Also somewhat related:
C. Essex, A.A. Tsonis, Model falsifiability and climate slow modes,
Physica A (2018), https://doi.org/10.1016/j.physa.2018.02.090
“Abstract
The most advanced climate models are actually modified meteorological models attempting to capture climate in meteorological terms. This seems a straightforward matter of raw computing power applied to large enough sources of current data. Some believe that models have succeeded in capturing climate in this manner. But have they? This paper outlines difficulties with this picture that derive from the finite representation of our computers, and the fundamental unavailability of future data instead. It suggests that alternative windows onto the multi-decadal timescales are necessary in order to overcome the issues raised for practical problems of prediction.”
“Highlights
1. Climate models do not and cannot employ known physics fully. Thus, they are falsified, a priori.
2. Incomplete physics and the finite representation of computers can induce false instabilities.
3. Eliminating instability can lead to computational overstabilization or false stability.
4. Models on ultra-long timescales are dubiously stable. This is referred to as the “climate state.” Is it real?
5. Decadal variability is understandable in terms of a specific class of nonlinear dynamical systems.”
Unfortunately, the word “falsifiability” appears in the title and the Highlights, but that criterion, is not at all necessary; we need Verification and Validation, not falsifiability. Interestingly, the authors note that existence of slow modes in the physical domain are the only reason that the problem might be called a Boundary Value Problem. Frequently, when only the atmosphere is the focus, the CGMs/ESMs are run with the sea surface temperature specified; application of a quasi-static assumption relative to ocean response and feedback. Comparisons of applications with and without that assumption generally show different responses.
Well yes Dan there are various flavors of validation methodologies. That’s all well and good and as I understand it, these methodologies have some theoretical basis for steady state modeling with traditional turbulence models or structural analysis. Even in this case, I worry about underestimation of uncertainty caused by things like inadequate exploration of parameter space. For eddy resolving time accurate simulations, the theoretical foundation is much weaker at least in so far as I understand it. But I’m not an expert on these methodologies.
Above I was asking dpy6629 about the meaning of Isaac Held’s post showing that an AOGCM (run with observed SSTs) can do an extraordinarily good job of reproducing the large scale flow in the atmosphere (winds, jet streams) that develops from vertical transfer of heat by convection. Upward convection produces clouds and precipitation and must be accompanied by clear regions of subsidence. On the average, these areas likely have a moist adiabatic lapse rate (constant potential temperature). So AOGCMs might get many important features of our climate system right. Systematic errors not involving the climate feedback parameter (the change in radiative imbalance at the TOA with changing Ts) won’t prevent AOGCMs from producing the right climate sensitivity. Where are the weak points in this analysis?
Marine boundary layer (or stratocumulus) clouds are one phenomena that isn’t associated with large scale flow or strong vertical mixing that produces an average constant potential temperature with altitude. These clouds form where relatively warm dry air descends over oceans which are cooled by upwelling or cold currents. So I thought I’d ask how well weather forecast models deal with stratocumulus clouds. I came across this somewhat dated study showing the forecast skill of the ECMWF model over Europe in 2004 at 12 UTC. Even one day in the future, forecast skill, 1-(RMSE_forecast/RMSE_persistence), was only 15%. So even when you know a lot about an air mass, predicting whether marine boundary layer clouds will be present (all day or “burn-off”) is challenging.
Click to access 18106-improved-prediction-boundary-layer-clouds.pdf
The ECMWF has made significant progress, but still has some issues.
http://citeseerx.ist.psu.edu/viewdoc/download?doi=10.1.1.422.3973&rep=rep1&type=pdf
Since climate models aren’t initialized and don’t do any forecasting, their goal is merely to reproduce current climatology. Since marine boundary layer clouds are highly persistent in many locations at certain times of the year, AOGCMs can appear very accurate without being skillful by the measure used by forecasters: 1-(RMSE_forecast/RMSE_persistence). If we want to know how marine boundary layer clouds will be different on a planet that is 1 K or more warmer than today, merely reproducing current climatology probably isn’t enough. For forecasters, a change in parameterization can always address one narrow problem area. One challenging problem appears to addressing the change from nearly solid stratus to disruption caused by convection breaking through the inversion layer.
Indeed frank, low marine clouds are a challenge. I think you may be confusing Rossby waves and vertical convection. Held’s plots are for wind patterns at large scale. The problem here is that typically in CFD small scales do affect the larger scales. The average effects can be tuned using data but that tuning must be redone for any changes in energy fluxes. Given the terrible skill of models at predicting cloud fraction, they can’t be doing a good job with the small changes in energy flows.
The real problem here is that the energy flux changes are 2 orders less than total fluxes and less than truncation errors or sub grid model errors. There is a math theory for modeling subgrod scales developed by Tom Hughes at Texas and it is hard enough for simple
Arguments that “a miraculous cancellation of errors” takes place are very naive.
dpy6629: I think I understand atmospheric Rossby waves: Hopefully they are the north-south undulations in the jet stream. When I look at Held’s Figure 1, I don’t immediately see Rossby waves, but the seasonal average velocity will depend on where the Rossby waves have caused the jet stream to linger longest.
What I don’t understand and was hoping to learn is what I might conclude from the agreement in Figure 1. What processes can we deduce the model is “getting right” because it is getting the wind, and its seasonal changes, right? What makes the jet stream stronger in the winter and causes it to shift latitudinally toward the summer pole? Why at 200 mb? (The tropopause?) In the re-analysis section of the paper, Held says: “The multivariate nature of the interpolation is critical. As an important example, horizontal gradients in temperature are very closely tied to vertical gradients in the horizontal wind field (for large-scale flow outside of the deep tropics). It makes little sense to look for an optimal estimate of the wind field at some time and place without taking advantage of temperature data.”
Although I am uncertain what aspects of heat flow through the atmosphere are controlled by the large-scale flow, I’m fairly sure the marine boundary layer is not one of them.
Frank
I don’t agree with dpy points above. On average, the model is getting a wide range of atmospheric motions right. The jet stream is located over regions where temperature gradients in the lower atmosphere are largest. The model is responding to forcing and rotation to keep the thermal gradients and the jet stream located properly. Note that large-scale atmospheric motion is not turbulence. In turbulent motion, energy cascades to smaller and smaller scales. In large-scale atmospheric motion energy is exchanged over a range of scales with disturbances/waves growing in scale and then decaying/breaking.
This phrase is the key Frank: “(for large-scale flow outside of the deep tropics).” I think the equator to pole temperature gradient is strongly dependent on Rossby waves for example. The problem here is that vertical energy flows in the tropics have little to do with Rossby waves.
Chubbs: You will note that later in the post Frank is referencing Held makes an admission: “But you can also err on the side of uncritical acceptance of model results; this can result from being seduced by the beauty of the simulations and possibly by a prior research path that was built on utilizing model strengths and avoiding their weaknesses (speaking of myself here). ”
Also:”Note added June 10 in response to some e-mails. For those who have looked at the CMIP archives and seen bigger biases than described here, keep in mind that I am describing an AMIP simulation — with prescribed SSTs. The extratropical circulation will deteriorate depending on the pattern and amplitude of the SST biases that develop in a coupled model. Also this model has roughly 50km horizontal resolution, substantially finer than most of the atmospheric models in the CMIP archives. These biases often improve gradually with increasing resolution. And there are other fields that are more sensitive to the sub-grid scale closures for moist convection, especially in the tropics. I’ll try to discuss some of these eventually”
Held is well aware that the wind field is a strength of models. Tropical convection is a weakness and a pretty serious one for modeling small changes in energy flows which is what we care about in climate.
We know from 60 years of research on simpler CFD problems that there is little expectation that climate models will be skillful much less “accurate.” The more honest climate scientists know this.
dpy
Models do a reasonable job with OHC, so can’t agree with your energy concerns. You are misinterpreting Held. His blog is full of information gleaned from climate models. How does he do that? – by using simple and complex models and observations; and understanding the strengths and weaknesses of each tool.
Chubbs, I am quoting Held. You did not do that yourself. I’ve been in the field for 40 years and everyone in the field knows what Ive been saying here. It’s really well established. If you are interested, you could start with an introductory book on numerical solution of PDE’s.
And just because models are tuned (perhaps unconsciously) to replicate with reasonable skill the historical temperature time series doesn’t mean much. sI believe they are also tuned explicitly for TOA flux balance and probably for ocean heat uptake too.
I explained this above. Basically when the truncation and sub grid model errors are larger than the quantities you are interesting in, skill is due to tuning and cancellation of errors. That’s OK, but in a complex system like the climate system, that means many many other important measures are not very good. Regional climate, cloud fraction as a function of attitude, SST temperature patterns, etc. etc.
The CMIP5 models were run 10+ years ago and predicted OHC is still tracking the obs quite well. A simple back-of-the-envelop calculation shows that the energy accumulating in the climate system is massive; hard to see how random error could possibly have an impact. So without any supporting evidence your assertions re: energy aren’t very persuasive.
Chubbs, You are picking one integrated quantity and claiming its well modeled without evidence and without quantification of uncertainty. What’s the spread of the models? There must be short term errors because of poor cloud simulation. Are the models tuned for OHC? They are for TOA fluxes.
The problem here is that the distribution of the fluxes is also very important not just their average. Recall the “pattern of SST changes” argument over the last decade or so. Models fail to get that pattern right.
The main point is a mathematical one. The changes in the fluxes are 100 times smaller than the total fluxes. That’s smaller than the truncation errors in such models.
dpy6629: IIRC, Models show a 2-fold range for “diffusion” of heat into the deep ocean. High ocean heat uptake could negate some of the excess warming models with high climate sensitivity would be expected produce in historic experiments – but Nic Lewis assures me that some models with high ECS do not compensate with high ocean heat uptake. Some models show TCR/ECS ratios that are too small to be consistent with ARGO:
TCR/ECS = 1 – dW/dF
where dW is the current rate of ocean heat uptake and dF is the current forcing.
Sure there is scatter in OHC, just like there is scatter in another integrated property, ECS. Building on Frank comment the OHC/ECS scatter can be related directly to scatter in clouds and ocean mixing. So I don’t see any evidence to support your “flux/energy” concerns and you can’t supply any.
Chubbs, You should address my actual argument which is first principles numerical analysis fundamentals that everyone who’s actually done this type of modeling knows about. Meaningful skill can only be achieved as truncation errors get smaller so that numerical errors are less than the quantities you want to simulate skillfully. Richtmyer and Morton’s old but good book is a good place for you to start. But its a complex subject.
A lot of arguments over whether models are right or wrong are IMHO misplaced. If you think of climate science as an iceberg, the 10% above water, which everyone sees, are climate models. But there’s 90% below water that is made up of simple physical arguments and data.
The reason climate scientists are so confident in the main conclusions is not because of models, but because of simple physical arguments. Not to say models are not useful — they are, but mainly to validate our understanding.
E.g., we are confident in our understanding of the water vapor feedback not because models tell us it’s there, but because we have simple physical arguments and data. Models confirm our theories, giving us great confidence in in our understanding.
People not familiar with climate science don’t realize that 90% is there, so are overly dismissive of climate science. That is a mistake.
There is some truth in what you say here Andrew. But I think it gives a somewhat unbalanced picture and could lead to overconfidence.
What you call “simple physical arguments” are often vague verbal formulations without quantification. These give a false sense of understanding in CFD too. For example, we have “understood” aeronautical flutter for 50 years but this has close to zero practical value. Quantification is of course what is really needed.
Medicine is plagued by the same issue. It’s a complex system and individuals are quite variable. Medicine also has huge problems with selection bias and publication bias.
It seems to me that the fundamental problem in climate science is estimating sensitivity. On that issue little progress has been made. Not a good track record considering the billions invested. I don’t think climate models have really added much in terms of new understanding or quantification. Weather models by contrast have been very successful and there is a very good understanding of the uncertainties involved. But we are eventually going to hit the wall of chaos and better theory will be the only way to improve.
The problem in science generally is that the current soft money culture gives rise to a focus on computational studies which don’t really advance understanding. Climate science just as other fields of science have been complicit in generating a false sense of confidence in CFD generally that makes funding for fundamental work quite hard to find. This is causing a stagnation of these fields that is tragic. CFD simulation is a big business these days with hundreds of companies with products. They of course also benefit from echoing the academic selection bias driven dogma that CFD is a solved problem. So far, government regularity agencies have not been fooled which is very fortunate for the general public.
The recent recognition of the replication crisis does somewhat undermine the narrative scientists have an interest in propagating that science can be the basis for all human actions and decisions. There are fundamental theoretical limits to what science can achieve just as there are limits to axiomatic deductive systems. Denial of these problems and refusal to address them within your own field is not going to help anyone in the long term. Science needs to address the inherent biases and in some cases outright deception if it is going to continue to be looked to by the public as having high value. We make progress by being self-critical and admitting that real issues need to be addressed.
Andy writes: “If you think of climate science as an iceberg, the 10% above water, which everyone sees, are climate models. But there’s 90% below water that is made up of simple physical arguments and data.”
There is no doubt that doubling CO2 will slow the rate of radiative cooling to space, causing our planet to warm until it radiates or reflects an addition 3.5 W/m2. However, I don’t see any simple physics that will tell us whether our planet’s radiative imbalance changes by -1, -2, or -3 W/m2/K as it warms.
Yes, Planck feedback is -3.2 W/m2. Absolute humidity will rise, and the positive feedback from reduced radiative cooling will dominate negative lapse rate feedback. I see no reason to assume that relative humidity must remain constant at all altitudes. AFAIK, no simple physics explains the observed rate of decrease in relative humidity with altitude. (A lot has been written about amplified warming in the upper tropical troposphere, but whatever amplification exists clearly does not extend as high as models project – IMO.)
None of this simple physics tell me that -1 W/m2/K is the correct value. What other simple physical arguments have I missed?
Data? Scatter plots of monthly temperature and TOA flux anomalies are extremely noisy, explain little variance and systematically biased by the noise they contain (according to Spencer). You have shown that there is scatter in the data when temperature is measured higher in the atmosphere, but that simply means the lapse rate to the surface is noisy. The large changes associated with the seasonal cycle are much less noisy and simple to interpret. (Tsushima and Manabe, 2013) CERES observes and models predict LWR feedback of -2.2 W/m2/K through clear skies, but observations don’t show the positive cloud LWR feedback that models predict. Seasonal warming is mostly extra-tropical. In the tropics, both Mauritsen&Stevens (2015) and Lindzen&Choi (2010) report that LWR feedback is -4 or -5 W/m2/K in the tropics. DeWitt and Clerbaux (2018) report satellite data showing global LWR feedback of -2.9 W/m2/K. And it is clear to me, (and LIndzen and Spenser) that the monthly SWR response to surface warming involves at least some lag and shouldn’t be interpreted as simple feedback. The seasonal SWR response observed through clear skies likely involves melting of seasonal snow and sea ice, phenomena that that we expect to lag behind seasonal warming. Reflection of SWR by cloudy skies appears plagued by similar problems. AOGCMs do a poorly job – and mutually inconsistent job – of reproducing seasonal changes the emission of LWR from cloudy skies and reflection of SWR from clear and cloudy skies. Finally, we have EBMs.
Yes, simple theories for RH exist: https://journals.ametsoc.org/doi/10.1175/JCLI-D-14-00255.1
Note that, just because you don’t know something exists doesn’t mean it doesn’t.
So the simple ECS argument goes like this:
1) -3.2 W/m2/K for planck feedback
2) +1 W/m2/K for combined lapse rate + water vapor
3) +0.3 W/m2/K for albedo feedback (b/c we’re pretty confident that ice melts when it warms up)
that gets you to -1.9 W/m2/K, which is about 2 deg C for ECS. And we haven’t considered clouds. if clouds are overall positive, which seems likely, then ECS is > 2 deg C.
Here is a simple argument physical for why high clouds generate a positive response: https://agupubs.onlinelibrary.wiley.com/doi/full/10.1029/2010JD013817
I could go on, but I won’t. You need to realize that there’s a reason that just about everyone who studies this professionally accepts the mainstream view. It’s because the science is extremely robust. If you don’t view it that way, it’s probably because you’re not familiar with the literature.
A D: “The reason climate scientists are so confident in the main conclusions is not because of models, but because of simple physical arguments.”
I think that I have seen this “simple physics” argument before. But when these “simple physical explanations” shall catch up the real world, they tend to become very complicated.
Recent papers point to a positive feedback from tropical low clouds, making low sensitivity very unlikely. Here is an example:
https://www.atmos-chem-phys.net/19/2813/2019/
Chubbs: Thank you for the excellent reference. In the introduction, the authors write about the relationship between low cloud cover (LCC) and SST:
“This [approach] is based on the assumption that models must reproduce the LCC–SST relationship in the current climate as a necessary but not sufficient condition to have confidence in their ability to simulate a more realistic future climate change in regions dominated by low clouds, although there is no guarantee that current climate variability itself is indicative of longer-term climate changes”
AFAIK, LLC is produced by a COMBINATION of cold SST and subsiding air. The subsiding air is relatively dry and therefore warms more than usual because of its high lapse rate. So we have a cloud system that is not driven by SST alone, but is being analyzed in this paper as if it were. In convective regions, SSTs and the well-mixed troposphere above them respond in parallel ON A MONTLY TIME SCALE. During seasonal warming, the relationship between OLR observed by CERES and GMST is highly linear. In the case of LCC, subsiding air originates far from the cold ocean below. The relationship between reflected SWR and SST appears to have lags to me. Having lived in coastal California – where May can be relatively sunny and June perpetually shrouded by fog – I don’t believe that the MONTHLY changes in SST and LCC studied in this paper tell us anything reliable about what how LCC will change in response to GLOBAL warming. (A good AOGCM, however, should be able to reproduce both.) IMO, the passage I quoted simply expresses the same concept in more politically-correct terms.
IMO, the true test of a cloud parameterization scheme is whether it is able to FORECAST LCC. Unfortunately, even today’s weather forecast models have trouble reproducing LCC, and determining when a persistent stratus layer will break up. When initialized with current SSTs and the state of subsiding air above them, can an AOGCM correctly forecast LCC for the next few days: when in the morning (if ever) low clouds will “burn off”, when (if ever) radiative cooling later in the day will cause them to reform, and where convection will break through the inversion and disrupt a solid stratus layer. Until modelers are proud to show how well their AOGCMs can forecast changes in weather – rather than merely reproduce today’s climatology – skepticism is a viable position. When the parameterization scheme in AOGCMs can forecast changing LCC for the next few days and reproduce current climatology, dpy6629 may still be saying their CFD is wrong, but I expect to say those models are useful. By the time this happens, I may be too old to assimilate new information that contradicts my current skepticism, but that may already be the case. I do appreciate the links you provide.
Chubbs, I read a little of your reference and its another in a long series where you look at some output function from models and compare to observations. Often the claim is that those models that match on this single measure best must be “more accurate” even though in this paper I didn’t see that claim. This method is an invitation to bias of course because there are millions of such output functionals. Even at that the paper supports my earlier comments about cancellation of errors.
“Finally, a region-based evaluation of the GISS-E3 model suggests that producing realistic global ΔCF, ΔLCC and ΔCRE may be the result of compensating errors between the Sc-dominated and Cu-dominated regions. However, it is difficult to determine with certainty whether the model is biased or not as we discriminate these cloud types by regions and not by actual type with the method used in this study. Future work will focus on developing a method to discriminate stratocumulus from trade cumulus clouds in satellite-based observations. By doing so, we will be able to assess the spatial distributions of these clouds and to evaluate the models more precisely. In addition, refining the contribution of additional cloud-controlling factors may advance our understanding of physical processes driving the change in cloud fraction in response to a warming climate.”
It’s pretty weak evidence when it comes to ECS in my opinion and just scratches the surface in terms of skill with respect to clouds.
Here is another one for you to discount. Varying key cloud, precipitation and convection parameters changed the model climate but didn’t have much impact on the cloud feedback or ECS.
https://agupubs.onlinelibrary.wiley.com/doi/10.1029/2018JD029189
Chubbs, Did you actually read my comment? Your response indicates that you didn’t get it. What I quoted is actually a good start down the long road to a more mature climate science and I thought was more honest than usual. Focusing on global averages of a few quantities is really superficial and leads to errors. As all fluid dynamicists know, the patterns of quantities like vorticity or forcing is critical to being able to predict more than a few global quantities by tuning. Even EBM’s require forcing estimates to have a chance. Those forcing efficiencies depend on the distributions of forcings and feedbacks.
Just to repeat, when the problems are really hard, such as in medicine or climate or even aeronautical CFD (where the problems are dramatically simplified), people tend to latch onto verbal formulations that don’t really have much quantification and call that “understand the physics.” It is entirely equivalent to the way theological explanations worked in the Middle Ages. This tactic is also used by salesmen to fool non-experts (or even naive experts) into thinking that a colorful fluid dynamics simulation is wonderful and accurate. You recite a bunch of observations about interactions of shocks, shear layers, vortices, topological features etc. etc. and claim some causal relationships. Maybe you show that the the lift and drag show the “right” trends. Just the weight of the verbiage and the moving color pictures can be persuasive to even many users of the codes. The problem here is that as research becomes more focused on running the code, and the dogma that CFD is a solved problem becomes more entrenched, there arises a professional class of code runners whose livelihood depends on ignoring deeper questions of skill and quantification. And of course, real science doesn’t get done.
Sure I read your comment, you are not presenting evidence to back up your claims. Meanwhile evidence continues to mount that EBM can be discounted: 1) Global temperatures and OHC continue to rise rapidly, faster than EBM predict 2) Recent studies have identified limitations in EBM, 3) Wide range of Paleo obs do not support low sensitivity, 4) Measurements indicate that cloud feedback is positive, both high and low clouds in the tropics have positive feedback (recent review study on tropical low-clouds linked below). 5) Models are uncertain yes, but there is no indication of bias, the better performing models do not have low sensitivity.
https://link.springer.com/article/10.1007%2Fs10712-017-9433-3
Chubbs, you are dodging. I presented evidence from your cited paper to back up my claims made long before you posted the link. Just because its simple numerical analysis doesn’t mean there is no evidence. You may be ignorant of it, but that means nothing. Richtymer and Morten is a good place to start. It’s pretty elementary.
Per your quote, the supposedly “biased” climate scientists are acknowledging the possibility of compensating errors to explain good model performance. You are dodging the main paper findings: 1) low cloud feedback in the tropics is positive and 2) many models underestimate the feedback.
Chubbs, I don’t think the conclusion of your paper is very strong but I don’t discount the work either. It’s interesting. You don’t seem to understand the underlying mathematics of numerical solution of PDE’s. When there are large errors, getting them to cancel for a few output functions doesn’t mean much and calls into question other important measures of skill (or lack thereof as the case may be).
Unlike you, I’m not so confident (in this case over confident) as to think I know what ECS really is. It’s probably not even unique. What I know is that climate models don’t offer strong evidence.
Figure 3 from the paper shows that increasing SST leads to a decrease in low-cloud and an increase in high-cloud coverage in the tropics; i.e., positive cloud feedback. No wonder global temperatures spike whenever trade winds relax. You don’t need a climate model to see which way the wind is blowing.
Andrew says:
One place that is very plain to see is in the patterns of the equatorial stratosphere, which is an indicator of climate behavior elsewhere on earth, for example wrt polar vortices.
In the upper stratosphere, simple physical arguments relating to solar tidal cycles explain the semi-annual oscillation (SAO) in wind direction.
Below the SAO in altitude, the direction transitions to a quasi-biennial oscillation (QBO) which aligns precisely with solar + lunar tidal cycles.
These patterns are explained with fundamental physical arguments that are also conducive to simple mathematical modeling based on topological constraints.
geoenergymath: If the QBO is the result of simple large-scale physics, why couldn’t AOGCMs reproduce this phenomena until recently, when the stratosphere was represented by thinner grid cells?
Are there any lessons here for those with no practical experience. Take the boundary layer (up to 850? hPa or 1.5? km) for example. How many layers are needed to describe important phenomena there? I’ve quoted some info from the paper Chubbs cited above, which I’ve been curious about:
“We use the GCM-Oriented CALIPSO Cloud Product (CALIPSO-GOCCP) version 2.9 (Cesana et al., 2016) for the LCC and the cloud fraction from 2007 to 2016 over a 2.5∘ grid and for 40 levels with 480 m spacing from 0 to 19.2 km.) Three layers?
“The first one is the GISS-E2 model that was used for the Coupled Model Intercomparison Project Phase 5 (CMIP5) (Schmidt et al., 2014). The second one is a developmental version of the GISS-E3 model that will be submitted to CMIP6 E2 uses a 40-layer vertical grid, whereas these E3 runs use 62 levels with the greatest refinement in the lower atmosphere: at the surface and at 850 hPa pressure, nominal layer thicknesses for E2 are respectively 20 and 35 hPa, and for the 62-layer grid they are 10 and 20 hPa”. About 6 and 10 layers?
“Turbulence. The E2 scheme (Yao and Cheng, 2012), which includes nonlocal transport and does not consider moist processes???”
Was GISS-E2 suitable for predicting how many Gtons of fossil fuel we can afford to burn before unacceptable warming occurs? Without discussing these caveats?
That’s easy to deduce. The previously accepted model of QBO was primarily developed by Richard Lindzen, of whom Pierrehumbert has said:
So essentially any atmospheric climate models built on Lindzen’s formulation have been going down a dead end. And now that Lindzen has effectively retired and no longer a factor in peer-review, it’s probably a good time to readdress any shortcomings and clean up the models. The first step would be to make sure the tidal forcing is included correctly and address the topological constraints along the equator applying the recent insight of Delplace, Marston, Venaille (2017).
Andy: Thank you the kind reply and link to Romps’ paper on relative humidity. I do the same basic calculation as you to get -1.9 W/m2/K as the climate feedback parameter before cloud feedback. (Except, in my case, I “pray” that positive surface albedo feedback is as small as models predict, because I don’t know what places an upper limit on this feedback.) So we both agree on the big picture. And I fully understand the reason why the highest tropical cloud tops are expected to warm much slower (if at all) than SSTs rise below – over a small fraction of the planet.
However, I add other information to this simple picture. During seasonal warming, AOGCMs predict a positive cloud LWR feedback that is not observed by CERES. Since seasonal changes involve large changes in flux and temperature, this discrepancy is unambiguous. The same bias could be creating positive cloud LWR feedback during global warming that doesn’t exist. (Feedbacks observed during seasonal warming presumably are mostly extratropical and biased by hemispheric asymmetry, but a valid AOGCM should be able to deal with these problems.)
Above I cited observational evidence of -4 and -5 W/m2/K for LWR feedback in the tropics and -2.9 W/m2/K globally according to the 30-year satellite record. The former are based on monthly temperature and flux anomalies (which are notoriously noisy) and presumably mostly driven by El Nino (which is not “global warming”). The latter covers about 0.5 K of observed global warming and 1.5 W/m2 of increased radiative cooling to space. So, either: a) cloud LWR feedback is negative in the tropics (despite likely being positive for the highest cloud tops), or b) combined WV+LR feedback is not +1 W/m2/K in the tropics or c) something is wrong with the observations I cite.
Therefore, strongly positive cloud SWR feedback is likely needed to obtain climate sensitivities of 3 K/doubling or greater. In the iris effect of Mauritsen and Stevens, negative LWR cloud feedback is mechanistically linked to positive SWR cloud feedback. Seasonal (monthly) change in reflected SWR – unlike seasonal changes in emitted LWR – is not a simple linear function temperature. Both Lindzen and Spenser assert a modestly stronger correlation between reflected SWR and temperature lagged by three months, converting positive feedback into negative feedback. Marine boundary layer clouds are created by SSTs cooled by imported cold water (upwelling and currents) and imported dry subsiding air. Monthly anomalies in local SST and flux seem unlikely to predict how these clouds will change in response to global warming.
Therefore, the simple picture we both agree upon isn’t enough to tell me whether AOGCMs or EBMs are correct about climate sensitivity. Unfortunately, it is human nature (confirmation bias) to focus on information that agrees with our preconceptions and fail to assimilate information that contradicts them. Perhaps I’m missing something important about the evidence I cited.
I thoroughly enjoyed Romps’ analysis of how entrainment and detrainment produce relative humidity at all altitudes that depends on the local temperature and is independent of a 30 K increase in SST. However, as best I can tell, the issue then becomes whether entrainment and detrainment remain constant with global warming. CRMs (Figure 7) show a minimum RH of 65% at the altitude where temperature is about 260 K. Figure 1 shows this agrees with observations for the tropics as a whole (70% minimum at 260 K) but certainly not for the Indo-Pacific Warm Pool (35% RH at 260 K).
Frank, I get where you are coming from but I don’t have as much confidence in the “simple theory” of the tropics. In Maritsen and Stevens, there are actually 2 feedbacks that almost cancel leaving a small negative feedback due to the iris effect. That tells me that the size of the iris effect is quite uncertain. (If you have a =5 +_1 and b = -4 +-1, then a+b=1 +-2. It’s simple math. The clouds trains Lindzen hypothesizes are hard to detect observationally.
I further think more needs to be done on tropical convection. Thunderstorms are not adiabatic. Further many of the effects are quite subtle. Simple theory may be right to 1st order in the total flux, leaving it +-100% for small changes in fluxes. It’s just simple math.
Generally “simple theory” doesn’t have very tight quantification. I’m biased from 40 years of hearing hundreds of “simple theory” explanations for why certain flows behave the way they do. Most of this is just the explainer trying to convince someone else he knows what he is talking about. This is obvious as soon as you get another opinion that is equally vague but disagrees with the first. This is true in climate science except that there is much stronger consensus enforcement that tries to exclude inconvenient but plausible ideas. The iris hypothesis was an example of that.
Don’t get me wrong. Boundary layer theory is a relatively simple theory that is quite good in many cases of interest. But its 100 years old and has seen massive development and refinement and hundreds of comparisons with careful and good data sets. Climate science strikes me as a lot less mature not to mention that boundary layer theory was developed for much much simpler flows.
D. Henry and C. I. Martin (2019), Exact, Free-Surface Equatorial Flows with General Stratification in Spherical Coordinates, Archive for Rational Mechanics and Analysis, Vol. 233, pp. 497–512.
See also D Henry and A Constantin
Here’s the Henry and Martin Abstract:
Abstract
This paper is concerned with the construction of a new exact solution to the geophysical fluid dynamics governing equations for inviscid and incompressible fluid in the equatorial region. This solution represents a steady purely-azimuthal flow with a free-surface. The novel aspect of the solution we derive is that the flow it prescribes accommodates a general fluid stratification: the density may vary both with depth, and with latitude. The solution is presented in the terms of spherical coordinates, hence at no stage do we invoke approximations by way of simplifying the geometry in the governing equations. Following the construction of our explicit solution, we employ functional analytic considerations to prove that the pressure at the free-surface defines implicitly the shape of the free-surface distortion in a unique way, exhibiting also the expected monotonicity properties. Finally, using a short-wavelength stability analysis we prove that certain flows defined by our exact solution are stable for a specific choice of the density distribution.
Interesting discussions on this post.
First, regarding SOD’s musing:
“Surely the patterns of warming and cooling, the patterns of rainfall, of storms matter hugely for calculating the future climate with more CO2. Yet climate models vary greatly from each other even on large regional scales.”
I believe it’s time for modelers to rigorously validate the climate models in similar fashion to how weather models are evaluated … based on performance in representing the real world. I would suggest using running averages for 5, 10, 15, 20, and 30 year periods for evaluation and validation, with updates and evaluations every year for the corresponding periods through the latest year. I would also expect that all important parameters would be covered on regional and global scales. By using a range of periods, newer models can be compared to older models using the first available 5-year reference period. Over time, more models will be comparable over more time scales. This approach should be used to weed out the poorest performing models and to evaluate attempted improvements over time. Perhaps this is already being done, at least to some extent, but since I haven’t been trying to follow the literature I’m not at all sure.
I have watched weather models evolve tremendously since I first began looking at weather data and forecast output my first year of college in the fall of 1970, from NOAA Service A and C teletype and weather facsimile products. Back in those days the early weather models were quite crude, much more so than climate models today, but they were still useful. I still like to follow the latest weather models and some of them like the HRRR and NAM 3km and 12km are now attempting to model convective showers and thunderstorms, although not very well from what I have seen lately. We are getting convective storms here in Central Texas today and none of the models forecast them to arrive near as early as they did.
Second, regarding aerosols:
My experience in working with atmospheric particulate matter measurements, forecasting, and remote sensing over decades now has led me to view clouds and aerosols as being strongly connected. Many atmospheric particles are hygroscopic and loose or gain water as relative humidity decreases or increases and at the high end of relative humidity the particles begin containing more water than anything else by mass. The changing amount of water in the hygroscopic particles changes their light absorption/reflection properties. Ultimately I think climate models to be successful will need to include aerosols.
From my present perspective, which is ever changing as I learn new things, I see water in its various forms (gas, liquid, solid) as far and away the primary driver for climate *change* over scales from decades out to centuries and perhaps a few thousand years. At present I would subjectively rank aerosols second and CO2 third, followed by variations in annual incoming solar radiation, for climate change influence in the decades to centuries time scales.
I’m not sure what to think about the influence of vegetative changes since I’ve read satellite imagery has indicated increasing coverage and density of vegetative cover on average across the globe over the last couple of decades in association with increasing CO2 (which could be a major factor for this increase). This trend will decrease albedo with clear sky conditions, but the net result might be counter-intuitive because of soil water retention and plant transpiration effects on local relative humidity and thus temperature, cloud cover, and even rainfall.
Pattern effects indeed.
oz4caster: AR5 WG1 has a 50+ page chapter on “near term climate change”. Here is what they say in the SPM:
“The global mean surface temperature change for the period 2016–2035 relative to 1986–2005 will likely be in the range of 0.3°C to 0.7°C (medium con dence). This assessment is based on multiple lines of evidence and assumes there will be no major volcanic eruptions or secular changes in total solar irradiance. Relative to natural internal variability, near-term increases in seasonal mean and annual mean temperatures are expected to be larger in the tropics and subtropics than in mid-latitudes (high confidence). {11.3}”
The IPCC didn’t use their standard method of “model democracy” when making this projection, as they do for 2100. Instead they weighted models by how well they had performed in the past decades that included the Pause.
The IPCC has good reasons for not making the projections you suggest over the next 5, 10, or 15 years. According to Figure 11.8, internal variability (aka “unforced variability) is responsible for about 50% of the variance in predictions for the next decade. Given that a strong El Nino can raise temperature 0.3 K in six months, would you want to make forecasts for the next decade? By 2035, internal variability is predicted to only contribute 20% of the variance in projections.
Frank, thanks for the info. I must admit that I have not read much of any of the IPCC reports, although I have read quite a bit of what others have to say about them, including supporters and detractors.
You say:
“Instead they weighted models by how well they had performed in the past decades that included the Pause.”
Did the modelers include “hindcasting” for that evaluation period or was it based purely on forecasting from runs made before the evaluation period? If it included hindcasting, that is not a proper validation in my mind (although it is better than no evaluation).
I agree that 5 years is a very short time for a proper evaluation. However, by making the evaluations every year for the latest 5-year period (and likewise for 10, 15, and 20 year periods), new models and adjustments to older models can be tentatively evaluated without having to wait 30 years or more. At some point perhaps the models will even start to show some skill for 5 years! In fact lack of skill at 5 to 10 years to me is not a good sign for confidence in longer projections and is part of the reason I have trouble putting any faith in the longer projections.
Besides, since I will be turning 67 this year, I will be very lucky if I am alive and coherent 30 years from now. 🙂
I think talk of validating/invalidating models is premature. In the 21st century there was a prolonged period of intensified trade winds. Those winds have been slumbering as of late. For how long? Who knows? Say it’s 6 more years? What if the come back by July? The whole discussion would be flipped on its head in either direction. The MetOffice has a decadal prediction model. Given the difficulty, I think it’s done okay, but people with nothing but wild guesses have done better. Like me.
oz4caster wrote: “I must admit that I have not read much of any of the IPCC reports, although I have read quite a bit of what others have to say about them, including supporters and detractors.’
The IPCC’s reports are the first place everyone should seek authoritative information on any aspect of climate change. Steven Schneider once defined ethical science as the truth, the whole truth and nothing but the truth, with all of the ifs, ands, buts and caveats. The IPCC’s Summaries for Policymakers are based on the results of scientific publications that are supposed to meet these rigorous standards, but given that the SPMs must be unanimously approved by more than 100 political appointees – they so not include any caveats or controversies that are essential (IMO) to “ethical science”. However, every conclusion in the SPMs has a link to the section of the full report that discusses the reasons for that conclusion more thoroughly and cites the primary literature.
When I thought you were poorly informed about some aspects of the IPCCs forecasts, I started to write some things I had “learned” from blogs, but decided not to open my mouth until I confirmed what I thought I knew. About half of what I would have written turned out to be flawed – even though I clearly understood the problem with your suggestion for model validation
oz4caster wrote: “Did the modelers include “hindcasting” for that evaluation period or was it based purely on forecasting from runs made before the evaluation period? If it included hindcasting, that is not a proper validation in my mind (although it is better than no evaluation).
The IPCC projected warming for 2016-2035 with weighting and the warming for 2100 without weighting. These projections are therefore modestly different during the early years. (One of many missing caveats.) I suspect the authors of AR5 were forced to deal with the reality that there had been negligible warming for more than a decade and that most models would be starting the 2016-2035 period with temperatures that were too low. So they decided to “cheat” by weighting short-term projections and not long-term ones – not knowing that the recent El Nino would almost immediately compensate for the Pause before the 2016-2035 period even started: Least-squares fits show trends for the last 4 decades and the subperiods before and after 1998 or 2001 are nearly identical, but the 2001-2012 warming rate is near zero. AR5 was written before the Pause ended.
Isaac Held candidly discusses some aspect of the issue of tuning and validation in his last post. He states the problem differently:
“A question that gets a lot of attention is whether you should try to tune your model to be consistent with the evolution of global mean temperatures (GMT) over the past century, or if you should withhold that particular iconic data set during model development, justifying its use as a measure of model quality.”
https://www.gfdl.noaa.gov/blog_held/73-tuning-to-the-global-mean-temperature-record/#more-43597
I conclude that hindcast warming can’t be used for validation and that most modelers place little faith in this measure.
For a more critical view of “tuning” models are then using them for detection and attribution see Lorenz (1991), p445 in the conference proceedings linked below. The last two pages are the clearest explanation of the problem chaos and tuning poses to detection and attribution.
https://inis.iaea.org/collection/NCLCollectionStore/_Public/24/049/24049764.pdf?r=1&r=1.
Frank, thanks for your detailed response. I will check out the links. I express my opinions here from time to time, but I am primarily here to learn. I find many of the comments here to be helpful in that regard, including yours.
Change = change in place + change due to motion.
Motion is chaotic ( infinite number of mathematically valid outcomes ) and not predictable.
Global radiative forcing doesn’t depend too much on motion, so warming is predictable.
Patterns of warming ( and precipitation and storms, and wind and weather, and so, climate ) do very much depend on motion, so the patterns are not predictable.
Turbulent Eddy said:
Sure, if one is mathematically challenged, lots of stuff is unpredictable.
Dear SoD ( and others) ,
I have no knowledge with climate models/ modelling. My points is not to discuss the algorithms themselves, the hidden uncertainties or the predictability performances.
I have some basics questions regarding their SW developments:
a) Are the climate models developers following some SW development standards ( in term of documentation , coding rules) ? Or is it wild wild west ?
b) How is assessed the quality of the code ? With usual SW tools ? ( cyclomatic , etc etc )
c) Are they developed and tested by Sw engineer based on specification? or it is done directly by the scientists ( phD , trainee, student …) ?
d) I just read the following article : https://www.sciencemag.org/news/2019/04/new-climate-models-predict-warming-surge
Were you aware of that ? ( I guess yes …)
I find it scary if the most important parameter ( climate sensitivity) shifts out of the previous “very likely” confidence interval without any understanding of the climate scientists …
Thanks for your attention
Ben, When I was in graduate school NCAR rolled their own weather software. This was I think pre Hansen’s mistaken idea to use these models for climate. They had a few mathematicians/numerical analysts that did the math libraries and helped with execution speed on the CRAY computers and corrected obvious errors in algorithm choices.
The best CFD codes still are done this way, i.e., with the scientists and mathematicians doing most of it by hand. Libraries like PETSC have gotten a lot better though so more of the low level stuff is canned so to speak.
However, I have no recent experience in regards to the climate models. I do know many of the groups have IT people on them.
Some academics are now starting to sell the idea of object oriented programming and plug and play modules/models. This is OK for loosely coupling methodologies (which are uncertainty generation machines) but is much harder for strongly coupled codes using Newton’s method for example.
The real problems in CFD are not related to software or programming methodologies. It’s a distraction. The uncertainties are still large (very large in more challenging cases) and even control of numerical errors is mostly not done except through “tuning” the grid. This results in large variations such as you see in the CMIP model inter comparison efforts.
The IPCC understates the uncertainty probably by a lot. Climate models are not independent and there is no reason to suppose they are normally distributed. A better estimate would be to vary all the parameters (and there are hundreds maybe thousands) and see what the range is with values over a range of physically reasonable values. The problem is that many of these parameters are not well constrained by data.
Current trends:
10-year warming trend – .36 ℃ per decade
15-year warming trend – .26 ℃ per decade
20-year warming trend – .22 ℃ per decade
25-year warming trend – .20 ℃ per decade
30-year warming trend – .20 ℃ per decade
This despite a hiatus in warming that took up a fair percentage of that 30-year period, and some humdinger La Niña events. It is the Eastern Pacific, and it gives better than it gets. La Niña and hiatus got rocked.
So tell me why it can’t keep trending up?
JCH: If you did the same calculations at the beginning of 2013, you would have concluded that the warming trend was slowing. Robust finding shouldn’t depend on the starting date.
Try the trend viewer at Nick Stokes blog and report the 95% confidence intervals he provides (which are corrected for autocorrelation). All of the values you report about are likely indistinguishable from each other at the 95% confidence interval. For example, for Hadley CRUTemp4 global, I find:
2/2009 to 2/2019: 0.26 +/- 0.24 K/decade
2/1999 to 2/2019: 0.16 +/- 0.06 K/decade
2/1989 to 2/2019: 0.17 +/- 0.04 K/decade
2/1979 to 2/2019: 0.17 +/- 0.02 K/decade
2/1999 to 2/2009: 0.14 +/- 0.12 K/decade
1/2001 to 1/2013: -0.02 +/- 0.09 K/decade (cherry-picked)
Warming trends over a decade are usually meaningless because the confidence interval is nearly +/-100% of the trend. Warming trends for two decades are marginally useful with a confidence interval approaching +/-50% of the trend. A warming trend over three decade is worth discussion with a confidence interval of about +/-25% of the trend. However, if you are go back three decades, why not four?
Why not five or six decades? Ignoring volcanos, the rate of forcing increase conveniently has been steady at about 0.4 W/m2/decade for the last four decades but significantly less before then.
About 5% of trends are expected to lie outside the 95% confidence interval. If you cherry-pick, one can find what appears to be a “statistically significant” change in trend during the Pause. Is the Pause real or consistent with expectations based on noise and trends observed for the last 40 years? (That is a close call.)
If you wish to demonstrate acceleration in warming, you need to do a fit to a quadratic equation and look at the confidence interval around the coefficient for the quadratic term. If the interval includes zero, acceleration isn’t statistically significant.
I’m not going to go look ’cause I have total confidence Frank pointed out many times the warming trends during the PAWS were meaningless.
It’s the pattern effect. The PAWS took place during period when there were anomalously strong trades across Niño 3.4. That situation reversed in 2014. So we’ll see how long that reversal lasts. Until the intensified trades come back, if ever, La Niña will be anemic. Perhaps El Niño as well, though OHC keeps bouncing right back; latest 1/4 due out soon.
Ben: There is a chapter in AR4 titled “Climate Models and Their Evaluation”
Click to access ar4-wg1-chapter8.pdf
Evaluation turns out to be mostly comparing one model to another, which is far easier to do than comparing with problematic observations of a single “realization” of a chaotic system whose course that can be changed by one butterfly. Observations are “reanalyzed” by processing raw data through a climate model to provide the same kind of data for each grid cell that AOGCMs produce.
The most important tool climate scientists have for influencing policy is models, and (IMO) they don’t want to discuss “validation” and raise the issue of whether climate models are valid. Macro-economists may have similar problems with their models.
Judy Curry discusses part of her journey to skepticism at her blog as she learns about how different disciplines do model validation. The first three posted found by searching for “validation” might be useful.
https://judithcurry.com/?s=validation
Frank ,
Thanks a lot !! It was exactly the kind of discussions I was looking for …
And it confirms my doubt and fears …. It is not “pure” distraction ! It is fundamental … I personally don’t care if the equations are correct or not . Because if they are incorrectly implemented , it does not matters … And the V&V process and all the SW development process is there to verify this crucial point …
Who would take a plane by knowing that the Plane SW has not been systematically and thoughtfully verified and validated by applying the standard rules of SW development … Nobody …. ( Just think about the disaster of B737 Max … despite the strict and professional application of the rules of development by Boeing engineers ) .
Here some strategic decisions for our civilization seem to be taken based on models which are simply not verified .. How people can then claim they are “reliable”. It is a pure non sens ..
BenHague asks: “Who would take a plane by knowing that the Plane SW has not been systematically and thoughtfully verified and validated by applying the standard rules of SW development … Nobody …. Just think about the disaster of B737 Max?”
Unfortunately, no one has to fly on a B737 Max or any other plane. We are, however, “flying” through space on this planet where we are conducting an experiment with increasing GHGs. Skipping that flight isn’t an option.
There is a lot to be learned without placing any faith in AOGCMs. There is no scientific doubt that rising GHGs slow down the rate at which the planet radiates heat to space. Conservation of energy demands that resulting radiative imbalance will cause warming until a new steady state is reached. And simple energy balance models (used by Lewis and Curry, Otto (2013) and others. We can detect the influence of water vapor and cloud feedbacks associated with annual seasonal warming.
IMO, the most dubious decisions was a purely political one to set arbitrary goals of limiting total warming to 1.5 or 2.0 degC, when the 1 degC of warming we have already experienced has been net beneficial. However, we probably haven’t experienced anything close to the full amount of SLR that is likely to accompany 1 degC of warming.
Frank, you say:
“IMO, the most dubious decisions was a purely political one to set arbitrary goals of limiting total warming to 1.5 or 2.0 degC, when the 1 degC of warming we have already experienced has been net beneficial.”
Another consideration is that the projections of a further warming of 1-2 degC

over the next 100 years assume the earth would otherwise be steady state, except for warming associated primarily with increasing CO2 plus possible positive feedbacks. However, proxie temperature estimates from Greenland ice cores suggest that northern hemisphere temperatures have been declining for over 8,000 years and hint at an acceleration of that general decline during the last 4,000 years:
Such a decrease would be consistent with declining summer high latitude northern hemisphere incoming solar radiation from changing obliquity and might contribute a general decrease of about 0.2 degC per century on average over the next millennium. This effect is still small compared to potential CO2 effects, but would also have associated feedback impacts that might be negative.
The ice core proxy temperature estimates also hint at approximate century scale oscillations on the order of 1 degC that might be primarily driven by ocean circulation and related feedback mechanisms.

These ocean related effects could be very significant over the next century. Our climate models are not likely to be able to account for these effects, which could potentially be significantly negative over the next 100 years. It is possible that much of the 1 degC increase over the last 100 years is from ocean related effects, in which case earth could be facing a similar decline in temperature from these effects over the next 100 or so years.
Thus, it is possible that the net climate change over the next 100 years may be rather flat or there might even be a slight decrease in global average surface temperature. I suspect this scenario is most likely and my speculation is probably just as valid as any model based speculation (extremely low confidence).
ozrcaster, Interesting plots. The difference between Antartica and Greenland is interesting. Because of polar amplification, its probably better to either scale the Hadcrut by a factor of 2 or divide the ice core temps by a factor of 2 to make a more apples to apples comparison.
dpy6629, you say:
“Because of polar amplification, its probably better to either scale the Hadcrut by a factor of 2 or divide the ice core temps by a factor of 2 to make a more apples to apples comparison.”
From what I recall in making these graphs back in 2014, the ice core proxies were already adjusted to simulate global average temperatures, but I’m not certain. I found it interesting that without any adjustment the average of two Greenland and two Antarctica ice core proxie temperature estimates came very close to matching HadCRUT4 in 1850. Perhaps this match is more than coincidental. I suppose it is possible in adjusting the proxie temperatures to estimate a global temperature they may have used HadCRUT4 as a reference.
I posted about the graph derivations here.
oz4caster: There are multiple problems drawing inferences from the Greenland ice core record. 1) As dpy6629 notes, warming is amplified in the Arctic compared with the globe as a whole. 2) The warming recorded in Greenland ice cores may be regional in extent, or perhaps hemispheric warming. The signals for the MWP, RWP and Minoan Warm Periods are not seen in Antarctic ice cores. IMO, the best proxy for global warming is a composite of ocean sediment cores from around the world. These sediment cores had clearly defined alternating glacial and interglacial period (Marine Isotope Stages) long before any ice cores were drilled. (Ignoring the discredited record for the 20th century, Marcott’s composite of ocean sediment cores show only a gradual cooling since the Holocene Climate Optimum and no evidence for the global warm periods associated with the warm periods in Greenland ice cores. 3) Greenland’s regional climate appears to be relatively unstable compare with the rest of the planet: D-O events during ice ages, the Younger Dryas, change that would likely accompany a change in the MOC/Gulf Stream. Though many will vehemently disagree with me, IMO the Holocene proxy record suggests that unforced and/or natural-forced climate variability won’t have a significant impact if the central estimate of ECS from AOGCMs is correct.
Frank, you say:
“There are multiple problems drawing inferences from the Greenland ice core record.”
And I agree on all of your points. That is why I combined two Greenland and two Antarctic temperature anomaly proxies, first separately in one graph and then averaged together with the standard deviation in a different graph. I recognize that this approach may not simulate the global temperature anomalies all that well, but I’m not convinced that any temperature proxies are all that accurate to begin with. However I do think they can give us some general information. My guess is that the Greenland temperature proxies are higher than the Antarctic for the first several thousand years of the Holocene simply because that is when incoming solar radiation at the top of the atmosphere in the Northern Hemisphere summer was the highest and it has since been dropping because of shifting obliquity. It would be interesting to include some tropical and temperate zone ocean sediment proxie temperature anomalies in the mix for deriving a global composite proxie, but I have not seen any such data with near as high a temporal resolution as the ice core proxies for the Holocene.
The graph below compares recent daily average reanalysis (CDAS/CFSR) zonal Arctic and Antarctic surface air (2m) temperature anomalies with global and hemispheric temperature anomalies:

As you can see the polar anomalies are much larger in magnitude than the global anomalies, as you alluded, although this graph is on a daily scale which will produce larger variations than monthly or annual anomalies. I have not tried averaging the polar anomalies to see how the result compares to the global average. In recent years the daily polar anomalies are generally low in the summer season for both poles, but the winter season has high anomalies in the Arctic but low anomalies in the Antarctic. Thus the average of the polar anomalies would probably look somewhat sinusoidal using daily anomalies. Annual averages would remove that seasonal pattern. Of course the entire period of this graph would not be resolved in the ice core proxie records that typically resolve no better than a decade or two, depending on snowfall rates at a given site. I’m not sure we have long enough temperature records yet in the polar regions to get a better understanding of how well the ice core proxies relate to actual temperature anomalies. I’m guessing that might take a few centuries and by then all the CO2 fuss today will be old news.
Emotions aside.
The issues here are very well known to anyone with experience in CFD or even solution of PDE’s in other fields. There is plenty of documentation of it in the literature if you look for it, as the paper Chubbs linked to shows. SOD’s post here provides a mountain of evidence. But you need to do more than vent on blogs to gain the knowledge to understand it.
dpy6629 said:
Confession accepted.
A mountain of evidence for what?
They are always searching for evidence of chaos. A chaotic model is only justified if one can exclude all the other possible behaviors that may be admittedly complex yet are not chaotic. For example, take the example of the tropical instability waves (TIW) along the equator. This was an interesting topic at the last AGU. TIW are probably not chaotic because they are always 1100 kilometer in wavelength with a period of around 30 days. These are likely higher wavenumber standing/traveling wave modes of ENSO, which is also likely not chaotic.
Recently Judith Curry posted a Der Spiegel interview with Bjorn Stevens; he is, in my opinion, an honest and highly qualified scientist. He is with the Max Planck Institute for Meteorology and his specialty has been clouds. In the interview he states his frustration that while the computational power of computers has risen many millions of dollars, the prediction of global warming is as imprecise as ever. The problem, he states is clouds; they are complex and unpredictable. He believes that models need to better address clouds
Also this week I read that the DOE has initiated the Exoscale Computing Project (ECP) that will include the world’s most powerful and smartest supercomputer (the IBM Summit at Oak Ridge). Through its INCITE program, DOE is soliciting scientific research proposals that can utilir.
The following proposal highlights, to me, a problem in climate science research:
The title of the proposal (it was accepted) is “High-Resolution Climate Sensitivity and Prediction Simulations with the CESM”
It states “For 2019, the team has designed a set of three simulation sub-projects to assess parametric and structural uncertainty in earth system models, and to provide efficient guidance for future projects focused on longer timescale predictability.”
“The first sub-project employs the Cloud-Associated Parametrizations Testbed (CAPT), a framework that provides a computationally efficient method to identify parametrization errors in earth system simulations, so as to investigate error growth in the coupled system.”
The problem I have with this proposal is that it’s the wrong proposal at the wrong time. With an opportunity to use the most advanced supercomputers, scientists should be seeking to more fully understand the basics of climate interactions, for instance the dynamics and interactions of clouds. This proposal is seeking new cloud parameters for existing and unsuccessful models. Are these scientists chasing ad dead horse? Jumping the shark and wasting resources?
I would like to hear your opinions.
Yes, its a good interview and shows a commendable focus on the uncertainties and an unusual honesty. A few excerpts that should be taken to heart by the field:
“It is possible that the calculations of the fine-mesh computer models allowed to predict such climate surprises early. “But it is also conceivable that there are basically unpredictable climatic phenomena,” says Stevens. “Then we can still simulate so exactly and still not come to any reliable predictions.”
It’s one of the big lies of CFD modeling that if we get “all the physics” in there and find a sufficiently massive parallel computer, we will finally produce the perfect simulation. It’s a lie that has very harmful effects on science and on research.
“The large-scale climatic events are well represented by climate models.
However, problems are caused by the small-scale details: the air turbulence above the sea surface, for example, or the wake vortices that leave mountains in the passing fronts. Above all, the clouds: The researchers can not evaporate the water in their models, rise and condense, as it does in reality. You have to make do with more or less plausible rules of thumb.”
Dragonglass to the chaos-phobic.
“However, problems are caused by the small-scale details: the air turbulence above the sea surface, for example, or the wake vortices that leave mountains in the passing fronts. “
You can tell that this is a wing guy, forever stuck in his limited domain. Sure, turbulence can follow the trailing edges. But what happens along the topological boundaries of long unbroken spatial intervals, such as stretch across the equatorial Pacific? Here, standing waves and traveling waves will form based on the boundary conditions and cyclic external forcing. One can solve Laplace’s Tidal Equations along the equator and essentially capture all the dynamics observed — i.e. ENSO, TIW, and perhaps MJO all solved.
All it takes to show something is not chaotic is to come up with a stable model that reproduces the dynamics and robust against imperfections.
Very weak Paul. Stevens said this not me. I myself don’t know how important these small scale details are. It’s quite clear that denying they are important is not based on evidence and has little support in CFD either. CFD is a much older and vastly more rigorous field than climate science and its results are pretty reliable concerning negative results. The literature is strongly biased in a positive direction though. And uncertainty is often understated.
Well, you’re essentially cherry-picking quotes to fit your limited world view that small-scale behaviors produce a chaotic climate..
The exact opposite is true. The largest scale behaviors on the planet include the variation in the earth’s rotation rate, the wobble in the earth’s axis, the oscillation of the earth’s equatorial stratospheric winds, the seasons, conventional tides, and the cyclic sloshing of the equatorial Pacific thermocline. These are not governed by small-scale details but are in fact forced by highly-characterized solar and lunar orbital factors. These are also the primary ingredients that control the natural variability in the climate with a high degree of predictability (not the daily weather).
In this comment thread, I have yet to provide a cite that ties all these behaviors together, so here it is: https://geoenergymath.com/2018/11/02/mathematical-geoenergy-update/
The fact of the matter is that none of these behaviors requires CFD to quantitatively model to first order. In the book, I describe all the basic geophysics-based math models to get one going in the right direction.
This argument we have going is not balanced, as you have nothing concrete to base any of your assertions on.
Paul, The IPCC and Slingo and Palmer say climate is chaotic. So are Rossby waves, convection, even the clear atmosphere is often very chaotic. You are really outside the scientific consensus in fluid mechanics and climate science.
The real question here is the one Stevens asks and that’s the reason I quoted it. Even if we get “all the physics” in the method, will uncertainty go down. No-one really knows as even fluid mechanics is just starting to explore modeling methods like LES. The problems are immense including that classical methods to control numerical error fail. So you will never be able to separate modeling error and numerical error.
Assertion by authority does not work. Your observation “So are Rossby waves, convection, even the clear atmosphere is often very chaotic. You are really outside the scientific consensus in fluid mechanics and climate science.” is essentially meaningless and is close to an assertion by incredulity or astonishment.
All electron motion in a semiconductor is chaotic or random on a microscopic level, but that does not mean that the ensemble average values of macroscopic currents is chaotic or random.
Anyone that asserts a behavior is chaotic may not be looking hard enough for a causal forcing. I will present this example again, which you may have missed. Consider the case of the tropical instability waves (TIW) along the equator which are always 1100 kilometers in wavelength with a period of around 30 days. That is not chaotic behavior and sooner or later a non-chaotic mechanism will be understood.
Paul, This is getting old. You are misrepresenting what I say and denying well established conclusions of fluid mechanics. You have a strong track record of this kind of dishonest behavior. If this is all you have, I’m done. I could not recommend to anyone your work because your attitude is totally unscientific and indeed completely biased by your emotional response to people you don’t like. It’s really juvenile behavior.
A case of easily getting rattled. Just pointing out large-scale macroscopic phenomena that do not appear to be chaotic, along the lines with what Chubbs said earlier in the thread above.
That’s the idea of the inverse energy cascade, as a smaller to larger transfer of collective motion is sustained. Why that happens is a continued topic of geophysical fluid dynamics research:
Yet, often it’s really not even that complicated. Consider the flow of rivers, or the collective motion of ocean tides. All I am doing is applying the theory of tides to a situation of extremely reduced effective gravity conditions — the equatorial Pacific ocean thermocline. Considering the highly constraining topological boundary conditions and solving the well-known and long-established Laplace’s Tidal Equations (at the heart of all GCM formulations) that’s my latest published research.
Just in case anyone is still reading this, I will set the record straight here Paul. You are very confused about the fundamentals of turbulence, chaos (which can be vortices for example), and modeling. The 2D vs. 3D thing is not dispositive.
1. Virtually all real world flows have turbulent features and chaotic features such as vortex streets.
2. Turbulent fluid has an effectively higher viscosity than laminar fluid. The generation, destruction, and transport of turbulence is critical to advanced fluid simulations and has a large impact on the global features and forces. This is equally true in 2D and 3D.
3. There is a problem here in that if a separation becomes large enough, a vortex street (in 2D) or a complex vortex pattern (in 3D) can develop. Turbulence models do a poor job with these situations.
4. Without modeling the turbulence (and other chaotic features) in some way, results will be pretty badly wrong.
5. Rossby waves are similar to a vortex street in their physics and must be resolved in detail to get good results. They are chaotic too. The average pole to equator temperature gradient is not so chaotic even though it is noisy.
6. Even in 2D, the proper rate of decay of vortices is critically dependent on modeling the level of turbulence and properly transporting it. This is not done in weather models. There is only numerical viscosity outside the boundary layer. Decades of tuning may have resulting in rough cancelation of errors.
7. Climate is chaotic too and there is only weak evidence on whether it is predictable. There is even less evidence about its computability.
8. Just to give one fundamental problem that is a showstopper at the moment is how to control numerical error in any time accurate eddy resolving simulation. Classical methods fail. How can one tune such a model then? You can tune it for a given grid and initial condition, but that tuning might fail on a finer grid or with different initial conditions. This problem is just now beginning to be explored and is of critical importance for predicting climate or any other chaotic flow.
In some cases, it may be possible to use Navier-Stokes to generate features like Rossby waves or a vortex street. Without modeling turbulence though the results are suspect. The problem here is that this helps us little in predicting the weather where chaos will overcome any skill at about 5-7 days. It also helps us little with predicting ENSO for example.
dpy6629, geoenergymath and others. I just happened to read AR5 WG1 Section 9.5.2.1 about difficulties in modeling the diurnal cycle.
The diurnally varying solar radiation received at a given location drives, through complex interactions with the atmosphere, land surface and upper ocean, easily observable diurnal variations in surface and near-surface temperature, precipitation, level stability and winds. The AR4 noted that climate models simulated the global pattern of the diurnal temperature range, zonally and annually averaged over the continent, but tended to underestimate its magnitude in many regions (Randall et al., 2007). New analyses over land indicate that model deficiencies in surface–atmosphere interactions and the planetary boundary layer are also expected to contribute to some of the diurnal cycle errors and that model agreement with observations depends on region, vegetation type and season (Lindvall et al., 2012). Analyses of CMIP3 simulations show that the diurnal amplitude of precipitation is realistic, but most models tend to start moist convection prematurely over land (Dai, 2006; Wang et al., 2011a). Many CMIP5 models also have peak precipitation several hours too early compared to surface observations and TRMM satellite observations (Figure 9.30). This and the so-called ‘drizzling bias’ (Dai, 2006) can have large adverse impacts on surface evaporation and runoff (Qian et al., 2006). Over the ocean, models often rain too frequently and underestimated the diurnal amplitude (Stephens et al., 2010). It has also been suggested that a weak diurnal cycle of surface air temperature is produced over the ocean because of a lack of diurnal variations in SST (Bernie et al., 2008), and most models have dif culty with this due to coarse vertical resolution and coupling frequency (Dai and Trenberth, 2004; Danaba-soglu et al., 2006).
Could these problems arise from inadequately representing turbulent mixing in the boundary layer? They would likely impact the representation of boundary layer clouds, some of which have a diurnal cycle. Does this provide a more tangible link between technical limitations dpy6629 raises and what is needed in a useful AOGCM.
Click to access WG1AR5_Chapter09_FINAL.pdf
TV’s “Frank” asks:
No.
Lindzen spent his career trying to hunt down the mysterious forcing responsible for driving the 2.37 year cycle of the Quasi-Biennial Oscillation (QBO) of stratospheric winds along the equator. He ultimately failed and so it still remains unresolved in the research literature. Yet, it seems fairly obvious that the pattern is a straightforward interaction between the seasonal cycle and the nodal cycle.
The bottom-line is that climate is not forced daily but is driven more by long period variations.
Well Frank, Thanks for finding this. It is indeed true that vertical resolution in the boundary layer is much coarser in GCM’s than in most other CFD simulations. They may use something like wall functions which are actually very good for less stressed boundary layers. However, there is a lot going on besides the velocity gradient normal to the surface as you point out.
When winds are light, its not so much of a problem. When winds are stronger, there is a lot of turbulence. Just look at any instantaneous record of wind speed.
Frank, I second the thanks for providing the AR5 model evaluation link. It will take me awhile to digest that one, but good info for learning. I have an interest in boundary layer understanding from many decades spent looking at air quality meteorology and air pollution dispersion through college and career. I also studied it in grad school including a class called “Turbulence and Diffusion” using Csanady’s 1973 book on the subject “Turbulent Diffusion in the Environment” (which I still have). I will never forget how some of my fellow students liked to call it “turbulence and confusion”, which might be more appropriate. 🙂
geoenergymath and dppy6629: I was under the impression that simulating a realistic QBO was merely a matter of having small enough grid cells in the stratosphere with the correct empirical parameterization. I’m not sure who performed the definitive work in this area, but Anstey (2015) has some useful information.
“Abstract: The quasi-biennial oscillation (QBO) of tropical stratospheric zonal winds is simulated in an atmospheric general circulation model and its sensitivity to model parameters is explored. Vertical resolution in the lower tropical stratosphere finer than 1 km and sufficiently strong forcing by parameterized nonorographic gravity wave drag are both required for the model to exhibit a QBO-like oscillation. Coarser vertical resolution yields oscillations that are seasonally synchronized and driven mainly by gravity wave drag. As vertical resolution increases, wave forcing in the tropical lower stratosphere increases and seasonal synchronization is disrupted, allowing quasi-biennial periodicity to emerge. Seasonal synchronization could result from the form of wave dissipation assumed in the gravity wave parameterization, which allows downward influence by semiannual oscillation (SAO) winds, whereas dissipation of resolved waves is consistent with radiative damping and no downward influence. Parameterized wave drag is nevertheless required to generate a realistic QBO, effectively acting to amplify the relatively weaker mean-flow forcing by resolved waves.”
https://journals.ametsoc.org/doi/pdf/10.1175/JAS-D-15-0099.1
“In this study we attempt to determine why fine vertical resolution appears to be required to simulate the QBO in a GCM—or to put it another way, why pa- rameterized nonorographic gravity wave drag appears unable to drive a QBO when the vertical resolution is coarse.”
“Although the situation is improving (Geller et al. 2013), presently modelers are afforded substantial freedom when tuning their GCMs to obtain realistic QBOs, which naturally raises the question as to whether realistic QBOs are obtained for realistic reasons.”
Fig. 2. Altitude–time evolution of stratospheric equatorial (2°S–2°N mean) zonal-mean zonal wind, in (a) CMAM experiment A, with Δz = 0.5 km [vertical grid spacing], and (b) ERA-Interim. Representative 12-yr segments of the oscillation in each dataset are shown using 5-day means of daily data. Contour interval is 5 m s−1 with westerlies red, easterlies blue, and the = 0 line in black. Log-pressure altitude is defined here and in subsequent figures by , where p is pressure (hPa), p0 = 1000 hPa, and H = 7 km.
Fig. 3. As Fig. 2, but showing the evolution of for the first 6 yr of CMAM runs that use progressively increasing vertical resolution, as identified by the vertical grid spacing Δz in the tropical lower stratosphere. Δz = (a) 1.5, (b) 1.25, (c) 1.0, and (d) 0.75 km. A further increase to Δz = 0.5 km gives the oscillation shown in Fig. 2a.
Notice that the frequency of the QBO increases as vertical resolution is reduced.
Frank said:
What do you think causes this precisely semi-annual oscillation in the layer above the QBO? It has to be due to the semi-annual nodal crossing of the equator by the sun. Now multiply that by the 27.212 day nodal period of the lunar nodal cycle, and one gets precisely the 2.37 year QBO cycle. The difference is the SAO layer is influenced more by solar tidal heating, while the QBO layer is stimulated more by the lunisolar gravitational forcing as the density of the stratosphere increases with lower altitude.
The source of the QBO standing wave pattern is so obvious in retrospect you have to wonder how it slipped through Lindzen’s fingers.
Geoenergymath writes: “What do you think causes this precisely semi-annual oscillation in the layer above the QBO? It has to be due to the semi-annual nodal crossing of the equator by the sun. Now multiply that by the 27.212 day nodal period of the lunar nodal cycle, and one gets precisely the 2.37 year QBO cycle.”
Two minutes of reading the introduction to paper I linked above should demonstrate the dubious over-simplicity of the above claim. However, I’m more interested in learning more about implications of: 1) limits on resolution AOGCMs, 2) cascading errors in CFD, or 3) compensating errors in parameterization for the utility of AOGCMs. To put it crudely, if the wind is blowing the wrong direction part of the time, you probably don’t have a useful model. Modeling the QBO is all about getting the wind to blow in the right direction – ie to switch direction every two to three years in the equatorial stratosphere. Limited vertical resolution makes it impossible for some AOGCM to produce a QBO. If I understand correctly (and I may not), the QBO is driven mostly be small scale waves that dissipate and transfer their momentum to the oscillating stratospheric wind:
“The main difficulty in providing observational constraints lies in the difficulty of observing tropical stratospheric waves. Because different observational techniques are sensitive to different frequencies and spatial scales of waves (Alexander et al. 2010), no single observational dataset provides a comprehensive picture of the wave spectrum that forces the QBO. Compounding the problem is the expectation that small-scale waves, which are the most difficult to observe, make a dominant contribution to the forcing (Dunkerton 1997; Kawatani et al. 2010a). In GCMs run at spatial resolutions typical of climate models, the effects of a significant portion of the small-scale wave spectrum must be parameterized, and many of the parameters used in these schemes are poorly constrained by observations.”
So we appear to have an important phenomena that can’t be properly represented by models at their current resolution. Isaac Held has an interesting post with a movie that shows ocean eddies at 0.1×0.1 degree resolution, far finer than CMIP5 models. What new phenomena will be uncovered or explained at this resolution? Will it change ECS?
“Two minutes of reading the introduction to paper I linked above should demonstrate the dubious over-simplicity of the above claim. “
Not surprising that GCMs don’t capture the effect since they in general don’t include tidal forcing. GCM’s are built on top of the primitive equations, which when linearized (for example on the equator) yield Laplace’s tidal equations. These can then be solved exactly with tidal forcing.
It may be instructive to understand why the tidal component in the GCMs of stratospheric models were removed over the years. You can look at Lindzen’s own words for a rationale. At one point Lindzen said:
“For oscillations of tidal periods, the nature of the forcing is clear.”
Lindzen, Richard S. “Planetary waves on beta-planes.” Monthly Weather Review 95.7 (1967): 441-451.
Later on he said:
“it is unlikely that lunar periods could be produced by anything other than the lunar tidal potential”
Lindzen, R. S., & Hong, S. S. (1974). Effects of mean winds and horizontal temperature gradients on solar and lunar semidiurnal tides in the atmosphere. Journal of the atmospheric sciences, 31(5), 1421-1446.
Two minutes reading this latter paper will indicate why Lindzen gave up in pursuing the tidal link, admitting that if he couldn’t find a cyclic pattern match for such a simple model, that it probably doesn’t exist or is too weak to observe. So this is why it probably got removed in subsequent models — likely all due to Lindzen’s inability to find a most obvious cyclic pattern. It’s especially fitting to find Lindzen saying:
Thus Lindzen went down a rabbit hole and devised more and more complicated models to explain the observed behaviors. As Pierrehumbert put it:
Geoenergymath: Do I correctly understand that you are blaming Lindzen for the fact that two dozen independent AOGCMs have failed to include a tidal component in their models? And that is why they are having trouble reproducing the QBO? AOGCMs don’t even know about ocean tides? Illuminating.
Pierrehumbert is right, of course, that very smart men can devise ever more clever ways of fooling themselves, but that can apply to anyone – except members of the consensus.
Frank, The consensus science realizes the tidal forcing is there. Anything above the QBO layer of the stratosphere includes tidal factors, including the aforementioned SAO nearing the stratopause and then above this into the ionosphere layers (48K and above).
https://en.wikipedia.org/wiki/Ionospheric_dynamo_region#Atmospheric_Tides
Anne K. Smith, Rolando R. Garcia, Andrew C. Moss, and Nicholas J. Mitchell. “The Semiannual Oscillation of the Tropical Zonal Wind in the Middle Atmosphere Derived from Satellite Geopotential Height Retrievals.” Journal of the Atmospheric Sciences, July 18, 2017. https://doi.org/10.1175/JAS-D-17-0067.1.
Yamazaki, Yosuke, Tarique Siddiqui, Claudia Stolle, and Jürgen Matzka. “Atmospheric Lunar Tidal Effects on the Ionosphere.” In EGU General Assembly Conference Abstracts, 20:3526, 2018.
The more recent oceanic GCMs are explicitly including the tidal forcing factors to capture realistic dynamics
Brereton, Ashley, Andrés E Tejada-Martínez, Matthew R Palmer, and Jeff A Polton. “The Perturbation Method-A Novel Large-Eddy Simulation Technique to Model Realistic Turbulence: Application to Tidal Flow.” Ocean Modelling, 2019.
It was just a matter of time before the tidal forcing would routinely get incorporated in the models.
I don’t see that there is a problem post-Lindzen — just include the tidal forcing.
Since this blog post is about patterns, one nice way to find patterns is to do wavelet processing. Watch what happens when a straightforward LTE adjoint transform is applied to the data and then viewed through a wavelet scalogram
The SPM indicated the first two decades of the 21st century would have an average rate of warming of .2 per decade. So all these problems, right up to it ain’t even predictable, and they are a whisper from nailing it. The odds?
For the next two decades, a warming of about 0.2°C per decade is projected for a range of SRES emission scenarios.
Reblogged this on Climate- Science.
The linked video is from Tapio Schneider speaking a month ago at CalTech’s prestigious Watson Lecture for general audiences. Between 17:50 to 19:00, the he made a startling (to me) admission: AOGCMs produce 1/2 to 1/3 the observed amount of stratocumulus (boundary layer) clouds off the coast of South America. These are the most cooling clouds on the planet. (The whole talk is worth listening to, but I’m only going to discuss what surprised me.)
So, what did AR5 say about this “well-known, long-standing bias of climate models” in Chapter 9 on models? At first glance, the problem appears to be covered in Figure 9.5, which hopefully will be displayed below. There is a 20-30 W/m2 difference in cloud radiative effect (CRE) in a small area off the west coast of South America. However, CRE is very different from cloud fraction. If I understand correctly, Figure 9.5 says that WHEN there are clouds present, the modeled clouds reflect too little SWR back to space; that their albedo is too low. (Further west on the equator, the modeled clouds reflect too much SWR.)
However, what Schneider is talking about is CLOUD FRACTION. A text search of Chapter 9 shows the term “cloud fraction” is never used, while “fraction” alone and “cloud cover” are not being used in this context either. One can see observed cloud fraction in Chapter 7, Figure 7.6, including the 70% cloud fraction discussed by Schneider. The inability of models to reproduce observed cloud fraction this location (and others) appears to be totally ignored. (Perhaps I don’t fully understand the difference between CRE and cloud fraction.)
Clear skies reflect a global average of about 50 W/m2 of SWR (Rayleigh scattering and surface albedo) and cloudy skies reflect about 125 W/m2. If models produce 30% cloud cover where 70% is observed, that is a 30 W/m2 discrepancy. In the tropics, the discrepancy will be larger, say 40 W/m2. Then we can add the 20-30 W/m2 discrepancy in CRE for the 70% of time clouds are present.
Figure 9.5 | Annual-mean cloud radiative effects of the CMIP5 models compared against the Clouds and the Earth’s Radiant Energy System Energy Balanced and Filled 2.6 (CERES EBAF 2.6) data set (in W m–2; top row: shortwave effect; middle row: longwave effect; bottom row: net effect). On the left are the global distributions of the multi-model-mean biases, and on the right are the zonal averages of the cloud radiative effects from observations (solid black: CERES EBAF 2.6; dashed black: CERES ES-4), individual models (thin grey lines), and the multi-model mean (thick red line). Model results are for the period 1985–2005, while the available CERES data are for 2001–2011. For a de nition and maps of cloud radiative effect, see Section 7.2.1.2 and Figure 7.7.
Thanks Frank, I was however put off immediately by the nonsense about nighttime temperatures in Pasadena going back to 1900. They are 10 degrees F higher!! And virtually all of that is certainly due to urban development.
It also seems a little naive to me. The assumption behind all this is that if we get “all the physics” in the simulation, we will get a good result. There is no theoretical support for that assumption no matter how useful it is in getting funding. There are deep theoretical questions that we need to answer too. His result about the weakening circulation and its impact on the hysteresis point is an obvious counterpoint to the usual doctrines of colorful fluid dynamics.
Frank:
Thanks for the video, very worthwhile. The talk is consistent with the material I linked above indicating a positive feedback from tropical low clouds. Note that there is a simple physical explanation – more evaporation from a warming ocean and reduced cloud-top radiation cooling due to GHG. Climate models can easily capture these directional effects even if the all the details are wrong.
I thought the presentation showed constant cloud fraction up to quite high c
o2 levels and then a bifurcation to much lower cloud fraction. That would be no feedback up to 1200-1600 PPM.
dpy629,
As Chubbs said, climate models can capture directional effects and, in particular, forced mean-value behaviors, even if the details are wrong. That principle is also at the heart of statistical mechanics and thermodynamics, for example, in the application of the maximum entropy principle.
Compliance of forced behaviors is crucial in climate modeling. As an example, note the compliance in being able to explain a significant climate behavior (such as ENSO) using the same forcing that explains another significant climate behavior (such as QBO).
That’s not accidental but due to the significance of directed driving forces, with CO2 being an anthropogenic variation of a forcing.
We’ve been over this before Paul. Predicting something qualitative is not that hard and also of little value. Quantification is required to decide anything important.
Chubbs: There is another simple physical principle associated with a warming planet that is not usually discussed (so perhaps I’ve got something wrong). On a planet with a constant relative humidity over the ocean and a constant rate of atmospheric overturning, latent heat transport (and precipitation) from the surface to the atmosphere will increase at a rate of 5.6 W/m2 per degK of warming (7%/K times 80 W/m2). However, a planet with an ECS of around 3.6 K or 1.8 K, only 1 or 2 W/m2 of additional radiative or reflective cooling to space can occur per degK of warming. You can’t keep pumping 5.6 W/m2/K from the surface to the atmosphere when only 1 or 2 W/m2/K cross the TOA. Only a modest fraction of this gap can be closed by changes in reflection: a 1%/K change in cloud albedo/fraction is only 0.7 W/m2/K. The conventional answer is that a slowing of surface winds and a slowing in atmospheric turnover will increase relative humidity near the ocean surface and reduce evaporation and this upward flux of latent heat. Both of these changes should stabilize boundary layer clouds in my amateur opinion.
In Schneider’s model, the slowdown in overturning of the atmosphere might be taking place in the low resolution part of the model.
Due to the politicization of climate science, we tend to hear about the simple physical explanations that point to more warming and not the other simple physical explanations that point the other way. Or we fail to hear about the caveats that cast doubt about the simple physical explanations. Just like we didn’t hear that models produce only half as many stratocumulus clouds as we observe. As Feynman wrote in Cargo Cult Science:
“It’s a kind of scientific integrity, a principle of scientific thought that corresponds to a kind of utter honesty—a kind of leaning over backwards. For example, if you’re doing an experiment, you should report everything that you think might make it invalid—not only what you think is right about it: other causes that could possibly explain your results; and things you thought of that you’ve eliminated by some other experiment, and how they worked—to make sure the other fellow can tell they have been eliminated.
Details that could throw doubt on your interpretation must be given, if you know them. You must do the best you can—if you know anything at all wrong, or possibly wrong—to explain it. If you make a theory, for example, and advertise it, or put it out, then you must also put down all the facts that disagree with it, as well as those that agree with it. There is also a more subtle problem. When you have put a lot of ideas together to make an elaborate theory, you want to make sure, when explaining what it fits, that those things it fits are not just the things that gave you the idea for the theory; but that the finished theory makes something else come out right, in addition.
In summary, the idea is to try to give all of the information to help others to judge the value of your contribution; not just the information that leads to judgment in one particular direction or another.”
When weather forecasters can accurately forecast the thickness, altitude, and possible diurnal breakup of marine stratocumulus clouds over the next few days and when that forecasting scheme becomes part of climate models, then I’ll place some faith in Schneider’s modeling. All he has right now is a modeled region of marine stratocumulus embedded in a larger climate model. According to what he showed, the stratocumulus remains intact forever – until CO2 gets too high and never recovers until CO2 returns to pre-industrial. So far, that appears to be nonsense or a gross over simplification. Even the most cloudy regions have stratocumulus only 70% of the time. Stratocumulus breaks up and reforms regularly. As far as I know, a two-state model doesn’t seem appropriate.
“We’ve been over this before Paul. Predicting something qualitative is not that hard and also of little value. Quantification is required to decide anything important.”
DP, nice try. I agree that quantification is important but it appears that you have a hard time distinguishing the two when it is presented before you. Tidal analysis is purely quantitative pattern matching and hasn’t been qualitative for well more than a century. All I am doing is a variation of tidal analysis. Therefore by your estimation, this is important work. Maybe try a little harder to misdirect next time?
Frank, Excellent comment. It is indeed true that much that passes for “science” is vague verbal formulations lacking quantification. This is called “understanding” the science. But its really more akin to medieval theological explanations. They are attractive to laymen or scientists whose rigor is weak but don’t really offer much. Quantification of how large competing processes are is critical when the changes in energy flows we are talking about are 100 times smaller than the total fluxes. This is really well known of course.
DP said:
Kind of like the gravity of the solid earth being orders of magnitude greater that the pull of the moon on the surface, yet ocean tides are readily evident and we can predict these to incredible detail?
In fact much of geophysics is about differential forces, and if you can’t deal with this situation maybe you should investigate a different field of study?
Frank – You can’t assume anything is constant when a complex system is perturbed or hope to analyze it qualitatively. You need a hierarchy of models, simple to complex, local to global, to evaluate the competing factors. The evidence for a positive tropical cloud feedback in based on observations and a range of modeling; the evidence is mounting steadily. Its going to take modeling or observational evidence to provide a counter argument.
Sure there is bias everywhere but in science, unlike climate blogs, there are checks and balances.
dpy – Yes quantification is needed, that is why climate and other models are so useful.
Chubbs, Did you actually watch Frank’s video? That modeling approach shows no low cloud feedback until we reach 1200-1600 PPM.
You just keep repeating the same platitudes about science. There are some checks and balances in science, but they are weak as most people now acknowledge. There is a lot of garbage out there in peer reviewed journals. Whole fields have been disastrously wrong for 60 years, such as nutritional science. I’ve cited again and again the articles in top science journals pointing out how serious the problem are. You should do a little research to supplement your platitudes.
SOD here cites evidence of lack of skill of climate models. I gave reasons why there should be no expectation of skill except for outputs involved in the tuning. I’ve also cited some of the recent negative results that are starting to appear. You perhaps haven’t had time to read this post or the comment thread. Particularly for clouds, there should be no expectation of skill for climate models as the effects are quite subtle and small compared to the overall numerical errors.
Chubbs said:
How true. DP and Frank are unable to provide any citations to work they have done through a peer-reviewed process.
Paul P, All you seem to be able to do is shamelessly sell your work and baselessly attack others. The dogma that somehow climate science is a fundamental science is silly. Fluid dynamics is a fundamental science as is numerical analysis. Climate science uses these fundamental sciences and in my view often misuses them. Fluid dynamics has 60 years of research on numerical simulations. There is plenty of peer reviewed literature I’ve participated in. You should be careful about living in a glass house and throwing stones at others.
What’s your issue DP? Why are you attacking climate science by referring to supposed problems in the nutritional sciences field?
Lots of good work being done out there, you just have to know how to look.
Paul P, I have to ask if you have actually read this thread and post. It’s clear from first principles that much of climate science is subject to high uncertainty. The more competent climate scientists know this of course, but continue to obfuscate and/or deny this obvious fact. That’s a large black mark.
I don’t know what you hope to accomplish here. You have responded to no substantive point either SOD or myself have made. No one will take you seriously if that’s the best you have.
This idea of scientists as a priestly class who have special access to truth is dangerous and politically motivated. I personally would like to see funding cut in half and reforms such as preregistration of output measures for most fields of science. As I’ve delved more and more deeply into this issue, I find that modern science is pretty rotten. I also think we need to return to the tenured research professor model and dispense altogether with the soft money model which is a disaster.
We also need to radically downsize the higher education industry. Far too many people are going to college and graduate school and in many cases assuming disastrous debt to do so.
Projection. You are the one that isn’t adding substance to the discussion. Always suggesting that the math is too difficult and can’t be done was tiresome the first time around..
Yes I did watch the video. Supports my comments in this thread. Climate scientists are making steady progress on clouds:
*) The paleo record indicates sensitivity 5C or higher in warm climates. There is no clear evidence for a threshold.
*) The impact of GHG on stratocumulus is well established: 1) reduced cloud-top radiative cooling reduces the strength of boundary-layer circulations that provide ocean moisture and 2) warmer sea surface temperatures thin stratocumulus by increasing in cloud latent heat release which increases in-cloud turbulence which entrains more dry air from above.
*) It doesn’t take much change in stratocumulus to have a significant effect on global temperature. A 4% reduction can increase temperature by a couple of degrees.
*) In his model when cloud fraction is 100%, the cloud fraction is constant as CO2 is increased until a threshold is reached. When cloud fraction is less than 100%, however, there is some non-threshold sensitivity of cloud fraction to CO2 in his model.
*) In addition to cloud fraction, cloud density and cloud thickness also impact cloud feedback. These are not discussed in the video but we can assume there is non-threshold behavior.
*) He is coupling a detailed cloud model over a small domain to a very simple climate model. The cloud/simple climate model combination has 3.5C ECS when CO2 is increased up to 1200 ppm. At that point stratocumulus break-up completely and temperature jumps by 8C. If CO2 is then reduced from high levels the ECS is higher than 3.5 ECS, with a final sharp drop at 200ppm. These results indicate a positive cloud feedback at all CO2 levels.
*) The main limitation is the simple climate model used and the results are sensitive to how much the tropical circulation weakens with warming. Weaker tropical circulation, as might be expected in a more complex model, increases ECS at lower CO2 and reduces the temperature jump when stratocumulus break-up.
*) Satellites have provided much better cloud observations in the past 10 years supporting the papers I linked above.
*) Not discussed in video – there are a wide range of conditions in the real world. Some clouds will be closer to stability limits than the single local simulation and therefore more sensitive to GHG
*) There was no indication of any numeric instability or math difficulty or any of the other issues you have raised in this thread. On-the-contrary the prospects for further progress are excellent by combining detailed models, climate models and fast learning from observations.
A refined model for the Earth’s global energy balance
…An implication of this result is that previous observational estimates of 𝜆
λ
based on Eq. 1 (e.g., Gregory et al. 2002; Forster and Gregory 2006; Roe and Armour 2011; Otto et al. 2013; Kummer and Dessler 2014; Lewis and Curry 2015, 2018; Resplandy et al. 2018) may have been biased by not accounting for the role of stability variations. Our results also support the findings of Andrews et al. (2018), who showed that accounting for the impact of SST patterns (which we show to be mediated by stability) increases previous observational estimates of climate sensitivity, making them consistent with model-based estimates. …
JCH, very nice paper. Timely blog by SOD. Per the paper, pattern effects can help reconcile climate models and EBM. The key pattern effect is latitude, where models do a reasonable job and EBM underestimate aerosol effects.
Chubbs – the scientists who participate in CFMIP are doing excellent work. Should be a flurry of new studies out soon, hopefully. Clouds are being used as smoke and mirrors. That will only work for so long.
I don’t know what you hope to accomplish here. You have responded to no substantive point either SOD or myself have made. No one will take you seriously if that’s the best you have.
Exactly what substantive point have you made?
Handwaving about nutrition and psychology are not points. It’s poor logic.
SOD appears to be on the fence; you’re ready to act. Huge difference in points.
I was just clearing out a bunch of graphics from my desktop and found this one on CMIP5 models v satellite observations:
Thought it might be interesting in the light of various comments. Not sure of the source paper, but I might be able to track it down if anyone is really interested.
I believe it’s from:
Propagation of Error and the Reliability of Global Air Temperature Projections – Pat Frank
Chubbs wrote about tropical low cloud feedback on May 28: “You can’t assume anything is constant when a complex system is perturbed or hope to analyze it qualitatively. You need a hierarchy of models, simple to complex, local to global, to evaluate the competing factors. The evidence for a positive tropical cloud feedback in based on observations and a range of modeling; the evidence is mounting steadily. Its going to take modeling or observational evidence to provide a counter argument.”
First, let’s make this discussion quantitative. EBMs suggest an ECS of about 1.7 K/doubling and therefore a climate feedback parameter near -2 W/m2/K while the central estimate of AOGCMs is near 3.4 K/doubling and -1 W/m2/K. Assuming water vapor plus lapse rate feedback of +1 W/m2, a small positive ice-albedo feedback, and Planck feedback of -3.2 W/m2/K, positive cloud feedback needs to be near +1 W/m2/K for the multi-model mean of AOGCMs to be “right”. Unquantified assertions that tropical cloud feedback can’t help us distinguish between EBMs and AOGCMs. We need to be quantitative.
Let’s consider the 2017 review on low cloud feedback by Kline et al. They conclude tropical low cloud feedback is about 1 W/m2/K locally. Such low clouds cover about 1/4 of the planet, producing a global feedback that is a modest +0.25 +/- 0.18 W/m2/K (90% ci). Alone, this isn’t enough to predict catastrophic warming from doubled CO2. It could be negligible. In AOGCMs (Figure 2a), local low cloud feedback ranges from +2.5 to -1 W/m2/K.
Click to access s10712-017-9433-3.pdf
In Table 1, these authors cite six phenomena that increase [reflection from] low clouds: strengthened inversion stability, increased subsidence, increased horizontal cold advection, increased humidity in the free troposphere, decreased DLR, colder SSTs and increased surface wind speed.
Figure 2b shows how the feedback produce when changes in five of these six factors (not wind) are taken from AOGCMs combined with the information from large eddy simulation (LES) models to calculate the feedback from low tropical clouds. Warmer SSTs produced a local feedback of nearly + 2 W/m2/K in LES. The strengthened inversion stability predicted by AOGCMs was expected produces a local feedback of about -1 W/m2/K in LES models. The other factors have negligible impact. However, we can’t be sure that climate model with their lousy clouds (only half as many low clouds as observed off of equatorial South America!) project appropriate changes in these six factors. And the cloud-resolving models only simulate clouds under conditions from a few representative locations on the planet. Often these models don’t even include a diurnal illumination cycle! Subsidence, wind advection (and presumably upwelling) of cold water are phenomena that are controlled globally. Changes in relative humidity are controversial and depend on getting low clouds right. The authors may have erected a giant “house-of-cards” that will come crashing down if one “card” is removed because it is wrong.
The authors support their work summarizing observations of low clouds in Figure 3. Tropical local low cloud feedback ranges from -1 to nearly +3 W/m2 in these studies. The study with the narrowest confidence interval around +1 W/m2/K (Z15, Zhai et al, 2015) studied the change in low ocean clouds in subsidence regions from 20 to 40 degrees N and S. Technically, these are subtropical low clouds, with subsidence produced by the Hadley circulation? as opposed to the Walker circulation? in the tropics. San Francisco is at 38 degN. Z15 compared seasonal warming in SSTs (about 6 K) and the seasonal decrease in low cloud fraction (roughly 55% to 45%) and calculated a 1.3% reduction in low cloud cover per degK. Only one climate model (GFDL_cm3) came reasonably close to reproducing this change (60 to 40% in the NH and 65% to 55% in the SH. The rest were absurdly wrong in many different ways. The problem is that SST isn’t changing in isolation. I estimated that incoming SWR increases about 33% from winter to summer. So more SWR is reflected in summer than winter even though there are fewer clouds. Even worse, the 20% of SWR that is typically absorbed likely causes more marine boundary layer clouds to “burn off” during summer daytime than winter daytime! There is no way to isolate the effect of seasonal changes in SSTs from a myriad of other factors that change or might change with the seasons: SWR irradiation, inversion stability, subsidence, wind, currents, relative humidity and inversion stability. We need to know the partial derivative of low cloud fraction with respect to SST while all other factors are held constant. We may need to know other partial derivatives, such as the change in inversion stability with respect to SST anomaly. These partial derivatives can’t be observed.
Z15 https://agupubs.onlinelibrary.wiley.com/doi/full/10.1002/2015GL065911
In conclusion, most AOGCMs are completely unable to deal with tropical low cloud feedback. Likewise, observations also appear inadequate, because many other factors change when SSTs warm seasonally. Are we being reliably guided by a combination of inadequate AOGCMs and LES models? I’m no expert, but I personally wouldn’t describe the current situation as “settled science”, even qualitatively.
Frank – Klein et. al. show that 0.25 W/M2 from tropical low clouds combined with 0.2 W/M2 from high clouds (higher cirrus clouds in a warmer world) is enough for 3C ECS.
Frank’s comment is very telling Chubbs. The uncertainty in cloud feedbacks is quite large in models. I don’t know how good the data is.
No amount of vague verbal formulations, wishful thinking or fond hopes on your part will make that go away.
The weight of evidence has been accumulating steadily for years, both observations from improved satellite platforms and detailed cloud modeling. Yes the climate model spread is large, but the models with negative tropical low cloud feedback can now be discounted.
Chubbs: Klein’s value is 0.25 +/- 0.18 W/m2/K (don’t ignore the uncertainty) – if the assumptions made during the analysis are correct. The main assumption is that one can get useful information from AOGCMs about the factors that stabilize low clouds – inversion stability, subsidence rate, relative humidity, cold ocean currents, etc – from models that don’t come close to properly representing these clouds. The fundament equation is equation 3 shown below.
dC/dT = Sum over all factors x_i of: (dpC/dpx_i)*(dx_i/dT)
dC/dT is the change in low clouds with the change in global temperature. The factor of 0.25 +/- 0.18 W/m2/K, when expressed in these units rather than % cloud fraction/K. x_i are the above clouds stabilizing factors.
dpC/dpx_i is the change in low clouds with the change in cloud stabilizing factor x_i (inversion stability, for example) obtained from large eddy simulation models. dp = partial derivative.
dx_i/dT is the change in x_i with the change in global temperature seen in AOGCMs. Can we really trust an AOGCM that produces 50% as many low clouds as observed to tell us how an important factor such as inversion stability changes with temperature? Only if we are lucky.
GMD Discussions
Algorithmic Differentiation for Cloud Schemes
by Manuel Baumgartner, Max Sagebaum, Nicolas R. Gauger, Peter Spichtinger, and André Brinkmann
https://www.geosci-model-dev-discuss.net/gmd-2019-140/
Short Summary: Numerical models in atmospheric sciences need to include physical processes through parameterizations, which are not explicitly resolved, e.g. the formation of clouds. As a consequence, the parameterizations contain uncertain parameters. We suggest to use the technique of Algorithmic Differentiation (AD) to spot the most uncertain parameters within parameterizations. In this study, we illustrate AD by analyzing a scheme for liquid clouds incorporated into a parcel model framework.
A couple of comments:
1. As far as I can see, from commenters who believe model results should be preferred over the observational estimate from the last 200 years, none has taken up this subject, the main question of the article:
2. There seem to be two central ideas in the comments:
a) the results from models and physics principles are very robust, so the results of climate sensitivity are solid
b) the results from models and physics principles are very non-linear, and don’t match observations in many important cases, so the results aren’t able to be tested or really trusted
“b) the results from models and physics principles are very non-linear, and don’t match observations in many important cases, so the results aren’t able to be tested or really trusted.”
I would amend this. The results can be tested. These tests show little skill on the regional level. Further there is strong first principles evidence that any skill on global averages is the result of cancelling errors. Thus the results can’t be trusted.
Furthermore uncertainty can only be assessed by do a parameter study of ALL the uncertain parameters in the model. There are a few papers but nothing comprehensive. The IPCC method of assessing uncertainty is statistical nonsense.
The advocates of your statement a) have in this thread produced no evidence really and don’t seem to understand even the most fundamental issues in numerical solution of PDE’s or fluid dynamics, which are much more advanced sciences than climate science.
Name one important scientist from those areas of science who agrees with you… in a publication.
JCH, Every experienced fluid dynamicist agrees. Climate scientists are not generally cognizant of the fundamentals. Since you know nothing about the science, I suggest you try to educate yourself.
Name some so I can contact them.
dp said:
He’s bluffing as usual. Fluids don’t spontaneously become chaotic at the scale of the climate. Two papers on the stratospheric QBO were published in the prestigious Physical Review Letters within he last year. It will be interesting when the pattern in QBO is acknowledged to be simply forced by the nodal crossing cycles, i.e. non-chaotic in behavior.
In physics one has to start somewhere and that is usually from a place of high symmetry and/or low dimensionality. From there, you work your way to more complicated behaviors, such as off-the-equator.
So, as encouragement, it’s not as hard as you would think.
Above, Zhai (2015) failed to recognize that seasonal increases in SWR could “burn off” low cloud, making it appear that warmer STTs caused fewer low clouds, I checked the Klein (2017) review for better observational evidence. According to Table 2, reference B16 also contained observational evidence about SST and low cloud feedback. This turns out to be Brient and Schneider (2016):
https://doi.org/10.1175/JCLI-D-15-0897.1
Since the authors wished to use observations of low cloud feedback to constrain AOGCMs, they created a novel strategy for identifying tropical low clouds that could be used with observations and model output. Using reanalysis, they select the 25% of tropical (30N to 30S) grid cells, with the lowest monthly relative humidity at 500 mb. The location of these grid cells changes from month to month, but the chosen grid cells were usually in regions where marine boundary layer clouds are found. The authors admit that this criteria often misses boundary layer clouds near 30S and 30N and those outside the tropics. Space-based systems detect mid- and high-altitude clouds in 15-25% of the selected grid cells. Let’s call them “putative low clouds”. The authors then add up the SWR being reflected from these grid cells and divide by total planetary reflection from cloudy skies. On the average, about 9% of the SWR reflected by the planet comes from these tropical ocean cells. Approximately 1/12 of the planet is covered by these grid cells: 1/2 tropics, 1/3 ocean, and 1/4 driest. The authors appear to have the ability to study the reflectance and SST in each grid cell or regionally, but didn’t do so. Pacific SSTs and marine boundary layer clouds are not analyzed separately from those in the Atlantic or Indian oceans. (That would be my choice.)
Both the reflectance and SST data were filtered (by frequency) to separate a seasonal signal from “de-seasonalized”, “intra-annual”, and “interannual” signals. A noisy xy-scatter plot for the “deseasonalized” monthly data has a slope of -0.96%/K or +3.7+/-0.8 W/m2/K based on average tropical insolation. R^2 is 0.27, so only 27% of the variance in average SWR reflected by these grid cells is explained by changes in average tropical SST. The authors didn’t convert this local forcing to a global forcing, but it comes from about 1/12 of the surface of the planet. This is near Klein’s global central estimate of 0.25 W/m2/K.
To address the “putative cloud issue” (possibly in response to a referee), there is a brief account of analyzing the low cloud fraction from CALIPSO. Unfortunately, we aren’t told the source (region or grid cells) of this cloud data. The deseasonalized cloud fraction shows -4.1+/-1.2 %/K change with SST and a 0.79 correlation with the above changes in reflectance. Interestingly, the seasonal change much larger: -6.4+/-0.9 %/K. This supports my criticism of Zhai (2015) that both seasonal changes in solar irradiation and SST influence low cloud fraction. And Zhai studied subtropical low cloud where the seasonal change in irradiation is much larger than in the tropics.
Fig. 2. Deseasonalized variations of tropical low cloud (TLC) reflection and sea surface temperature. (a) Shortwave TLC reflection according to CERES data for March 2000 through May 2015. The right axis indicates the shortwave cloud radiative effect with mean insolation = 387.9 W/m2. (b) Sea surface temperatures in tropical low cloud regions. (c) Scatterplot of monthly reflectance vs average SST anomaly.
Above I hopefully pasted Figure 2 from the paper. When looking at this Figure, it didn’t take this amateur long to ask the obvious question: How much of the deseasonalized change in both reflectance and SST is driven by ENSO? Apparently Brient and Schneider don’t want to know, but provide a single sentence (at the request of a referee?) acknowledging that deseasonalized SST variations are primarily driven by ENSO. The Walker circulation – which creates the subsiding air masses in the tropical Eastern Pacific where tropical low clouds are often found – is disrupted by El Nino. Correlation is not causation: a) Warmer SSTs may cause fewer low clouds. b) Fewer low cloud may cause warmer SSTs. c) Or both may be responding to ENSO. (Before laughing at choice b, remember that both Lindzen and Spenser have reported stronger lagged than unlagged correlations with the opposite sign between reflected SWR and SST in the tropics.
Chubbs keeps reminding us: “The weight of evidence has been accumulating steadily for years, both observations from improved satellite platforms and detailed cloud modeling.”
When an amateur can poke some apparently serious holes in evidence from two papers, how much weight should be placed on that evidence? If I’m right, how do such problems escape peer review?
Apparently Brient and Schneider don’t want to know, but provide a single sentence (at the request of a referee?) acknowledging that deseasonalized SST variations are primarily driven by ENSO. …
I read to nonsense like this, and I just stop.
JCH: My goal in studying this paper was to better understand the strengths and weaknesses of the observational evidence supporting the idea that low cloud feedback is positive. As you can see from the title of the paper and the last sentence of the abstract, the authors had much bigger ambitions:
“Constraints on Climate Sensitivity from Space-Based Measurements of Low-Cloud Reflection”
“An information-theoretic weighting of climate models by how well they reproduce the measured deseasonalized covariance of shortwave cloud reflection with temperature yields a most likely ECS estimate around 4.0 K; an ECS below 2.3 K becomes very unlikely (90% confidence).”
Many of the choices made in this paper were directed towards the goal of constraining ECS from climate models. It is difficult to predict how the low clouds from an AOGCM would look from space, so they choose to defined grid cells with tropical low clouds as grid cells with the low RH at 500 mb (“putative low clouds”), because that definition works (perhaps poorly) for both AOGCM and reanalysis grid cells. The authors didn’t study the effect of regional or Pacific tropical SSTs on nearby or Pacific tropical low clouds, because the project was inherently global in scope. If the authors had the same goal in mind as I did – understanding as much about tropical low cloud feedback as possible, they probably would have made different choices. With 20/20 hindsight, the whole project may have been infeasible if they couldn’t determine whether SSTs or ENSO was responsible for changes in reflection by tropical low clouds. So it appears to be a question they chose not to address, and which a peer review should have forced them to address or at least discuss thoroughly.
Thank you Frank for diving into this mess. It makes me understand the questions better, in contrast to handwaving from some other debattants. You can look at nullschool to see if high SST goes together with low cloud cover. I don`t think it is so clear. And if you look at it globally, you have to look for the effects of increased water air transport on clouds in latitudes further north and south.
Fortunately there is plenty of independent information to evaluate climate models and EBM. There is no reason to shift consensus ECS estimates, which have been stable for decades. During that time there has been a large accumulation of Paleo data, improved modeling and well predicted warming. If anything I expect the lower ECS range to be raised to 2C in the next IPCC update.
I haven’t seen any independent evidence in this thread that support EBM. Meanwhile paper after paper points out method limitations and bias. The most recent being the paper that JCH linked above. I can see why “bias” or “lack of fundamentals” in climate science is cited as a reason to support EBM, since other evidence is lacking, but it is not a very convincing argument to me.
A lot of generalities there Chubbs. One reason to appreciate EBM’s is that they are much more readily understood and the tuning very transparent. That’s not the case at all with GCM’s. The problem with EBM’s is that you need effective forcings and that requires a lot of assumptions. But I do think that the uncertainties can be more easily estimated for EBM’s.
Further a lot of the attacks on EBM’s such as by Dessler have been proven wrong. The other more sophisticated attempts all have issues and uncertainties themselves. My favorite is the “pattern of warming” argument which itself is an admission of exactly what SOD highlights in this post, namely that GCM’s have little skill at regional climate. So then the silly argument goes that they must be “right” in the long run, an assertion that is faith based since it is contrary to a mountain of evidence.
At some point, I think climate scientists have simply given up trying to win an argument with Nic Lewis. If anything there is a bias in climate science to discount estimates that are “too low.” You know the reasons.
Well – the only specific information you have provided in this thread is the dead-end iris effect and a Spencer energy balance model that predicts 0.12C/decade warming since 1979. If you want simplicity just take the 0.18C/decade warming rate over the past 40 years and project it forward. Much better than the 0.13C/decade from EBM. Finally Lewis’ blogs are not moving the needle among scientists. The papers he criticizes are sited as if the blog commentary didn’t exist. Just look at the paper JCH linked above for multiple examples (and for a nice explanation of the model vs EBM discrepancy).
The ability of climate models to have accurate global predictions, when regional patterns differ from observations, shows that chaotic motion doesn’t significantly impact the earth’s energy balance. Note that if chaotic patterns did impact the energy balance, then EBM would be invalid; since, no pattern variable is included. So as usual you are contradicting yourself. Again recommend the paper JCH linked for a good explanation of which pattern variable is important.
Chubbs: What new (since AR5) evidence says ECS must be higher than EBMs suggest?
Climate models are always “improving”. The crucial question is whether the improvements that have been made mean that the models are suitable for predicting the future. Many times I’ve presented Tsushima and Manabe’s 2013 analysis of seasonal feedback observed from space and reproduced by AOGCMs. That analysis shows that no model nor the multi-model mean matches the seasonal change in LWR and SWR from clear and all skies observed from space. And the analysis shows massive disagreement BETWEEN CMIP5 models. Feedbacks are not settled science. The abstract concludes:
“we show that the gain factors obtained from satellite observations of cloud radiative forcing are effective for identifying systematic biases of the feedback processes that control the sensitivity of simulated climate, providing useful information for validating and improving a climate model.”
These gain factors show that models systematically over estimate the (positive) LWR feedback from cloudy skies in response to warming. That needs improvement. Models need validation … in the words of the man who made the first climate model.
You claim that AOGCMs “well predict warming”. Nonsense. There are three possibilities: 1) Models correctly hindcast the observed amount because they wrongly create too negative an aerosol indirect forcing. 2) Models hindcast too much warming. 3) Some combination of 1) and 2).
Let’s skip the EBM papers, and consider the central estimates from the SPM for AR5 itself: dT = 0.85 K and dF = 2.3 W/m2 since PI. F_2x = 3.45 (Table 9.5). According to these numbers, we have experienced the equivalent of 2/3’rds of a doubling of CO2. A full doubling (TCR) would be 1.3 K. If models actually hindcast the amount of warming the IPCC reports (as you assert) and the multi-model mean TCR is 1.8, this implies that the average model has imposed a forcing equivalent to only 1.6 W/m2, slightly less than 1/2 of a doubling! This is consistent with the hypothesis that the average model produces an aerosol indirect forcing (and other negative forcing) that is about 0.7 W/m2 more negative than the IPCCs central estimate. Alternatively, if the average model actually imposed the IPCC’s central estimate for dF, then it would have hindcast 1.2 K of warming.
ECS is F_2x*[dT/(dF-dQ)]. If we use dQ = 0.8 W/m2 and the IPCC’s central estimate for dF (2.3 W/m2), ECS is 2.0 K. If we use the estimated forcing that models have applied (1.6 W/m2), ECS = 3.4 K, the multi-model mean. The discrepancy in both measures of climate sensitivity can be fully explained by assuming that models impose a forcing that is 2/3rds of the IPCC’s central forcing estimate.
If you look at the model with the highest TCR in Table 9.5 (2.5 K for HadGEM-2), its F2x is 3.5 W/m2 (from 4X experiments) or 2.9 W/m2 (from artificially raising SST). If the model hindcast a warming of 0.85 K, the model has imposed a forcing of only 1.1 or 0.9 W/m2. If the model imposed a forcing 2.3 W/m2, it would have hindcast a warming of 1.6 or 2.0 K. Should anyone take this model seriously?
If I play the “constrains game” and select the models that best hindcast the observed 0.85 K of warming assuming the IPCC’s central estimate of 2.3 W/m2 is correct, I find the 7 of 23 that hindcast 0.8-1.0 K of warming. The average ECS for these seven models is 2.4 K. If I select the models that best predict dF-dQ (2.3-0.8 W/m2/K), I find 5/23 between 1.2 and 1.5 W/m2 and three more at 1.1 W/m2. The average ECS for the group of five is 2.3 K and the group of eight is 2.5 K. Put this in the appropriate Baysian framework and I will have constrained ECS to a lower value.
Frank writes:
Sure, we can always wait until coastal plains are flooded or banana trees start growing in Canada. That might validate the models, but that’s a crazy way to do it.
As with any experiment that lacks controls, one has to be clever on finding other ways to validate climate models based on historical observations. If the observations show complex patterns, one can always try cross-validation on one time-interval and see how well it reproduces the data on an orthogonal interval.
For gradually varying or trending data, this is not so strong a validation, since the degrees of freedom (DOF) required are often too easily met. But when you can find complex climate patterns that obviously require a high DOF solution, yet can be fitted with a simple model, you may be on the right track.
That’s why Richard Lindzen was so desperately trying to find a tidally-forced model to atmospheric patterns back in the day. He said several times in his research papers that if only he could deduce tidal periods in the observations, he would be able to understand the forcings. But he eventually gave up.
The bottom-line is that warming models are difficult to cross-validate because they are prone to over-fitting, but other specific climate models that show complex patterns may be more appropriate for cross-validation.
Some of the new evidence since AR5:
1) The rapid rise in temperature much faster than predicted by EBM
2) A number of papers have shown that models are matching the observed warming whenb an apple-to-apple comparison is made
3) OHC on the high end of IPCC estimates and additional warming found below 2000m
4) Several papers have shown that EBM are biased low. Most recently the paper linked by JCH
5) Many paleo studies ranging from the LGM to the eocene
6) Cloud studies discussed above increasing confidence in a positive feedback
7) Recent paper showing a strong aerosol indirect effect
8) Several studies fitting observations vs forcing including one linked above
Yes, As Chubbs said, energy balance models are certainly less useful when one realizes that no one has a good handle of the energy balance due to natural variability, and even less if these are erratically nonlinear. Since no one has found the pattern to the natural variability, that factor in the EBM is missing, making the EBM less valid as a model of AGW.
Consider something as straightforward as tidal variation. Everyone realizes that the absolute amplitude of tides at any one location is very difficult to estimate from first-principles. Yet, once the pattern is calibrated over a period of time, based on the locking in of tidal cycles, that amplitude can be predicted quite accurately.
That’s why I suggest that the fundamental nature of climate variability and the patterns that they entail should be the first order of business. In other words, we need the equivalent of tidal analysis for natural climate variability. And I am confident that this can be done much better than the current state-of-the-art, while disregarding the nay-sayers such as DP. He hasn’t shown any special insight or evidence that this can’t be done, apart from his specious argument of “because chaos”.
Cherrypicking papers to believe in doesn`t help us understand. What are the real mechanisms of warming?
“In other words, we need the equivalent of tidal analysis for natural climate variability.” You, Judith Curry and I all agree on that. But the entire climate establishment disagrees and says that natural variability doesn’t matter in the long run (some say 17 years, some 20, some longer). You might want to try to persuade some of them. I suggest you don’t attack them in the process. Lacking such persuasion, such work will not be funded or get done.
You are however as simplistic as ever in characterizing what everyone else says. My point is based not on chaos (which presents another set of problems) but on simple numerical analysis of ill-posed problems and on fundamental fluid dynamics.
What you say about EBM’s I don’t think has any substance to it. If the effective forcings are correct, then energy must be conserved. No patterns are required. GCM’s attempt to resolve more but their patterns are wrong and very uncertain. They also mostly conserve energy but the feedbacks are quite uncertain in these codes. Frank pointed to some the uncertainty in clouds above.
That’s an incorrect interpretation.. They all want to understand natural variability because it reduces the uncertainty in trend analysis . A model will place bounds on the natural variability excursions.
NK writes: “Cherrypicking papers to believe in doesn`t help us understand. What are the real mechanisms of warming?”
That question is a simple one to answer. The law of conservation of energy demands that when the amount of energy entering an object is greater than (or less than) the amount leaving, the difference becomes “internal energy. Heat capacity if the factor that converts changes in internal energy into changes in temperature. The atmosphere and at least the top half of the ocean are warming and that means power is coming from somewhere.
The obvious place is the radiative imbalance at the TOA created by rising GHGs. Redistribution of heat between the surface compartment and the deeper ocean – ie internal/unforced variability – is another possibility. (I’ve never looked into the limits ARGO and pre-ARGO ocean heat uptake data places on the contribution from internal variability.)
Since a radiative imbalance across the TOA is a logical mechanism, YOU really should have an alternative mechanism in mind that is capable of providing the necessary power before asking this question. Release of stored chemical energy such as fossil fuels? Radioactive decay inside the Earth? (That’s about 0.1 W/m2). Increased solar irradiation?
” Redistribution of heat between the surface compartment and the deeper ocean – ie internal/unforced variability – is another possibility. “
It could be argued that the published climate science research is well behind the curve in terms of deconvolving patterns from the data. The dynamic theory of tides asserts that water is always churning and sloshing at all depths — resulting in raising and lowering the thermocline relative to the surface — and that needs to be modeled correctly to understand ENSO, for example.
And so if you solve Laplace’s Tidal Equations for shallow water waves, one can start doing the proper pattern recognition and start aligning tidal cycles with ENSO temperature cycles
Geoenergymath writes: “Sure, we can always wait until coastal plains are flooded or banana trees start growing in Canada. That might validate the models, but that’s a crazy way to do it.”
If we don’t have scientifically validated models to project AGW, then you appear to be suggesting that we purchase insurance against the possibility that AGW might turn out to be catastrophic. Schneider once argued this position, saying it was like insuring your house. However, most of the non-developed world can’t afford to purchase such insurance by limiting emissions and they have the major say in future emissions. And the poorer people in the developed world probably won’t purchase such insurance.
In the end, you need a valid model to do a sensible cost benefit analysis for reductions of emissions. A 70% likelihood that ECS is between 1.5 and 4.5 K doesn’t do the job (IMO). The cost-benefit analysis is distorted by the worst fears.
I’ll agree with you that doing studying our climate system is vastly more difficult than doing well-controlled reproducible experiments in a laboratory. However, seasonal warming is a phenomena that can be observed from space every year that involves warming of GMST (not the GMST anomaly) of 3.5 K (similar in magnitude to AGW) and changes in TOA fluxes similar in magnitude to forcing. This is one way Manabe asserts we can validate models. Read his 2013 PNAS paper.
Frank said:
I have no idea what you’re talking about. I was leading toward ways of doing cross-validation. I showed you a picture of an ENSO cross-validation. Here’s one of a QBO pattern cross-validation
You train on one interval and reproduce on another interval. At the last AGU, I presented several ways to do a cross-validation — see this presentation on ESSOAR
https://www.essoar.org/doi/abs/10.1002/essoar.10500568.1
So, why don’t you go for it?
Soaking on this a bit. If pattern effects are important, then global average surface temperature isn’t a unique metric for feedback strength and energy balance; making EBM invalid and prone to scatter, since our single climate realization provides a very limited sample of patterns, A single climate model run would also be problematic, but by varying model initial conditions and physics a range of patterns can be generated. So strong pattern effects would increase not decrease the value of climate models.
Patterns are very important. In an EBM, those patterns are taken into account by the effective forcings used. That’s also a significant source of uncertainty. Lewis used forcing estimates from Hansen’s older work (I think 1990’s). However after Lewis’s paper came out, Marvel and Schmidt published a new estimate that lowballed the forcings (as compared to Hansen). I believe Lewis had a response which as usual was very detailed.
The pattern effect they are discussing would completely nullify everything Nic Lewis and Judith Curry say. You as well. The eastern Pacific cooled from around 1980-85 until around 2013-14. Since then, warming has stormed back, which is what those scientists keep saying: CS based upon observations is likely biased low, and by quite a bit.
JCH, What you say is nonsense and unsupported. You would do well to stick to guitar playing and leave science to those who know what they are doing.
The eastern Pacific cooled from around 1980 until 2013. It had a dominate pattern of surface cooling. It is a significant percentage of the earth’s surface area. Models ran hot. Since then that pattern has been replaced with a pattern dominated by warming, and surface warming has been far more robust. The Mantua PDO has been above zero for almost the entirety of post 2013 period.
“… leave science to those who know what they are doing.”
This recent NYT article is too appropriate to pass up.
For example, a stochastic spread in cloud coverage is enough to break up the requirement for perfect sub-grid parameterization according to Oxford’s Tim Palmer.
In our book, we have a section on characterizing spatial extents of clouds. They do follow a maximum-entropy spread in sizes giving a fat-tail distribution. This is enough to break up any regular grid according to Palmer’s assertion — which is apparently used in the new British climate model UKESM1.
JCH quoted:
“Eight Atmospheric General Circulation Models (AGCMs) are forced with observed historical (1871-2010) monthly sea-surface-temperature (SST) and sea-ice variations using the AMIP II dataset. The AGCMs therefore have a similar temperature pattern and trend to that of observed historical climate change. The AGCMs simulate a spread in climate feedback similar to that seen in coupled simulations of the response to CO2 quadrupling. However the feedbacks are robustly more stabilizing and the effective climate sensitivity (EffCS) smaller. This is due to a ‘pattern effect’ whereby the pattern of observed historical SST change gives rise to more negative cloud and LW clear-sky feedbacks. ASSUMING the patterns of long-term temperature change simulated by models, and the radiative response to them, are credible, this implies that existing constraints on EffCS from historical energy budget variations give values that are too low and overly constrained, particularly at the upper end.”
An alternative hypothesis is that “the patterns of long-term temperature change simulated by models, and the radiative response to them, are NOT credible. In most areas of science, when observations don’t agree with the model/hypothesis, we question the model. (The observations of warming and forcing that are input into energy balance models have been thoroughly questioned and most agree the discrepancy is real.) As best I can tell, in climate science, we are told that the real world is merely “one realization of reality” on a chaotic planet that could have followed innumerable other realizations of reality – most of which likely would have shown different patterns of warming and radiative response. (If I’m misunderstanding or mis-stating the argument, please respond.) However, we now have thousands of model runs initialized under different conditions and a database of 100 runs from one model (Dessler paper). Why didn’t even one of these model runs follow the historical pathway our planet has taken over the past few decades. Isn’t this data really saying that – if models are credible – that our “single realization of reality” is has odds of less than 1% (100 runs) or less than 0.1% (1000 runs). It would make far more sense to find that 10% of runs follow the historical pattern and 90% follow a pattern that leads to more warming. The inability to point to even one run that follows the historical pattern suggests models are incapable of reproducing the past – even with the help of chaos. (Would such an outlier run be submitted to the CMIP database?)
Good comment Frank. The “pattern of warming” line of reasoning has always been clearly biased. So as you point out all model runs to date disagree with actual data, but models will be right in the long run. It’s really just a leap of faith (and faith in something that is obviously scientifically weak). It shows to me how deeply dependent on climate models the field of climate science really is. Since those models are so weak, the field has a weak standard of evidence that in more rigorous fields would not be accepted.
Of course, to some scientists expanding understanding of the climate system is nonsense.
CFMIP meets again soon. All indications are they are right. According to Judith Curry, their leader wears a white hat.
“The range is about 2-4ºC. That is, different models produce different results.”
An important factor in assessment is the actual number of models that have been used. Are we talking about 20 models or 200. And I am not considering model runs. If a 2 C range exists in only 200 models I hate to think what the error rate would be with a 1000 models.
Another way to quantify their use would be to look at the number of variables used ( where comparable) and the variability in range of the variables. This might enable a tighter range but I doubt it will ever make the models accurate, only useful.
Questions about clouds and pattern-effects.
What are the effects of a warming climate? Some postulates:
1. Increasing temperatures give increasing evaporation and increasing water vapor. This should be a robust effect, with some known magnitude.
2. Increased water vapor give increased cloud cover. From a conceptual logical standpoint this should be correct. But among scientists promoting a doomsday message it doesn`t fit. Contrary to what is shown in some studies, they believe that cloud cover hasn`t been increased with global warming. So where is the water vapor going then?
3. Increased cloud cover has a global cooling effect, when all other forcings and feedbacks are held constant. From a conceptual logical viewpoint this should be correct, as it is a robust knowledge that clouds are cooling earth about 5 degC compared to clear sky. But among scientists promoting a doomsday message it isn`t true. They believe there are some pattern effects that show that more clouds give more warming.
I think this is what the pattern discussion is about.
nobodysknowledge,
1. In a warmer world everyone (by which I mean all climate scientists) expects more water vapor. Based on the carrying capacity of air we would expect 7% increase per ‘C of warming. But there is another constraint, less obvious, which brings this down to 2-3% per ‘C.
I wrote an article about this a while back.
2 & 3. Take a look at Clouds and Water Vapor – Part Eleven – Ceppi et al & Zelinka et al. This should be a good introduction along with all the comments.
When you say “But among scientists promoting a doomsday message it doesn`t fit.” I feel like just deleting your comment for being in violation of blog policy. The implication is that there is an obvious physical mechanism that *you* can see yet climate scientists are completely blinkered..
Don’t write this kind of drivel. If you have a physics argument, let’s hear it. When you are trying to figure something out you can just ask a question.
Remember the moderator (me) can just capriciously delete comments that appear to be in violation of blog policy.
I start from the assumption that people who have studied the subject for decades have a much better understanding of it than me. I recommend this revolutionary idea for readers as a good starting point for learning about climate.
I found the article referenced in my comment “I wrote an article about this a while back.”:
Impacts – XIII – Rainfall 3
Well. Let me call them worried scientists. Quote: Professor Danny McCarroll
” What is really worrying is that climate models have shown that, if greenhouse gas emissions are allowed to continue until there is double or even triple the pre industrial amount of carbon dioxide in the atmosphere, then some of the most important clouds for cooling our planet, the big banks of oceanic clouds that reflect a lot of sunlight back to space, could stop forming altogether and this would really accelerate warming.”
SoD. What I call a conceptual logical viewpoint, is meant as a common sense explanation. We have to look more into it to know if it is right or wrong. But I think it is a doomsday message when scientists use some words in an uncritical way, such as “runaway” or “turning point” or even some instances of “accelerate”.
This is an article on the study:Clouds have moderated warming triggered by climate change
A new study has revealed how clouds are modifying the warming created by human-caused climate change in some parts of the world
And this is a link to the study:
…Our observations, based on palaeoclimatic proxies, confirm what been suggested by climatic models, that increasing global temperature leads to increased cloud cover at high latitudes. Our data also suggest that this is a two‐way process, with warm conditions leading to increased cloud cover and cool conditions reduced cloud cover.
So it is not from the pattern-effect folks, but their findings appear to confirm.
The cloud people strike again, with a fun read:
Combining crowd-sourcing and deep learning to understand meso-scale organization of shallow convection
JCH said:
“The cloud people strike again, with a fun read:”
That is indeed a good read, describing interesting pattern classification.
One common pattern I found underlies both ENSO and AMO. These two behaviors are completely uncorrelated until the distinct wavenumber modulation is removed from each. The forcing that’s left is almost exactly correlated.
I wonder how many other patterns can be found with physics-based machine learning approaches.
What is happening? Is there a global brightening?
I think the findings from sattelite data is surprising. It says that cloud fraction has decreased the last decades, and that cloud tops have been a little lower.
Inter-Comparison and Evaluation of the Four Longest Satellite … – MDPI
https://www.mdpi.com/2072-4292/10/10/1567/pdf
Karl-Göran Karlsson * and Abhay Devasthale, 2018
“Interesting is that all CDRs show a slow but steady decrease in global cloud fraction amounting to approximately 1% per decade (Figure 3). Most of the decrease emanates from mid-latitude regions where also the different CDRs show the best mutual agreement (at least for the northern mid-latitude region in Figure 6) and significance of the trends ”
At the same time I think this may be in agreement with measurements of trends in TOA radiation out.
NK: Is this change in clouds too big to be real? Let’s hypothesize this change (-1%/decade) is an SWR feedback in response to global warming of 0.2 K/decade. Dividing the former by the latter gives a massive 5% reduction in clouds per 1 K of warming. If we apply this to the LGM (-6 K), that would be a 30% increase in cloud cover – roughly 100% cloud cover.
Now let’s convert a change in cloud cover into a feedback in term of W/m2/K. The planet reflects about 100 W/m2 of SWR to space, but part of that is from surface albedo, part is from Rayleigh scattering. According to CERES, clear skies reflect about 50 W/m2, so cloudy skies which cover about twice as much surface must reflect about 125 W/m2. So a 5%/K reduction in cloud cover would be +6.2 W/m2/K feedback. Assuming my calculations are correct, this would swamp Planck feedback (-3.2 W/m2/K) and produce a runaway GHE.
Let’s hypothesize that this change is a forcing (say due to an unrecognized reduction in cosmic rays. That forcing would be 3.8 W/m2, as bigger than the forcing from rising GHGs.
Accurately observing changes in clouds from space is a challenging task. The suspiciously large decreases that are reported and the inconsistencies between records suggest to me that systematic error may be involved. If not, our climate is far more unstable than the IPCC reports, because a huge amount of energy is involved.
I suppose it is possible that – as cloud cover is decreasing – cloud reflectivity is increasing. The key parameter is W/m2 reflected from the whole sky, not cloud fraction.
Thank you for a thoughtful answer, Frank. I think you are right in not seeing this as a feedback. And I think it my be wrong to see changes in clouds as trends. It looks like it is variations over decades. So how can we understand these changes?
Observations from surface tell us that cloudiness has been increasing during the 20th century, probably more over cooling decades. From Knutti and friends: “However, there is increasing observational evidence that this quantity undergoes significant multi-decadal variations, which need to be accounted for in discussions of climate change and mitigation strategies. Specifically, we noted a decrease of surface solar radiation from the 1950s to the 1980s in the worldwide observational networks (“global dimming”) and a more recent recovery (“brightening”)”. The lazy explanation of this is air pollution.
And why is global brightening seen as a result of changing temperatures? Is it possible that change in ocean currents and wind and rain patterns has some effects on clouds? The most intuitive explanation of global brightening is that the water cycle is becoming faster. And that this will result in global warming. As Roy Spencer tells us: ” For instance, natural fluctuations in atmospheric circulation patterns can alter global cloud cover by a small amount, thereby changing how much sunlight is allowed to reach the Earth’s surface. Or, circulation changes might result in small wind shear-induced changes in precipitation efficiency, thereby altering how much water vapor – our main greenhouse gas – is allowed to remain in the atmosphere. These natural fluctuations can cause warming or cooling.” And: “By ignoring natural, chaotic fluctuations in clouds, researchers have come to the (mistaken) conclusion that there is no need to look for clouds as a cause of climate change”. He calls it a circular reasoning.
Of course this was met with hostile attacks from the scientific establishment (Trenberth, Dressler, Fasullo and others). They didn`t like the “natural, chaotic fluctuations in clouds” as a force of climate variations, and that cloudiness has a multi-decadal effect on global climate. So 35 years of global brightening has no effect on global warming?
To the discussion of global brightening.
I think the debunking of Spencer was a pity. His ENSO explanation was clearly partly wrong, as brightening has another duration or cycle. And his model may be insufficient. But the ideas of brightening as a part of global warming deserve to be taken seriously. He estimates it to about 50%, and the GH gas effect to about 50%. We see that established scientists use science to tell us that the globe will warm 6 degC when CO2 level is about 1400ppm (and some says much earlier), because of global brightening. So in the future brightening will warm, but not now.
What is a pity is the polarization and politicization of science. And of course Spencer is into the same game. This stops every dialogue, and prevent the development of science. It was a golden opportunity in 2011 to go into the ideas of brightening and global warming. Then we could have learned more about cloud dynamics and change.
And I think Frank debunked the debunkers very effectively. He showed that global brightening is impossible, as a trend. Then it has to be natural and chaotic fluctuations. And according to the leading corps of climate science such multidecadal fluctuations are impossible. So the only way out is to dismiss observations. This is known tactics. We have seen Dessler refer to his belief system of climate models and “simple physics”. This is the trump card that has been played when observations become too annoying.
Can you name one single climate scientist who thinks multidecadal fluctuations are impossible? Nobody dismisses observations. Some people want to use observations as a weapon: final answer. Those people get dismissed.
Neither side plays fair with unforced/internal variability: Skeptics like Spenser attribute some warming to unforced variability in clouds (which IMO he mistakenly refers to as a forcing). The consensus says EBMs are wrong (in part) because internal variability has lead to a pattern of warming that lets heat escape to space more easily than in their models. (Others may disagree with this interpretation.)
There is no obvious limit on how much internal variability can change our climate. There is a huge reservoir of cold water in the deep ocean that could limit warming for centuries if chaotic fluctuations in overturning sped up that process. It is temporarily slowed in a part of the world during El Ninos, producing more warming in six months that rising CO2 produces in a decade. The only thing we have to go on is the record of unforced variability from the past century and 70 centuries of unforced plus naturally-forced variability during the Holocene. The magnitude and global extent of those fluctuations are highly uncertain. Antarctic ice cores and ocean sediment cores don’t show a MWP, RWP or Minoan WP. The LIA seems to be less than 1 degC in amplitude and the highest estimates of the change in TSI appear too small to explain the full cooling. There are lots of possible interpretations of the Holocene record of variability, but switching from belief in high variability to refute EBMs to low variability to refute other objections of skeptics or the consensus is problematic.
“Frank” said:
Who cares when the first order effect is externally forced variability?
JCH. “Can you name one single climate scientist who thinks multidecadal fluctuations are impossible?” I think I put it wrongly. Scientists look at multidecadal fluctuations. What seems impossible to imagine for these people is that these fluctuations can have big long lasing effects on climate. Who would dare to say that 50% of global warming since 1980 is a consequence of natural fluctuations, or even 20%?
switching from belief in high variability to refute EBMs to low variability to refute other objections of skeptics or the consensus is problematic.
But who has done that? Chen Zhou and Mark Zelinka? I don’t think so.
Frank, thanks for providing the non-paywalled link. I compared the draft with the accepted paper and could not find any valueable difference. However, IMO the “interested in science audience” here should have found the “golden key” to almost every paywalled paper. 🙂
What do you think about the “pattern argument” to downplay the observed (with EBM approaches of course) values of TCR/ECS as biased low? The two latest cited papers ( and the Dessler paper) could point to “models biased too warm”?
This paper is interesting IMO: https://www.nature.com/articles/s41558-019-0505-x . It suggests that the realised pattern for a low sesitivity (see also https://journals.ametsoc.org/doi/abs/10.1175/JCLI-D-18-0843.1 ) is a product of the forcing and not due to IV. The 1st linked paper also shows, that present models do not capture this result of the forcing and says in the conclusions:”However, the strength of the tropical Pacific influence on global climate implies that past and future trends will diverge from those simulated by coupled climate models that, due to their cold tongue bias, misrepresent the response of the tropical Pacific to rising CO2.”
IMO this is a strong argument for the reliabilty of TCR/ECS estimates deduced from obs.
I really doubt it. First they need to get the ENSO model correct. One of the authors of that paper is Cane of the Cane-Zebiak model which is a starting-point toy theory for ENSO. But that doesn’t really work, which is why they need to switch to a tidally-forced solution to Laplace’s tidal equations to get the ENSO model right. Only then can one start to isolate the natural external forcing from the mix.
frankclimate: Interesting papers. Thanks. You say: “It suggests that the realised pattern for a low sensitivity is a product of the forcing and not due to [internal variability]. The recent paper by Dessler with 100 historic MPI model runs also suggests that low ECS is not caused by internal variability. When their output was analyzed in terms of an energy balance model, none of the model runs had an ECS as low as observed with EBMs.
A non-paywalled non-peer reviewed version of your second reference is available here:
https://eartharxiv.org/tdrmx/download?format=pdf
frankclimate and Frank. Thank you for the reference. What I found very interesting is the pattern of ocean surface warming and the global consequences they postulate.
“Recent studies have argued that feedbacks are sensitive to evolving spatial patterns of surface warming, yet the underlying mechanisms accounting for this so-called pattern effect (Stevens et al. 2016) are not clearly established.”
“Importantly, SST warming in the western Pacific (a region of tropical ascent) drives strong remote responses on a global scale; while the responses to SST warming in the other three regions are more confined locally. For the west Pacific patch, warming is communicated to the upper troposphere, which warms the whole troposphere across all latitudes, causing a large increase in outgoing radiation at the TOA. Furthermore, the patch of warming locally decreases tropospheric stability, measured here as estimated inversion strength (EIS), but increases EIS remotely over tropical marine low clouds regions, yielding an increase in global low cloud cover (LCC) which enhances the global SW reflection (Wood and Bretherton 2006).”
“The results first highlight the radiative response to surface warming in tropical ascent regions as the dominant control of global TOA radiation change both in the past and in the future. We propose that, to a good approximation, global radiative feedback changes track the “warm pool warming ratio” (𝛾), defined here as the ratio of contribution to global TAS (global surface temperature) change from surface warming in the regions outside of the WP (Western Pacific) relative to the contribution from warming in the WP region alone. We found that historical TAS changes from the 1950s to 2000s are preferentially attributed to SST changes in the warm pool, i.e., 𝛾 is small over recent decades. This surface warming pattern yields a strong global outgoing radiative response at TOA that can efficiently damp the surface heating, therefore producing a very negative global feedback.”
Yue Dong, Cristian Proistosescu, Kyle C. Armour, David S. Battisti, you did a great job analyzing historical pattern effects. You have made us understand that the warm pool of western Pacific has worked as a climate thermostat. You didn`t need to play with your computer games ( called CAM4 and CAM5) to try to predict some future pattern and to try to save some positive cloud feedback. You will never get it right anyhow.
There is also a free available copy ot the Seager et al (2019) paper: https://www.researchgate.net/publication/334012764_Strengthening_tropical_Pacific_zonal_sea_surface_temperature_gradient_consistent_with_rising_greenhouse_gases .
It’s IMO the continuation of the Dong et al paper. It shows that the pattern with a low sesitivity (Dong:” These results suggest that only in the case that the western Pacific warming keeps warming at a greater place than the rest of the
global oceans can we expect ICS to remain as low as that derived from recent energy budget constraints (e.g., Otto et al. 2013; Lewis and Curry 2015; 2018; Armour 2017; Knutti et al.2017).”) is a result of the forcing and not randomly.
Seager: ” However, the strength of the tropical Pacific influence on global climate implies that past and future trends will diverge from those simulated by coupled climate models that, due to their cold tongue bias, misrepresent the response of the tropical Pacific to rising CO2. ”
IMO this is a strong hint that the sensitivity EBM-approaches , i.e. https://www.nicholaslewis.org/wp-content/uploads/2018/05/Lewis_and_Curry_SI_JCLI-D-17-0667a.pdf
are NOT biased low but GCM approaches are biased HIGH. Curious to read about this in AR6.
I had the pejudice that climate scientists have great problem with interdecadal, natural and chaotic variability. I now see that Yue Dong et al present a multidecadal surface warming over 50 years in Western Pacific, which gives rise to negative global feedbacks. I can`t help thinking that it is easier for the IPCC orthodoxy to believe that negative feedback will turn to more positive than positive feedback will turn negative.
So western Pacific will have a global cooling contribution. And other places on earth will surely have 50 years of warming contribution (less TOA radiation).
One more confirmation that the observed pattern is a result of the forcing and not “one of many possible patterns” :https://www.nature.com/articles/s41558-019-0531-8 . The obs. SLRA has a main source in the strengthening of the westerlies since the 60s leading to the intesified upwelling in the east and generating the obs. pattern of warming.
All these measurements are based on tide-gauge records. You would think from the name alone it”s likely that all the patterns of natural variability are due to tidal cycles.
For example: https://geoenergymath.com/2019/08/04/north-atlantic-oscillation/
Alas, it’s not that easy a task to make the connection, as first things first, you have to understand how to solve Laplace’s Tidal Equations, which like Navier-Stokes (from which they derive) are completely under-determined and thus require an ansatz to make any headway with.
And that’s only the start. It will be a while before you guys catch up.
All the patterns are tidal. Next, the Indian Ocean Dipole. Take it to the forum — https://forum.azimuthproject.org/discussion/comment/21167/#Comment_21167
Nine distinct climate indices — ENSO, QBO, AMO, PDO, IOD, NAO, AO, SAM, PNA — all modeled with the same tidal forcing.
The key is in solving Navier-Stokes, described here
https://agupubs.onlinelibrary.wiley.com/doi/10.1002/9781119434351.ch12
To the intensification of the water cycle.
Some correlation with global brightening?
From: Ocean Salinity and the Global Water Cycle, Paul J. Durack, 2015. “Although poor observational coverage and an incomplete view of the interaction of all water-cycle components limits our understanding, climate models are beginning to provide insights that are complementing observations. This new information suggests that the global water cycle is rapidly intensifying.”
https://tos.org/oceanography/article/ocean-salinity-and-the-global-water-cycle
And what with the intensification of rainfall for the last 40 years? A part of the intensification of the water cycle?
Clive Best has looked into it through his analysis of precipitation measurements from about 100,000 weather stations back to 1780.
And you can see it in BoM Annual rainfall anomaly – Global (1900 – 2014).
I think this shows the greater picture of “natural, chaotic fluctuations” that clouds can be a part of.
Further remarks to the intensification of the water cycle.
Interesting estimates of water cycle change, and some consequences. Illustrating some pattern effects on oceans, surface salinity pattern amplification (PA; %)
“We have estimated PA based on the most recent objectively analysed hydrographic observations for periods 1957 to: 1985; 1995; 2005 and 2016. Between 1957 and 2016, the surface salinity pattern amplified by 5% ± 1.1%. Having inferred the contributions to PA from surface ocean warming and ice mass loss, we subtract these from the observed PA up to 2016. The resulting residual PA is 2.04% ± 1.2% over 1957–2016 (figure 4(b)), which we attribute to water cycle change.”
From: Improved estimates of water cycle change from ocean salinity: the key role of ocean warming
Jan D Zika, Nikolaos Skliris, Adam T Blaker, Robert Marsh, A J George Nurser and Simon A Josey, Published 19 July 2018.
https://iopscience.iop.org/article/10.1088/1748-9326/aace42
Some natural, chaotic fluctuations in rainfalls and ocean salinity pattern?
And if I am not quite wrong this salinity pattern change has an amplification effect on surface temperatures, like a positive feedback, as long as the pattern last.
And we find the greatest pattern changes in ocean circulation. And not even multidecadal, but multidecennial variations. “Gulf Stream system at weakest point in 1,600 years”.
“The Atlantic meridional overturning circulation (AMOC) plays an essential role in climate through its redistribution of heat and its influence on the carbon cycle. Short observational datasets preclude a longer-term perspective on the modern state and variability of AMOC, for which we must therefore use paleoclimate reconstructions. Here, we use sediment grain size analysis and reconstruction of the AMOC surface temperature fingerprint to examine Holocene changes in the AMOC and its constituent components. We reveal that the AMOC has likely been anomalously weak over the past 150 years (since the end of the Little Ice Age, LIA; 1850 CE), and is associated with exceptional surface and deep ocean circulation patterns.”
And more “natural, chaotic fluctuations” ? Or trends?
“However, a team of researchers from University College London (UCL) and Woods Hole Oceanographic Institution (WHOI) have offered evidence from marine sediment that the AMOC is currently at its weakest point in the past 1,600 years.
Another study from the Potsdam Institute for Climate Impact Research (PIK) used climate model data and historical records of sea surface temperatures to reveal that the AMOC has been rapidly weakening since 1950 as a result of rising temperatures linked to global warming.
Both studies, which will be published together in the April 12 issue of Nature, strongly suggest that the AMOC has weakened over the past by 150 years by at least 15 percent to 20 percent.”
As I understand it, the “pattern of warming” argument says that warming (which EBMs say is too low) has been biased by natural variability into delivering too much heat to locations where it can easily escape to space. This argument diverts attention from the real issues, which is global, not regional. High ECS is mathematically equivalent to saying that average global climate sensitivity is low: that on average only 1 more W/m2 is emitted and reflected to space for every degK increase in the global temperature anomaly (Ts). EBMs are saying that the average increase is 2 W/m2/K, possibly even 2.5 W/m2/K. The global average climate sensitivity parameter is, of course, a composite of the climate feedback parameter at all locations on the planet. There is no mechanism that keeps warming away from regions where it more easily escapes to space. Heat that has already escaped to space can’t be “used” in future decades to warm regions where it is more difficult for heat to escape to space – where it should have been warming more the past half century. Heat CAN be stored and released via fluctuations in ocean heat uptake and (IMO) this is the major source of unforced variability. The “pattern of warming” argument seems to require an unusual pattern of ocean heat uptake too.
ECS = F_2x * dT / (dF – dQ)
At any point in time, the forcing we are currently experiencing (ca 2.5 W/m2) has two “destinies”. Part of that forcing has already caused some warming (ca 1 K) that has reduced the imbalance at the TOA through greater emission of LWR and changed reflection of SWR. The rest of that forcing is going into warming the ocean and melting ice. ARGO says that about 0.8 W/m2 is going into such heat uptake, leaving an addition 1.7 W/m2 to have been “driven” out to space by slightly less than 1 K of warming. This is how is EBMs produce an ECS of 2 K or less. If natural variability has been directing warming to regions where heat more easily escapes to space, then, when conditions return to “normal”, ocean heat uptake should rise to the equivalent of 1.5 W/m2. However, the average AOGCM suggests ARGO’s ocean heat uptake is about right, not too low. Unfortunately, the ARGO record of ocean heat uptake covers only a small fraction of the period when forcing and temperature have been rising “rapidly”: roughly 0.4 W/m2/decade and 0.17 K/decade.
Some remarks to the pattern of deep ocean warming and cooling. Where do the heat go, and when?
Understanding the Recent Global Surface Warming Slowdown: A Review
Ka-Kit Tung, and Xianyao Chen, october 2018.
The general conclusion is : “Observed subsurface ocean heat content data show that the major sinks of heat are in the North Atlantic and the Southern Ocean, accounting for a majority of the heat stored in the intermediate layers of the world’s oceans, although the debate continues regarding whether it is the Pacific-Indian oceans on one side or Atlantic-Southern Oceans on the other side that is mostly responsible for causing the warming slowdown. Regardless, the result so far favors the explanation of the warming slowdown as an internal variability of the ocean’s ability in storing the heat that otherwise would have warmed the surface more.”
“The interdecadal and multidecadal behavior can be better revealed a few hundred meters under the ocean surface, since interannual surface variations tend to have shallow subsurface manifestations. Which ocean should we look at to find the subsurface signal?”CAL
“In the Atlantic, the multidecadal variability in the SST is understood from modeling studies to be caused by the variations of subsurface AMOC. “Water hosing” experiments of Zhang et al. suggest that freshening of subpolar North Atlantic waters can lead to a slowdown of AMOC and a cooling of the surface temperature under preindustrial conditions. In the presence of top-of-atmosphere radiative imbalance, Chen and Tung showed using subsurface ocean data, including salinity and ocean heat content, that as the AMOC sped up during 1999–2005, it subducts heat in the subpolar latitudes of the North Atlantic. That this is a period of increasing overturning in the Atlantic was previously calculated by Willis using satellite altimetry data available since 1993. The proposed mechanism is as follows: As AMOC speeds up, it brings the warmer and more saline subtropical surface water to the sub-polar latitudes of the Atlantic, where it loses part of its heat to the cold atmosphere and sinks due to its saltiness. The heat released by the warm water to the atmosphere melts glacier ice over Greenland and the surrounding areas bounding the North Atlantic, gradually leading to a freshening of the North Atlantic water that eventually slows the sinking. As AMOC slows, its northward transport of heat slows and the freshwater outflow from glacier ice melt is reduced. Salinity and hence density of the seawater build up slowly over decades, until it is dense enough to initiate another speeding up of the AMOC. In this way the AMOC alternately speeds up and slows, taking approximately 60–70-years for a full cycle, leading to warmer and colder AMO at the sea surface with the same multi-decadal variations.”
This contradict the iconic view that speed-up AMOC contribute to global warming. And that stagnation brings us to “The day after tomorrow”. And when Chen and Tung presented their findings as natural fluctuations, and meant that the anthropogenetic component was small, it became too heavy for the scientist establishment to digest. The grand orthodox elite corps of IPCC/ Real Climate had to debunk the poor fellows Chen and Tung, with Stefan Rahmstorf and Michael Mann as front soldiers. With their noses deep into models that showed that AMOC slowing is man-made. And clearly they didn`t manage to understand the value of the contribution to patterns and natural variations that was given.
Some correction is needed. Rahmstorf and Mann were attacking a paper that was presented in Nature, july 2018. This was a shorter version of the paper above:
Global surface warming enhanced by weak Atlantic overturning circulation Xianyao Chen & Ka-Kit Tung
There they states: “Evidence from palaeoclimatology suggests that abrupt Northern Hemisphere cold events are linked to weakening of the Atlantic Meridional Overturning Circulation (AMOC)1, potentially by excess inputs of fresh water. But these insights—often derived from model runs under preindustrial conditions—may not apply to the modern era with our rapid emissions of greenhouse gases. If they do, then a weakened AMOC, as in 1975–1998, should have led to Northern Hemisphere cooling. Here we show that, instead, the AMOC minimum was a period of rapid surface warming. More generally, in the presence of greenhouse-gas heating, the AMOC’s dominant role changed from transporting surface heat northwards, warming Europe and North America, to storing heat in the deeper Atlantic, buffering surface warming for the planet as a whole. During an accelerating phase from the mid-1990s to the early 2000s, the AMOC stored about half of excess heat globally, contributing to the global-warming slowdown. By contrast, since mooring observations began in 2004, the AMOC and oceanic heat uptake have weakened. Our results, based on several independent indices, show that AMOC changes since the 1940s are best explained by multidecadal variability, rather than an anthropogenically forced trend. Leading indicators in the subpolar North Atlantic today suggest that the current AMOC decline is ending. We expect a prolonged AMOC minimum, probably lasting about two decades. If prior patterns hold, the resulting low levels of oceanic heat uptake will manifest as a period of rapid global surface warming.”
Reaction from Rahmstorf and Mann: “Established understanding of the AMOC (sometimes popularly called Gulf Stream System) says that a weaker AMOC leads to a slightly cooler global mean surface temperature due to changes in ocean heat storage.”
The criticism from Rahmstorf and Mann:
“And as our regular Realclimate readers know very well, the distinction of phases of fast global warming up to 1998 and slow warming from 1998 is highly questionable. ”
“If the rate of thermohaline overturning slows down, then heat diffusion gains the upper hand and the deep ocean warms. If it speeds up, the opposite happens and the deep ocean cools. Model simulations show that this is true for decadal variability (e.g. Knight et al. 2005) as well during global warming (e.g. Liu et al. 2017).”
“On the mechanism for why a strong AMOC would heat rather than cool the deep ocean, Chen and Tung write: “Deep convections can now carry more heat downward.” (Deep convection is the vertical mixing process at the beginning of deep water formation.) That should make anyone familiar with the conditions in the subpolar Atlantic stop. Isn’t deep convection thermally driven there, by surface water becoming colder and thereby denser than the deep water? After all, this is a region of net surface freshwater input, from precipitation, river runoff and ice melt, so in the convection areas the surface water is fresher than the deep water, which inhibits convection. Thermally driven convection moves heat upwards, not downwards.”
“Chen and Tung do not show any models simulations either to provide evidence that their mechanism can actually work, neither do they discuss the various published model results that have come to the opposite conclusion.”
I think Chen and Tung show patterns of warming and cooling of deep ocean that Rahmstorf and Mann cannot explain with their models and theories.
And the criticism has been repeated:
The effects of an AMOC slowdown on global surface warming
Levke Caesar, Stefan Rahmstorf, and Georg Feulner.
Geophysical Research Abstracts EGU General Assembly 2019:
“Accounting for the effect of changes in the radiative forcing on GMST we test how AMOC variations, by affecting the heat transport to the deep ocean, correlate with the remaining part of surface temperature changes. The resulting correlation is strongly and significantly positive with warm GMST anomalies correlating with a strong AMOC.
These results agree with Knight et al. (2005) who likewise found a positive correlation between the AMOC strength and global as well as northern hemisphere temperature, but they contradict the study of Chen and Tung (2018) who suggested that during the past decades a strong AMOC coincided with warming of the deep ocean and relative cooling of the surface. The positive correlation between AMOC strength and surface warming also matches the fact that the decline of the AMOC over the last decade (Caesar et al., 2018) coincided with an increase in the rate of ocean heat uptake, and suggests a possible damping effect of a future AMOC slowdown on global surface warming.”
Mann and Rahmstorf conviction:
“Accounting for the effect of changes in the radiative forcing on GMST we test how AMOC variations, by affecting the heat transport to the deep ocean, correlate with the remaining part of surface temperature changes. The resulting correlation is strongly and significantly positive with warm GMST anomalies correlating with a strong AMOC.”
We can just look at the graphs, and see how it fits. GMST shows the hockeystick shape, and AMOC shows the hockeystick shape upside down (using Mann and Rahmstorf index). And it will continue into the future, with the blade of the hockeystick even steeper. We can see a picture of positive feedbacks folding out in the North Atlantics the next hundred years.
So the AMOC slowdown as a necessary part of dangerous global warming, in the iconic shape of the hockeystick turned down, has become meme for parts of the scientific community.
NK: The article you cite suggest that unforced variability in force warming arises from the AMOC which controls some of the heat exchange between the surface and the deep ocean. This (2013) Nature paper by Kosada and Xie shows that natural variability (in particular, the hiatus) is driven unforced variability in the Eastern Equatorial Pacific. A climate model forced to match observed temperatures in roughly the NINO3.4 region (8.2% of the Earth’s surface) caused natural variability elsewhere on the planet in both temperature and rainfall to agree much more closely with observations. The article focuses on a cold Eastern Equatorial Pacific as the explanation for the 0.20 K of missing warming from 2002-2012, but the supplemental material table shows that an unusually warm Eastern Equatorial Pacific could explain an additional 0.14 K of warming between 1971 and 1997. (This additional 0.14 K of warming is mentioned in only one sentence in the paper and the quantitative information is only found in the supplemental material.)
Click to access Kosaka%26Xie2013.pdf
https://www.nature.com/articles/nature12534
https://www.nature.com/articles/nature12534/tables/1
Changes in the NINO3.4 region are obvious linked to variations in upwelling of cold water off the coast of South American and subsidence in the West Pacific Warm Pool. I’d like to understand how much heat was added to or removed from the region forced with observed SSTs. I would have preferred that this heat was redistributed everywhere else on the planet rather than vanishing (across the TOA).
My point is that there are multiple places on the planet where variations in heat exchange with the deep ocean potentially can modulate unforced variability in climate. Since we are dealing with chaotic ocean currents, mechanisms that appear to work in some periods may fail in other periods or turn out to be part of a much larger picture.
Abstract: Despite the continued increase of atmospheric greenhouse gases, the annual-mean global temperature has not risen in this century [as of 2013] challenging the prevailing view that anthropogenic forcing causes climate warming. Various mechanisms have been proposed for this hiatus of global warming, but their relative importance has not been quantified, hampering observational estimates of climate sensitivity. Here we show that accounting for recent cooling in the eastern equatorial Pacific reconciles climate simulations and observations. We present a novel method to unravel mechanisms for global temperature change by prescribing the observed history of sea surface temperature over the deep tropical Pacific in a climate model, in addition to radiative forcing. Although the surface temperature prescription is limited to only 8.2% of the global surface, our model reproduces the annual-mean global temperature remarkably well with r = 0.97 for 1970-2012 (a period including the current hiatus and an accelerated global warming). Moreover, our simulation captures major seasonal and regional characteristics of the hiatus, including the intensified Walker circulation, the
winter cooling in northwestern and prolonged drought in southern North America. Our results show that the current hiatus is part of natural climate variability, tied specifically to a La Niña-like decadal cooling. While similar decadal hiatus events may occur in the future, multi-decadal warming trend is very likely to continue with greenhouse gas increase.
I think the geographical patterns of warming and cooling are interesting. Perhaps especially the North Atlantic, Eastern Pacific and Western Pacific. I saw Isaac Held had a comment on the Kosaka and Xie paper. The cause of the pause. Isaac M. Held, Nature, September 2013
https://www.nature.com/articles/501318a.
As a part of the pattern, the season variations are important to. “The flat annual-mean-temperature trend during the hiatus consists of distinct cooling centred in the Northern Hemisphere winter, especially over land, and warming or little change in other seasons. This seasonal cycle of global temperature trends is roughly captured by the constrained model, providing further support for the central influence of the equatorial Pacific in the hiatus.”
I think the answers we have got are bits of the puzzle.
This cooling that Held tell us about, could it be a part of global brightening in the north hemisphere winter?
There are geographical patterns and timepatterns of ocean heat uptake. Tung and Chen pay much attention to to this.
“Atlantic was not the only ocean that was sequestering heat during this period. The subsurface ocean heat content in the Southern Ocean was observed to increase at least since 1993. We will show in Section 3 that while the Pacific and the Indian Oceans dominate the horizontal exchanges of heat in the upper 300 m, the Atlantic and the Southern Ocean dominate the vertical redistribution. They accounted for about 70% of the global heat storage increase in the 200–1500 m layer during 2000–2014, divided between the North Atlantic, which is dominant before 2005, and the Southern Ocean after 2005. The subsurface warming in the Southern Ocean started at least since 1993, and was attributed to the southward displacement and intensification of the circumpolar jet [13], caused in large part by the Antarctic ozone hole [14]. North Atlantic’s role appears to be cyclic on decadal timescales, with AMOC in an accelerating phase before 2005.”
They show how heat in these oceans comes and goes. I am surprised that equatorial oceans contribute so little to deep ocean warming, so I can understand that Rahmstorf was attacking the “sequestering of heat” in ocean currents: “Thermally driven convection moves heat upwards, not downwards.” This is really hard to understand, Stefan.
Ka-Kit Tung and Xianyao Chen, October 2018
https://www.mdpi.com/2225-1154/6/4/82/htm
Something more on the “sequestering of heat” in oceans. and the global energy budget seen from polar areas. The pattern of Antarctica heat transport:
“The Southern Ocean is a central component of the global ocean heat uptake, of Earth’s energy imbalance, and of global warming. Its complex circulation, which connects all ocean density layers to the sea surface, makes it a unique place on Earth to facilitate the transfer of heat from the atmosphere to great depths, where the heat is stored for decades to millennia. However, warming of the Southern Ocean is not homogeneous. In particular, the surface of the ocean in the subpolar regions is not warming and is not predicted to warm at a pace similar to other regions in the coming century. The subpolar regions therefore constitute a very large excess heat sink due to the decoupling of atmospheric warming from stable or slower warming of the subpolar surface ocean. This largely explains why Southern Ocean heat uptake is estimated to account for more than 70% of the global ocean’s heat uptake.”
Sallée, J.-B. 2018.
https://tos.org/oceanography/article/southern-ocean-warming
Poor Jean-Baptiste, How can you say such a thing? Don`t you know the Real Climate consensus? There is no such thing as ocean downwelling heat sink. As Stefan put it: “Thermally driven convection moves heat upwards, not downwards.”
Or ? —
NK,
So if heat only moves up, then how does the heat content of the top 2,000m of the ocean increase? Well, for one, heat moves from hot to cold, and the deep ocean is colder than the surface. Thermally driven convection is also not the only way for heat to move. There’s also eddy diffusion, which is orders of magnitude faster than molecular diffusion and is much more important in the ocean than the atmosphere. It’s eddy diffusion acting against upwelling cold water that causes the thermocline.
So Mann and Rahmstorf manage to convince their followers about the history and fate of AMOC. But then it becomes clear that there is plenty of doubt in the climate science community. Everybody is not impressed by their version of AMOC, the Mann and Rahmstorf AMOC (MaRAMOC). The index is built on Surface temperatures. Simple subtraction of Notrth Hemisphere temperatures from a certain subpolar area temperatures. North Hemisphere temperatures is an important part of global temperatures, and follow these closely, and the subpolar temperatures show a kind of AMO variation but no clear trend the last hundred years. The historical and predicted values of AMOC is nothing but a variance of global warming itself. That the index is tested against some proxies doesn`t make any difference. The correlation between AMOC and global warming, that Mann and Rahmstorf use as a proof aginst Tung and Chen, is a correlation between a customized North Hemisphere warming and Global warming.
NK cited others saying: “There is no such thing as ocean downwelling heat sink.”
As DeWitt points out, conduction of heat in the ocean by thermal diffusion (molecular collisions) is absurdly slow. So transport of heat must be (mostly) by bulk motion of water = convection. One important form of convection is the eddy diffusion mentioned by DeWitt. Another is the MOC. Such transport carries both heat and molecules. About 70 years ago, we started releasing significant amount of CFCs into the atmosphere, which dissolved in the ocean. There are very sensitive detectors for CFCs that make it easy to detect and quantify in the ocean. Therefore we have a way to detect the bulk motion of water – and the heat it contains – over the past 70 years. If any heat escapes a parcel of water by thermal diffusion, CFCs are escaping that parcel by molecular diffusion at a similar rate. There are many papers showing where and how deep in the ocean CFCs – and therefore surface heat – has penetrated over the last 70 years..
(The era of atmospheric testing of atomic weapons released large amounts of C14 that has also been used to track the bulk motion of ocean water, but carbon (dioxide) is not inert and gets taken up by photosynthetic plankton.)
When trying to determine what controls the temperature of a location, it is easy to mistakenly focus only on the direction of the net flux of heat from hot to cold. In reality, all fluxes (of energy) are two-way and ignoring the non-thermodynamic energy flux leads to mistakes. (This is an opinion, and contradictory opinions would be appreciated.) In the case of convection, one parcel of water can move down only if another parcel of water moves up. Photons travel from the cooler atmosphere to the warmer surface (DLR) and more photons travel from the warmer surface to the cooler atmosphere (OLR). Only the net flux obeys the 2LoT. Ignoring changes in DLR leads to the mistaken idea rising CO2 can’t warm the planet. At a molecular level, all heat fluxes are two-way fluxes, which results in the rate of thermal conduction through solids (like the crust) depending on the temperature difference between two surfaces (the hotter mantle AND the cooler surface) – not just on the high temperature of the mantle “driving” heat to the surface. Thus boreholes can tell us about surface temperature centuries ago. The latent heat flux associated with evaporation is a two-way process, which explains why no net evaporation occurs when the air is saturated with water vapor. The upward flux of water molecules doesn’t stop at saturation; the downward flux of water molecules increases with the absolute humidity of air and is equal to the upward flux at saturation. Thus the rate of evaporation depends on the “undersaturation” of air above water.
In the case of oceans and large lakes, colder water is denser and it sinks to the bottom. The bottom water of oceans and lakes is roughly the same temperature as the coldest surface water – which is found in the Antarctic. Salty ocean water gets denser until it freezes at -1.9? degC. The water at the bottom of Crater Lake (the deepest in the US) is about 4 degC, the temperature at which fresh water has the greatest density. It sinks to the bottom in the winter. In both cases, when water is sinking to the bottom, water elsewhere must be rising to replace it.
Frank says:
No, no, no. James Hansen wrote about vertical eddy diffusion back in 1981. This has about the same value as the diffusivity of copper ~1 cm^2/sec. Of course this isn’t molecular diffusion but a random walk of heat up and down the vertical column. This is used to generate a heat profile extending from the surface downwards.
Most of this stuff has been figured out long ago. Maybe you want to discuss some new patterns?
geoenergymath,
“No, no no..”
I think you are confused. Because your comment makes no sense. Vertical eddy diffusion is by turbulent motion, i.e., the convection that Frank mentions.
The values calculated depend on the actual motion of the ocean in 3D. There isn’t one value of this “parameter”. In fact, there is no useful theoretical value, or set of values, that can be derived. Only empirical fits to data.
Well if you want to do the math correctly then you have to separate motion by diffusion vs motion by advection. This is related to the reason why all these first-order models of OHC fail — because they don’t incorporate the divergence term and never see the fat-tail of heat uptake. A fat-tail is typically a diffusional (i.e. random walk) effect and like I said, something that Hansen understood in 1981, but keeps on getting overlooked by armchair analysts such as Nic Lewis.
Tell me about it. Obviously there isn’t one value of effective diffusion coefficient that’s operational, and doing the math for a range of values (according to maximum entropy) actually simplifies the formulation (which is a nasty erf result). I have that described here
https://agupubs.onlinelibrary.wiley.com/doi/10.1002/9781119434351.ch14
Geoenergymath wrote: “James Hansen wrote about vertical eddy diffusion back in 1981. This has about the same value as the diffusivity of copper ~1 cm^2/sec. Of course this isn’t molecular diffusion but a random walk of heat up and down the vertical column. This is used to generate a heat profile extending from the surface downwards.”
And later: “Well if you want to do the math correctly then you have to separate motion by diffusion vs motion by advection. This is related to the reason why all these first-order models of OHC fail — because they don’t incorporate the divergence term and never see the fat-tail of heat uptake.”
If I understand correctly, the eddy diffusion associated with large ocean gyres can be correctly modeled with the grid cells in today’s models. The eddy diffusion associated with eddies roughly the size of a grid cell and smaller must be parameterized. The units on these parameters (cm2/sec) are the same as used for thermal diffusivity in solids – even though eddy diffusion is the result of bulk convection and thermal diffusivity (in solids and fluids) is normally mediated by molecular collisions. Thermal diffusivity in liquids without bulk flow is closely related to molecular diffusivity in liquids. However, molecular collusions and molecular diffusion are negligible processes within or between grid cells compared with bulk flow. Since the ocean is stably stratified by density, eddy diffusion is first calculated on slanted surfaces of equal density (isopycnal) and then transformed into a vertical flux.
The MOC obviously mixes the shallow and deep oceans, but there may not a significant amount of heat transport associated with the MOC because global warming may not have raised the temperature of the water that is subsiding in polar regions (or the temperature of water that is upwelling). Finally there is turbulence that transports heat vertically associated with ocean currents and tides flowing over the irregular ocean floor.
If I understand correctly, vertical heat flux in AOGCMs from large scale eddy diffusion, parameterized eddy diffusion, turbulent mixing due to the ocean floor and possibly the MOC are combined to produce one overall parameter for the average vertical heat flux in the ocean. That parameter varies by a factor of 2 between models. In 1981, however, Jim Hansen took none of this into account. He simply used one-box (for the heat content of a simple mixed layer) or a two-box model for the heat content of the mixed layer and thermocline (with a thermal diffusivity of 1 cm2/s connecting them). See Fig 1.
Click to access hansen81a.pdf
Beginning with CMIP3, historical emissions of CFCs have been added to the atmosphere and followed as they dissolve into the ocean (much more in colder water) and then are transported by the same bulk-flow processes discussed above that transport heat. The concentrations of CFCs predicted by models have been compared to observations. The uptake of CO2 by the ocean is controlled by the same principles as CFCs, but is pH dependent and depends on the ocean’s buffer capacity (total alkalinity). CO2 is also sequestered by photosynthesis. Now that RCPs have replaced emissions scenarios, projections are driven by postulated forcing, not postulated emissions net of uptake by the ocean and other sinks.
https://journals.ametsoc.org/doi/full/10.1175/JCLI3758.1

Fig. 6. CFC-11 penetration depth = the column inventory divided by the surface concentration: (a) Observations, (b) ocean-alone Ocn run [AOGCM forced with rising SST (c) mean of the ESb, ESg, and ESh runs, [forced with rising GHGs].
Geoenergymath also wrote: “Well if you want to do the math correctly then you have to separate motion by diffusion vs motion by advection. This is related to the reason why all these first-order models of OHC fail — because they don’t incorporate the divergence term and never see the fat-tail of heat uptake. A fat-tail is typically a diffusional (i.e. random walk) effect and like I said, something that Hansen understood in 1981, but keeps on getting overlooked by armchair analysts such as Nic Lewis.
And continued: “Obviously there isn’t one value of effective diffusion coefficient that’s operational, and doing the math for a range of values (according to maximum entropy) actually simplifies the formulation (which is a nasty erf result). I have that described here
https://agupubs.onlinelibrary.wiley.com/doi/10.1002/9781119434351.ch14
Nic Lewis and dozens of supporters of the consensus use energy balance models (conservation of energy) to convert observed transient warming (TCR), estimated anthropogenic and natural forcings perturbing our planet, and the observed rate of ocean heat uptake into an effective ECS. Unlike the parameterized ocean heat uptake in AOGCMs (which can be tuned so that transient warming will agree with observed warming), EBM’s rely on real measurements of ocean heat uptake by ARGO. So your complaints are relevant to AOGCMs, not EBMs.
The beauty of EBMs is their simplicity and their reliance on measurements, not parameters. The heat capacity of the atmosphere and land surface is low enough that they would begin warming in response to imbalance at the TOA at an initial rate of more than 2 K/year if there were no ocean heat uptake. Basically, their heat capacity is negligible. So, at any point in time, the heat being retained somewhere in our climate system because of a forcing is going two places – 1) into the ocean and 2) out to space due to higher temperature increasing OLR and modified reflected SWR. The change in net flux across the TOA with temperature is the climate feedback parameter measured in W/m2/K. F_2x (ca 3.5 W/m2/doubling) plus the climate feedback parameter gives climate sensitivity (K/doubling). The only limitation is the assumption that unforced warming/cooling is negligible and observed warming is all forced warming. Fortunately, estimates of TCR don’t seem to vary much with time, suggesting that unforced temperature change is a minor problem.
Wrong. By incorporating diffusion with a 1 cm^2/s term, James Hansen did an infinite slab model and did it correctly, instead of this one-box or two-box junk that Nic Lewis is doing.
You don’t “connect” one box with another via a diffusivity term. When you decide to use D then you either do the complete slab model numerically or you can use the analytical form, involving erf formulations or the simplified form that I have described elsewhere.
Geoenergymath wrote: “Well if you want to do the math correctly then you have to separate motion by diffusion vs motion by advection. This is related to the reason why all these first-order models of OHC fail — because they don’t incorporate the divergence term and never see the fat-tail of heat uptake. A fat-tail is typically a diffusional (i.e. random walk) effect and like I said, something that Hansen understood in 1981, but keeps on getting overlooked by armchair analysts such as Nic Lewis.”
Frank replied with a long comment amateurishly discussing mechanisms by which bulk motion of water transports heat from the surface into the ocean. The reference linked below analyzed six separate mechanisms in three AOGCMs: advection, convection, mixed layer turbulence, eddy-induced advection, isopycnal diffusion and diapycnal diffusion. Figure 1 shows each model uses different mechanisms to different extents at different depths. In CMIP5 models, total heat uptake in historic runs from 1971 to 2005 ranged from and 8 to 36*10^22 J. (AR5 WG1 Figure 9.17) Ocean heat uptake – and the related, more-critical ocean uptake of CO2 – appear to be another aspect of “settled climate science” with large uncertainties
https://journals.ametsoc.org/doi/pdf/10.1175/JCLI-D-14-00235.1
In a separate comment, I noted that the energy balance models used by dozens of researchers (including Lewis) relied on observations of warming of the ocean, but AOGCM’s did need to get all of these mechanisms right and some require parameterization. And, in 1981, Hansen didn’t model any mechanisms of ocean heat uptake.
Now geoenergymath claims I misrepresented Hansen’s work: “Wrong. By incorporating diffusion with a 1 cm^2/s term, James Hansen did an infinite slab model and did it correctly, instead of this one-box or two-box junk that Nic Lewis is doing. You don’t “connect” one box with another via a diffusivity term. When you decide to use D then you either do the complete slab model numerically or you can use the analytical form, involving erf formulations or the simplified form that I have described elsewhere.”
Hansen’s publication dealt with several 1-dimensional models for the planet. 1-D models do have infinite slabs in the horizontal directions. However, Hansen himself referred using “box diffusion model[s]” on p 595. “Figure 1 : “Heat is rapidly mixed in the upper 100 m of the ocean and diffused to 1000 m with diffusion coefficient k”. k is either 1 cm2/s or infinity. That figure had two 1-box models for the ocean and two 2-box models for the ocean. So the brilliant James Hansen is using the same box models as the disdained Nic Lewis. And Hansen’s diffusion coefficient of 1 cm2/s, was derived (with significant uncertainty) from box diffusion models of analyzing ocean uptake of C-14 carbon dioxide and tritium.
Well, it’s pretty obvious if someone includes the diffusion correctly since all you have to do is look for the fat-tails on the uptake. With Hansen’s work, one can immediately see this, but with Nic Lewis, all you find is the incorrect first-order (i.e. damped exponential response) uptake.
Got around to comparing the recently released HADSST4 to HADSST3 and CMIP for the time periods used in the last L&C EBM paper.
SST Delta: 1869-82—->2007-16
HADSST3 – 0.62
HADSST4 – 0.71
RCP6 mean (KNMI) – 0.64
Hard to get too worked up about EBM vs models based on this comparison.
Chubbs: There is roughly a 2-fold difference between ECS from AOGCMs and EBMs. A 17% increase in observed SST warming over 70% of the planet (12% increase) isn’t going to close that gap. And Nic Lewis used warming from HadCRUT both with and without the corrections by Cowtan and Way. So L&C probably have results that include most of this correction.
I’d say that warming over the last half-century (or 65-years for LC) is what really matters. The bulk of forcing has developed over this period and we have much better data for this period. Older data is inherently more ambiguous and personal experience with commenting with a scientist you homogenizes data makes me worried that these continuous upward revisions could be at least partial due to unconscious confirmation bias. So I’m more interested in how revisions effect data for the last half-century.
Any agreement between observed modeled warming is fairly meaningless. Models disagree nearly two-fold about the effective radiative forcing produced by doubling CO2, yet somehow produce similar hindcasts of current warming. One can tune the parameters of a model with an ECS of 1.5, 2.5, 3.5, 4.5 or 5.5 K to produce 0.64 K of SST warming simply by adjusting the aerosol indirect effect and adjusting the rate at which heat penetrates the deep ocean. Looking at this from the energy balance (or conservation of energy) perspective:
ECS = F_2x * dT/(dF-dQ)
dT = (ECS/F_2x) * (dF-dQ)
A larger aerosol indirect effect makes dF (and therefore dT) smaller. Increasing ocean heat uptake makes dQ larger and dT smaller. These changes have little impact on projections of future change because RCPs assume anthropogenic aerosol will become negligible and dQ goes to zero as temperature reaches a new steady state. I’m not saying all models are tuned so blatantly, but tuning is an ad hoc process and modelers are making many decisions about parameters without unambiguous reasons.
Frank
Yes the recent period is most important and models do a much better job of matching recent temperature trends than EBM. EBM are only predicting a 0.13C/decade vs the 0.19C/decade since 1975 in observations with full global coverage (GISS, BEST, C+W). Note that 0.19C/decade guarantees ECS >2C, since manmade forcing is only increasing at 0.095 2XCO2 per decade.
Aerosols are more problematic for EBM than computer models. EBM only use a few decades, all marred by large aerosol uncertainty. Fitting the entire temperature record, particularly the post-1970 period, gives climate models a big leg up. In fact per the #’s I posted above, climate models predict that EBM will be biased low.
Chubbs,
EBM approaches only work on longer timescales (>65 years at least) due to the internal variability of our climate system. For the 1975…2018 obs. trends ( 0.19 K/dec C&W) this means that about 25% come from IV. For the trend estimations of the GCM you used the model mean (?), which is the forced part allone. The obs. also contain the IV of course. IMO one can’t value GCM vs. EBM approaches with too short GMST trends.
If you want to reduce internal variability use a longer averaging time, i.e., two decades instead of one. Going back to the 19’th century increases variability impacts, because obs only cover 20% of globe.
Chubbs, going back to the 19th century is not necessary.. to the 50s is enough. See my article at Judies: https://judithcurry.com/2019/01/03/reconstructing-a-dataset-of-observed-global-temperatures-1950-2016-from-human-and-natural-influences/
frankclimate wrote: “EBM approaches only work on longer timescales (>65 years at least) due to the internal variability of our climate system.”
Lacking any reliable estimate for internal variability, this is a sensible limitation. However, I’ve been experimenting with plotting forcing (ignoring volcanic aerosols) vs warming and the relationship is remarkably linear all the way back to the [unforced] warming between 1920 and 1945. This warming lies right in the center of the linear relationship, so it began with an abnormally cool temperature and ended with abnormally warm temperatureYes, the data points for years following volcanos fall below the line and major El Nino’s and La Nina’s are above and below the line. I’d like to be able to include volcanic forcing and correct temperatures for the transient cooling those aerosols cause. My data includes forcing from the solar cycle – which is also apparent in the plot and causes imperfections. None of the graphs I have produced are very satisfying and I’m extremely frustrated with my ability to convey this information properly.
This is completely consistent with Otto (2013) which obtained similar central estimates for climate sensitivity for three individual decadal changes and one three-decade change.
Chubbs. I see that Clive Best has some investigation in HADSST data.
H3 – H4 temperature differences.
http://clivebest.com/blog/
In addition to Chen and Tung, I find papers from Steven Dewitte and Nicolas Clerbaux very inspiring. I think the authors supplement each other in understanding global patterns of warming.
Decadal Changes of Earth’s Outgoing Longwave Radiation – MDPI. S Dewitte, et al. – 2018
https://www.mdpi.com/2072-4292/10/10/1539/pdf
They find a clear increase in longwave radiation out at top of atmosphere (OLR at TOA) from 1985 to 2017. And they think that this goes together with some global brightening. “Comparing the measured ‘all-sky’ dOLT/dT of Equation (2) with the ‘clear-sky’ dOLT/dT of 2.2 W/m2K, we can conclude there exists a ‘longwave cloud thinning effect’: as the earth warms, it contains less clouds, and becomes a more effective radiator. This cloud thinning effect is underestimated in most of the models.”
To the pattern of change they say: “we can see an increase of the OLR in the subtropical high pressure areas, part of the North-Hemisphere mid-latitude regions, and the Arctic, where the temperature rise is the highest.”
“In the Arctic—where the strongest temperature increase occurs—we also see a strong increase in the OLR. In general, in the Northern Hemisphere—where the surface temperature increase is stronger than in the Southern Hemisphere—we also see an OLR increase.”
“Concerning the tropical cloud effect, we see regional patterns in the changes of the OLR, which are suggesting a relative strengthening of La Niña conditions compared to El Niño conditions. These change imply societally important regional changes in precipitation. The relative La Niña strengthening can also be seen in the ‘cumulative MEI index’ that we have introduced.”
They are beginning to form a comprehensive picture of what happens on Planet Earth
What becomes more clear is the many regulating mechanisms that set in with more global heating. There are really “effective radiators”, that are not adressed in the same way in the establishment of climate scientists. And these “feedbacks” that are not correctly taken up in climate models either. Common energy budgets need to be supplemented.
And the total warming of the earth seems to be slowing down the last 18 years.
Another interesting paper from S Dewitte and friends.
Decadal Changes of the Reflected Solar Radiation and the Earth Energy Imbalance. 2019. Steven Dewitte, Nicolas Clerbaux and Jan Cornelis
Abstract. “Decadal changes of the Reflected Solar Radiation (RSR) as measured by CERES from 2000 to 2018 are analysed. For both polar regions, changes of the clear-sky RSR correlate well with changes of the Sea Ice Extent. In the Arctic, sea ice is clearly melting, and as a result the earth is becoming darker under clear-sky conditions. However, the correlation between the global all-sky RSR and the polar clear-sky RSR changes is low. Moreover, the RSR and the Outgoing Longwave Radiation (OLR) changes are negatively correlated, so they partly cancel each other. The increase of the OLR is higher then the decrease of the RSR. Also the incoming solar radiation is decreasing. As a result, over the 2000–2018 period the Earth Energy Imbalance (EEI) appears to have a downward trend of −0.16 ± 0.11 W/m2dec. The EEI trend agrees with a trend of the Ocean Heat Content Time Derivative of −0.26 ± 0.06 (1 σ ) W/m2dec.”
From the same paper.
“Over the 2000–2018 period the Arctic clear-sky RSR shows a decreasing trend of −0.13 W/m2dec.”
“Over the 2000–2014 period the Antarctic clear-sky RSR shows an increasing trend of 0.08 W/m2dec, followed by a sharp decrease of around −0.4 W/m2 in the 2014–2017 period.”
“The correlation between the global and the polar clear-sky RSR is 80%. This confirms our previous impression that the dominant clear-sky RSR changes occur in the polar regions. Prior to 2014, the polar clear-sky RSR is relatively flat due to a partial compensation of the Arctic decrease and the Antarctic increase.”
“For the all-sky case the spatial structure of the darkening/brigthening appears to be more random than for the clear sky case”
The polar regions are clearly a part of global pattern change, when it comes to shortwave and longwave radiation. Both ice extent and cloudiness change have effects.
https://www.mdpi.com/2072-4292/11/6/663/htm
There seems to be a pattern of cooling sea surface temperatures around Antarctica, south of ca 50 degS. If you look at Nullschool SST anomalies this is clearly shown. Looks like a trend, perhaps linked to the temperature inversion over south polar area? It should be interesting to know if this is a seasonal trend.
It seems that most of the year the SST shows values under the freezing point along the shores of Antarctica. A prerquisite for Antarctica downmelting? A proof that some point of no return is passed?
I wonder if this can be the mechanism behind the global cooling that Dewitt et. al has found the last 18 years. Cooling SST around Antarctica brings more cold water down to ocean deep layers, making the ocean colder. Could this cooling be a result of inversion of temperatures? Perhaps this can counteract other kinds of ocean warming.
Over a half year has gone since the paper came out. And I have not yet seen the climate change police at work. When will the data be corrected like earlier reports of ocean heat reduction, and where is the RC debunking?
I am sorry. I wrote that Dewitte et al show a global cooling. The right way to put it is that they show a decreasing trend in warming.
NK wrote: “There seems to be a pattern of cooling sea surface temperatures around Antarctica, south of ca 50 degS”.
AOGCMs have long predicted much slower warming of Antarctic oceans than the rest of the planet and some even predict modest cooling into the present. For example, Manabe’s early models predicted that it should have been cooling around Antarctica at the time. See Figure 1b in this paper, which has observations and predictions (CMIP3) for 1979-2005, a period with significant global warming and decent observations. However, the average model predicts only slightly less warming in the Antarctic oceans than globally and some predict more more warming.
https://royalsocietypublishing.org/doi/pdf/10.1098/rsta.2013.0040
Abstract: “In recent decades, the Arctic has been warming and sea ice disappearing. By contrast, the Southern Ocean around Antarctica has been (mainly) cooling and sea-ice extent growing. We argue here that interhemispheric asymmetries in the mean ocean circulation, with sinking in the northern North Atlantic and upwelling around Antarctica, strongly influence the sea-surface temperature (SST) response to anthropogenic greenhouse gas (GHG) forcing, accelerating warming in the Arctic while delaying it in the Antarctic. Furthermore, while the amplitude of GHG forcing has been similar at the poles, significant ozone depletion only occurs over Antarctica. We suggest that the initial response of SST around Antarctica to ozone depletion is one of cooling and only later adds to the GHG-induced warming trend as upwelling of sub-surface warm water associated with stronger surface westerlies impacts surface properties…”
I find this explanation somewhat confusing because I also know that Antarctic Bottom water subsides in the same region. This Figure shows how complicated the currents near Antarctica are and perhaps explains why models are more likely to disagree in this location than others.
https://external-content.duckduckgo.com/iu/?u=http%3A%2F%2Fasl.umbc.edu%2Fpub%2Fchepplew%2FSouthernOcean_Overturn.png&f=1&nofb=1
For more information about how relatively cold “intermediate depth” water (but not Antarctic Deep water) is sucked into the ACC and upwells around Antarctica (and possibly preventing warming), see:
https://www.nature.com/articles/s41467-017-00197-0
Another pattern of global warming is the diurnal pattern, with more warming at nights. This is very beneficial at higher latitudes, as freezing nights are reduced. I don`t know how much of the total warming happens at nights. Perhaps somebody knows?
As Clive Best put it: “A reduction in Tmax-Tmin of about 0.1C is observed since 1950. Minimum temperatures always occur at night over land areas. This means that nights have actually been warming faster than days since 1950. The effect over land is of course much larger than 0.1C because nearly 70% of the earth’s surface is ocean with just single monthly average temperature ‘anomalies’. So nights over land areas have on average warmed ~ 0.3C more than daytime temperatures. So if we assume that average land temperatures have risen by ~1C since 1900, then maximum temperatures have really risen only by 0.85C while minimum temperatures have risen by 1.15C. This effect may also be apparent in equatorial regions where the night/day and winter/summer temperature differences are much smaller than at high latitudes.” http://clivebest.com/blog/?p=9125
NK: FWIW, BEST found that the diurnal range decreased about 0.2 K from 1900 to 1985 and then rose almost the same amount in the next two decades.
Click to access Results-Paper-Berkeley-Earth.pdf
An earlier paper found only a decrease in global DTR (0.1 K/decade) over 1950-1999 with significant and irregular regional variation. Climate models predicted a much smaller decrease in DTR over the same period (0.02 K/decade).
Changes in DTR appear to be difficult to accurately measure and possibly too small to be accurately detected in models. Over-simplified rumors about changes in DTR may not be accurate.
https://link.springer.com/article/10.1007/s00382-009-0644-2
There are some papers that present a trend of diurnal temperature range, DTR. These papers show a decreasing trend.
Diurnal asymmetry to the observed global warming
Richard Davy Igor Esau Alexander Chernokulsky Stephen Outten Sergej Zilitinkevich, February 2016.
This analysis show that nights are warmer in Northern hemisphere winter, and it seems that much of the global trend comes from this. ” The northern‐hemisphere trends are much stronger than the global trends for both the Tmin and Tmax; and the trend in Tmin is significantly greater than the trend in Tmax in both cases. There is also a strong seasonal variation in the magnitude of temperature trends. There are stronger trends in both diurnal extremes in the boreal winter (DJF) than in the boreal summer (JJA), and at the same time we see a more rapid decrease in the diurnal temperature range in the winter, which is the season when the diurnal mean temperature has increased most rapidly.” “The trends in the diurnal mean temperature from the last 50 years of gridded observations are almost entirely positive (i.e. warming) trends, across the northern hemisphere. Geographically, we see relatively stronger positive trends over continental Eurasia and the high latitudes of North America. These are also the regions where we see a general negative trend (reduction) in the diurnal temperature range, with only a few locations showing a positive trend . There is a consistent pattern such that, as the world warms, it is the diurnal minimum temperature which increases more rapidly than the maximum temperature, leading to a decrease in the diurnal temperature range.”
https://rmets.onlinelibrary.wiley.com/doi/full/10.1002/joc.4688
Distinct patterns of cloud changes associated with decadal variability and their contribution to observed cloud cover trends
This is from the last reference of Frank: ” the observed annual T max, T min, and DTR trends for the 499 grid boxes from 1950 to 1999. T max increased in most regions, with a pronounced and statistically significant warming trend in northwestern North America and middle latitude Asia, except a small or negative trend in Mexico, northeastern Canada, southern parts of U.S., Europe, and China, and northern Argentina. Tmin increased significantly across all areas except for northern Mexico and northeastern Canada. The large warming in T min and the small warming or the cooling in T max, have decreased DTR significantly over most land areas, especially in east Asia, the West African Sahel, northern Argentina, and part of the Middle East, Australia and U.S.”
Detection and attribution of anthropogenic forcing to diurnal temperature range changes from 1950 to 1999: comparing multi-model simulations with observations Zhou Robert E. DickinsonAiguo, DaiPaul Dirmeyer, 2010
More real patterns, instead of this non-pattern trend analysis.
Take the Fourier amplitude spectrum of an ENSO time-series, then fold the frequencies from 0.5 to 1/year backward on top of the frequencies from 0 to 0.5/year. You get this correlation:
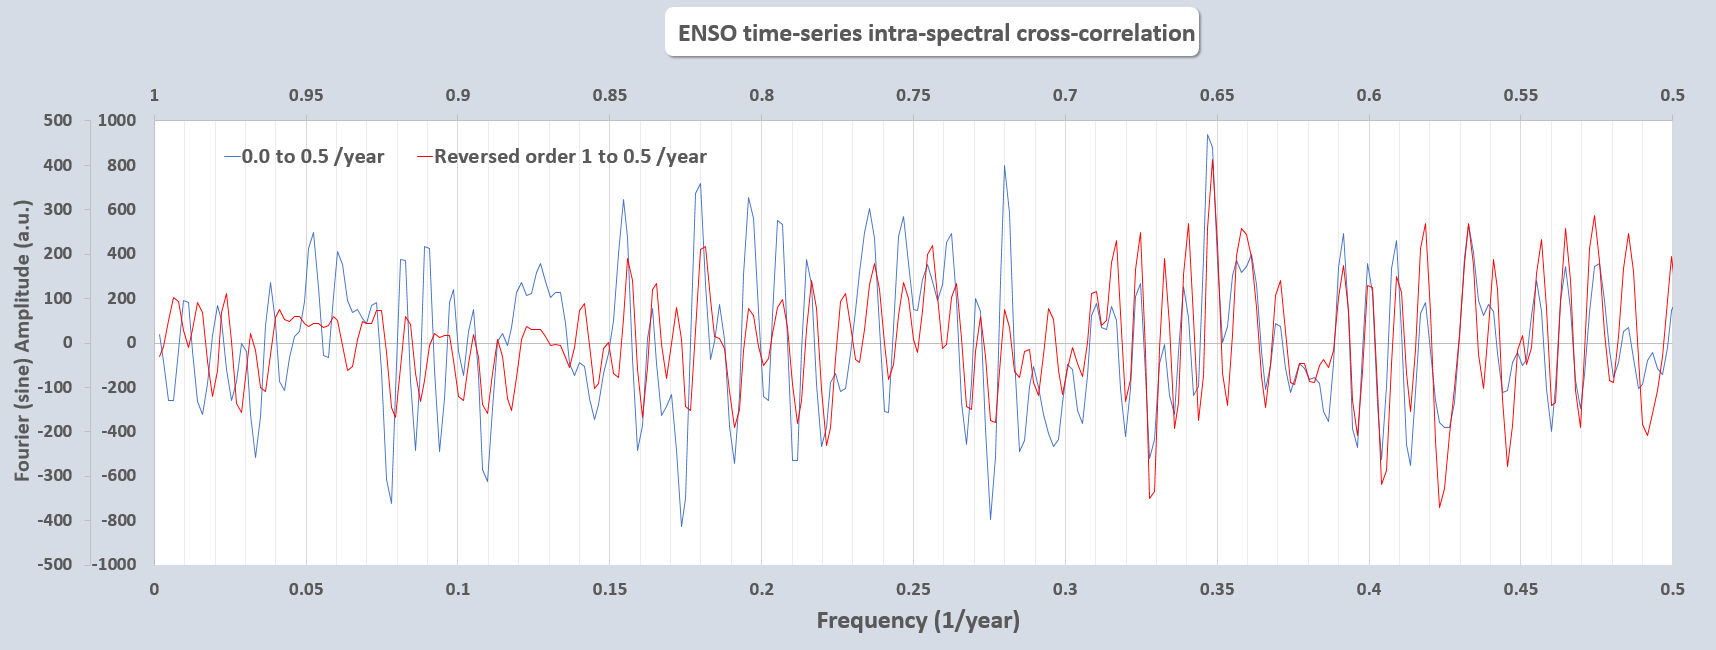
Very obvious what’s going on and it’s definitely not a random process.
Well it’s pretty obvious if someone includes the diffusion correctly since all you have to do is look for the fat-tails on the uptake. With Hansen’s work, one can immediately see this, but with Nic Lewis, all you find is the incorrect first-order (i.e. damped exponential response) uptake.
As one who did diffusion models in the semiconductor industry, being able to deduce the shortcuts taken is not hard. Sorry, no shortcuts are allowed in characterizing diffusion during wafer fab.
Diffusion is important in the semiconductor industry, but a negligible amount of heat is transported by diffusion in the ocean. All attempts to discuss ocean heat uptake in terms of diffusion are fundamentally flawed and misleading for this reason. I reached this controversial conclusion while attempting to understand the equivalence of three different approaches to ocean heat uptake: 1) Hansen’s model for ocean heat uptake with a thermal diffusivity of 1 cm2/s between mixed layer and thermocline compartments, 2) the allegedly equally fast “diffusion” of heat in copper with a thermal conductivity of W/m-K, and 3) the forced heat transfer between compartments in Held’s “two-box” models (reported in W/m2/K). All three of these approaches are fundamentally incorrect for the ocean
Fick’s Law of Diffusion says that heat flux is the temperature gradient multiplied by the diffusion coefficient. Fourier’s Law says that conductivity is proportional to the temperature difference between two locations divided by the distance between those locations – also temperature gradient. So thermal diffusivity expresses heat flux in the “continuous” terms of a gradient while thermal conductivity expresses heat flux in “discrete” terms between two locations. Box models are inherently discrete. Fourier’s thermal conductivity (measured in units of W/m-K) divided by volumetric heat capacity (J/m3/K, = density times specific heat capacity) gives Fick’s thermal diffusivity (measured in units of m2/s). Conductivity and thermal diffusivity appear to be different names for quantifying heat flow driven by a temperature difference.
The thermal conductivity of water (0.59 W/m-K) and its volumetric heat capacity (4.18 J/cm3-K) affords a thermal diffusivity for stationary water of 0.0014 cm2/s, about 700 times smaller than the thermal diffusivity assumed by Hansen for a global ocean mixed by bulk motion/convection/turbulence. Mechanistically, thermal diffusion explains a negligible fraction of heat transport in the ocean
Isaac Held analyzes the ocean heat uptake of AOGCMs in terms of two-box models: a mixed layer (T) and a colder deep ocean with effectively infinite heat capacity (T_0):
https://www.gfdl.noaa.gov/blog_held/3-transient-vs-equilibrium-climate-responses/
Heat transport from the mixed layer to the deeper ocean in response to the rising temperature of the mixed layer is modeled as being proportional to the temperature difference between these two compartments. Held says that typical AOGCMs send 0.7+/-0.2 W/m2 more heat from the mixed layer to the deeper ocean per 1K of surface warming. He calls this the “ocean heat uptake efficiency”. Let’s assume that the initial temperature difference (T – T_0) between these two compartments is 10 K and rises to 11 K (T’ – T_0). Let’s also assume the distance between these two compartment 1 km. Using Fourier’s Law, the “effective thermal conductivity” would be 700 W/m-K. The volumetric heat capacity of water is 4.18 J/cm3/K, making the “effective thermal diffusivity” in this version of Held’s two-box model 1.67 cm2/s.
So a thermal conductivity for copper of 3.84 W/m-K and a thermal diffusivity of 1 cm2/s and an ocean heat uptake efficiency of 0.7 W/m2/K all could represent roughly similar easy of heat transfer when driven by a temperature gradient.
If I assumed an initial 20, 5, or 2 K difference between the two compartments, I would have calculated exactly the SAME thermal diffusivity associated with an ocean heat uptake efficiency of 0.7 W/m2/K. Only the change in the gradient matters. If I assumed heat transport over 0.5 or 2 km, however, the thermal diffusivity would have been double or half.
However, Held didn’t discuss what MUST BE HAPPENING BEFORE A FORCING IS APPLIED. Postulating ANY TEMPERATURE DIFFERENCE between two compartments connected by effective thermal diffusivity of 1.0 or 1.6 cm2/s, creates a system that is not at steady state. The only way to have a steady-state model for the ocean expressed in terms of thermal diffusion is for there to be NO temperature difference between the surface and the deep ocean or for the thermal diffusivity of the ocean to be near zero. This suggests that we should be using the 0.0014 cm2/s thermal diffusivity of stationary water, not values a thousand-fold bigger.
In order for our planet to have tropical and temperate oceans with surface temperatures 20 K and 10 K warmer than the deep ocean, the local effective thermal diffusivity in these regions must be low enough that the temperature of bottom water formed in polar regions is negligibly changed on its 1500-year trip via the thermohaline circulation. Some heat must be diffusing into bottom water. The thermohaline circulation is the only way for that heat to escape! The mechanisms that rapidly carry heat and tracers somewhat below the mixed layer in equatorial and temperate zones certainly can’t reach all the way to bottom waters.
Most heat transport in the ocean is by fluid flow. Downward fluid flow is OPPOSED by the local temperature/density gradient – NOT speeded up by a steeper temperature gradient. Bulk motion of water against the local temperature/density gradient requires doing work against gravity. The concept of thermal diffusion mistakenly predicts that the greatest heat transfer will occur in the tropics, where the steepest temperature gradients are found. It wrongly predicts that there should be no temperature difference between the deep ocean and the surface. The concept of heat transfer by fluid flow correctly predicts that most heat uptake after forcing occurs in polar regions and that the temperature of the deep ocean is controlled by the temperature in polar regions. Thermal diffusion proportional to a temperature gradient is a conceptually flawed approach to heat transfer in the ocean.
Bye. Last comment didn’t work. Read my book with a chapter on thermal diffusiion
Section 9.4.2 of AR5 WG1 discusses modeling of the ocean. The multi-model mean surface of the ocean is too cold while the water from 200-1000 m below the surface is about 1 K too warm – except in the Antarctic. So ocean heat transport in the first 500 m is too high. Below about 1500 m, the water is too cold, again except in the Antarctic. Figure 9.15 shows large differences between models in the temperature of Antarctic bottom water with absolute discrepancies averaging about 1 K warmer and colder. This is where vertical motion and heat uptake are most rapid, and the challenges posed by sea ice, varying salinity and possible ice sheet collapse are greatest. Figure 9.17 shows total ocean heat uptake from 1971-2005 in various models ranges from 8 to 38 *10^22 Joules and the multi-model mean is somewhat too low. Ocean heat uptake seems to be just another aspect of “settled climate science” that is poorly quantified when one looks closely at the details. (And wrongly depicted as heat flow driven by a temperature gradient.)
Click to access WG1AR5_Chapter09_FINAL.pdf
The ultimate proof of the reliability of ocean heat transport in AOGCMs would be for those models to reproduce the temperatures and temperature gradients we observe given different starting conditions. The ocean and atmospheric modules of AOGCMs are “spun up” separately so that slow heat transport in the ocean can be modeled over long periods of time with large time steps. However ocean currents are driven by atmospheric winds, and it is computationally impractical for the full AOGCM to equilibrate the ocean via multiple circuits of the thermohaline circulation. Even after a long spin up, the surface temperature in some AOGCMs is steadily and slowly changing without forcing – suggesting to me that the deep ocean hasn’t equilibrated with surface temperature.
Another example of a real climate pattern — the erratic cycles of the Madden-Julian Oscillation. Strange that no one has noticed that the MJO is simply a shift of the Southern Oscillation Index by 21 days.
I have a new paper on the pattern effect that you might be interested in. Reprint here: https://drive.google.com/open?id=1dOE2uuhlVlRXlkaoKhx5VhdtP70_oieI
Thanks Andy! I’ll take a look.
Andy: Respectfully, the version of the scientific method being applied in your above paper appears fundamentally different from the one I was taught and practice. From my perspective, an AOGCM constitutes a hypothesis about how our climate system behaves. The multi-model mean is another hypothesis. Now, Box famously said that all models are wrong, but some models are useful – but we measure utility by the ability to reproduce current climate and especially historic climate change. In other words, the utility of models is assessed exactly the same way as the validity of hypotheses – by attempting to reject the hypothesis or model. The goal of your paper is to use the unforced variability in unvalidated* MODEL OUTPUT to reject historic climate change (+ estimated forcing change = EBMs) as a useful method for assessing climate sensitivity.
*AOGCMs certainly use carefully validated physics (radiation transfer calculations, for example”. However, AOGCMs also use grid cells too big to represent many important processes, those processes must be parameterized, and then parameters are tuned so the AOGCM has a few correct properties, such as albedo, extent of sea ice, etc. Asserting that such models can accurately determine the ECS of our climate system represents a hypothesis.
There is no doubt in my mind that historic climate change is simply “one realization” of many “possible realities”, paths that our chaotic weather and climate could have followed. Such unforced variability is a real complication. However, the assumption that AOGCMs adequately reproduce the amount and power spectrum of the unforced variability displayed by our climate is another hypothesis. IF I UNDERSTAND CORRECTLY, none of the 100 MPI “model realizations of historic climate change” afforded an EffCS as low as central estimate determined by energy balance models from one “chaotic realization” of historic climate change. Superficially, that tells me that the central estimate of EffCS from those 100 model runs is invalid. The next step in the scientific method should be to attempt to reject the null hypothesis by calculating the CONFIDENCE INTERVAL FOR THE DIFFERENCE between “historic EffCS” and “modeled EffCS” includes zero. We reject the model/hypothesis when the confidence interval doesn’t include zero. If we use a 70% ci, we “likely” should reject the model; a 90% ci, “very likely” reject the model, etc. The confidence interval for “observed historic” EffCS arises from the uncertainties in forcing change, warming and ocean heat uptake. The confidence interval for modeled EffCS comes from the unforced variability in 100 model runs (and perhaps uncertainty in how much forcing change varies between model runs). If none of 100 MPI realizations produce climate sensitivity as low as EBMs, I’m fairly certain that such a statistical analysis would conclude that the MPI hypothesis “likely” should be rejected (or worse). The same goes for the multi-model mean hypothesis. When judging from the Box perspective, these models are likely not useful for determining that EffCS from EBMs can’t be trusted.
To assess the distortions in “observed” EffCS created by unforced variability, I look at Lewis and Curry (2018) Figure 5: “Change in net outgoing radiation dR plotted against change in surface temperature dT” for 15-year and 5-year periods. (dR = dF – dQ). Despite what models say, unforced variability over even 15-year periods IN THE REAL WORLD doesn’t appear to create much uncertainty in EffCS calculated using EBM’s. You look at the output frim AOGCM’s (ie, hypotheses; models of undetermined utility) and use this information to discredit EffCS from EBMs. It is tempting to believe that “100 realizations of modeled climate change” are more informative than one observed “realization” of real chaotic climate change. However, such reasoning is circular: You can’t use part of the hypothesis – models create unforced variability similar to that seen in the real world – to test a second hypothesis – EBMs give ECS that is too low.
Since I find it difficult to believe that climate scientists studying ECS don’t understand the scientific method (in the same way I do), I’d really appreciate a reply or references explaining where my analysis is faulty!
Frank said:
That’s a strawman. If you have a scientific breakthrough and you didn’t follow the proscribed “scientific method”, no one cares. In any case, controlled experiments on the climate are impossible so there goes one whole stage of the method. So in practice, the way it works is that if your model performs better than the next guy’s model, you’re the temporary winner.
Geoenergymath wrote: “Controlled experiments on the climate are impossible so there goes one whole stage of the method.”
We have been running an uncontrolled experiment on our planet by raising levels of GHGs. EBMs evaluate climate sensitivity based on this uncontrolled experiment. The uncertainty in climate sensitivity associated with unforced variability during the historic period is part of that analysis. Figure 5 in Lewis and Curry suggests that source of uncertainty is modest.
Controlled experiments on the universe are impossible, but we have a validated “big-bang” theory about our universe (based on general relativity). Let’s revised that statement: we HAD a validated big-bang theory. Then we conducted more and more sophisticated experiments expected to refine, not invalidate, that theory, we discovered that the expansion of the universe has been speeding up instead of slowing down. A drastic revision was required because the central estimate and confidence interval for the the expansion rate determined from observations of Type 1a Supernovae at different red-shifts was statistically inconsistent with the central estimate and confidence interval for expected expansion rate calculated using the original big bang theory without dark energy. In this case, the statistical inconsistency was probably obvious by inspection.
When inconsistency isn’t obvious by inspection, AFAIK the correct approach is to calculate the difference in central estimates for the observed and theoretical expansion rates and confidence intervals for that difference in central estimate. In astronomy, if the 95% confidence interval for the difference included zero, astronomers would conclude their observations of Supernovae weren’t inconsistent the Big Bang theory lacking dark energy. However, when there was less than a 5% likelihood that the difference included zero (the null hypothesis), there was a scientific consensus that the Big Bang theory needed to be modified.
When ECS and TCR are calculated from historic (observed) warming and estimates of forcing (called EBMs) are compared with ECS and TCR from AOGCMs, there is a large difference (2X for multi-model mean ECS) in the central estimates for these parameters, but these central estimates come with relatively wide confidence intervals. However, climate scientists haven’t properly dealt with the null hypothesis that the climate sensitivity of current AOGCMs is inconsistent with observations. I seriously doubt that we have established that the multi-model mean is statistically inconsistent at the 95% confidence interval with observed (historic) warming and forcing, but we have likely done so at the 70% confidence interval. Since climate change is a threat requiring policymakers to make decisions without the high confidence (95%) normally required for reaching “scientific conclusions”, climate scientists routinely advise policymakers about scientific findings they only “suspect” are correct (70% likelihood). If I am correct, policymakers should be advised that the climate sensitivity of the multi-model mean is likely too high. Since all of the IPCC’s projections are based on AOGCMs, that would require making some caveats or adjustments to at least their warming projections.
Instead climate scientists have turned to AOGCMs – the hypothesis – rather than the real world, for evidence that unforced variability interferes with our ability to estimate climate sensitivity from the EBMs.
There are other natural experiments occurring in our climate system besides the one involving rising GHGs and aerosols (the latter have been falling since 2000 and reducing uncertainty in forcing). Every year, seasonal warming increases GMST by 3.5 K and we observed the resulting responses in OLR and reflected SWR and the unforced variability in those responses. Those responses are feedbacks (W/m2/K) to seasonal warming, and they may differ from feedbacks in response to global warming. Nevertheless, a reliable climate model should be able correctly model feedback to both global and seasonal warming. Satellites allow us to decompose seasonal feedback into its constituent components:
1) LWR feedback (through clear skies).
2) cloud LWR feedback (the difference between LWR feedback through all skies and clear skies). Multi-model mean seasonal cloud LWR feedback is too positive.
3) SWR feedback through clear skies (surface albedo feedback, formerly ice-albedo feedback).
4) cloud SWR feedback (the difference between SWR feedback through all skies and clear skies).
When analyzed this way, we find that the IPCC’s models – hypothesis – are composed of four mutually-inconsistent sub-hypothesis about both seasonal and global warming.
We can conduct informative experiments about phenomena about many phenomena that can’t be studied with carefully controlled experiments in the laboratory. The scientific method applies the same standards to both types of experiments.
So pick the model that you want to improve on from this list and see if you can beat it. Each one you pick will need to go through a peer-review and publish cycle.
Geoenergymath wrote: “So in practice, the way it works is that if your model performs better than the next guy’s model, you’re the temporary winner.”
Sorry, the IPCC doesn’t do that. The IPCC practices something they call “model democracy”. No one tries to identify the best model. All nationally-sponsored or submitted AOGCM’s are given equal weight in the multi-model mean.
A group at climateprediction.net has studied a 1000+ ensemble of climate models constructed by randomly varying from six to as many as 15 key parameters within a physically reasonable range and then comparing their output with a panel of climate metrics: temperature data, flux data and precipitation data. Every set of parameters produced significantly inferior results at reproducing some aspects of current climate and they were unable to narrow the viable range of any parameter by demonstrating that some part of its range always produced inferior results. They found that parameters interacted in surprising ways. They conclude that the ad hoc procedures used to tune more sophisticated models search only a small sample of parameter space and are unlikely to find the optimum set of parameters.
The whole concept of one model “performing better” is problematic. Performing better in what respect? (In AR4, the IPCC called the models they used an “ensemble of opportunity”.
I’m afraid that you didn’t respond to my model for solving Navier-Stokes along the equator, and instead talked about the IPCC, which as far as I know is not a research organization.
Good response Frank and what I’ve said several times to Andy here. I doubt you will get a response since even the modelers are now saying they need a huge investment in much better resolution (Stevens and Palmer). Their papers details some of the defects of current generation models.
Dessler: “I have a new paper —”
Interesting place to put in some rhetorics, Even a mathematical function can have its attitude. We learn that ECShistorical is ECSfalse, as opposed to ECStrue. Science for true believers.
nobodysknowledge,
It’s a more sophisticated argument.
dpy6629 wrote: “… modelers are now saying they need a huge investment in much better resolution (Stevens and Palmer). Their papers details some of the defects of current generation models.”
The full text of a paper about the need for better models mentioned by dpy6629, Palmer and Stevens (2019), can be found here. It makes for interesting reading.
Click to access 24390.full.pdf
[After summarizing some successes of climate science, they say;] “What we find more difficult to talk about is our deep dissatisfaction with the ability of our models to inform society about the PACE OF WARMING, how this warming plays out regionally, and what it implies for the likelihood of surprises. In our view, the political situation, whereby some influential people and institutions misrepresent doubt about anything to insinuate doubt about everything, certainly contributes to a reluctance to be too openly critical of our models. Unfortunately, circling the wagons leads to false impressions about the source of our confidence and about our ability to meet the scientific challenges posed by a world that we know is warming globally.”
“How can we can reconcile our dissatisfaction with the comprehensive models that we use to predict and project global climate with our confidence in the big picture? The answer to this question is actually not so complicated. All one needs to remember is that confidence in the big picture is not primarily derived from the fidelity of comprehensive climate models of the type used to inform national and international assessments of climate change. Rather, it stems from our ability to link observed changes in climate to changes derived from the application of physical reasoning, often as encoded in much simpler models or in the case of the water cycle, through a rather simple application of the laws of thermodynamics.”
[I’d sure appreciate a reference or two detailing exactly which “observed changes” can be quantitatively “derived from the application of physical reasoning” or “simple application of the laws of thermodynamics”.]
“Now that the blurry outlines of global climate change have been settled, the need to sharpen the picture has become more urgent. However, such sharpening is proving to be more challenging than anticipated—something that we attribute to the inadequacy of our models. Unfortunately, many in the community—notably those in charge of science funding—have no idea how significant and widespread these inadequacies are. This has arisen in part because of a justified desire to communicate, with as much clarity as possible, the aspects of our science that are well settled. While we are certainly not claiming that model inadequacies cast doubt on these well-settled issues, we are claiming that, by deemphasizing what our models fail to do, we inadvertently contribute to complacency with the state of modeling. This leaves the scientific consensus on climate change vulnerable to specious arguments that prey on obvious model deficiencies; gives rise to the impression that defending the fidelity of our most comprehensive models is akin to defending the fidelity of the science; and most importantly, fails to communicate the need and importance of doing better.”
[The authors use the term “fidelity” herein is somewhat obscure, since the word has two meanings (according to Merriam Webster): In a scientific context, it can be defined as “accuracy in detail”. A “blurry outline of global climate change” is consistent with the author’s claim that they are “not defending the fidelity of climate models”. What does the phrase “defending the fidelity of the science” mean when the details in climate science are provided by climate models? Scientific fidelity in the absence of accurate details appears to be an oxymoron, but fidelity to science appears encompass the second meaning of fidelity, “being faithful”. The authors are presumably being faithful to the above unspecified “physical reasoning” and “thermodynamics”. Being faithful to scientific REASONING is a dangerous undertaking, as we can see every time a naive skeptic arrives here arguing that the 2LoT “proves” that DLR can’t be absorbed by the surface or that pressure creates the temperature gradient in planetary atmospheres. The scientific method – comparing observations with the predictions of theory/hypothesis/model – is the only reliable method for understanding how the world works. Nevertheless, the authors don’t want to focus too much attention on “obvious model deficiencies” for fear that they will cast doubt on some undefined “scientific consensus on climate change”.]
[Model inadequacies may indeed not cast much doubt over the well-settled conclusion that there is a 70% likelihood that ECS is between 1.5 and 4.5 K – with no best central estimate. IMO, model inadequacies do cast serious doubt over calculations of the social cost of carbon and statements such as: we can only burn X gigatons of carbon and have a 66% likelihood of keeping warming below Y degC.
[The article goes on to detail model biases in absolute GMST and large regional biases, but omits discussing potential biases in climate sensitivity.]
“This status quo and the complacency that surrounds it give us cause to be deeply dissatisfied with the state of the scientific response to the challenges posed by global warming. Whereas present day climate models were fit for the purpose for which they were initially developed, which was to test the basic tenets of our understanding of global climate change, they are inadequate for addressing the needs of society struggling to anticipate the impact of pending changes to weather and climate.”
[The authors dismiss the current strategy of incremental improvement and dealing with model inconsistency through correction or selection. They advocate jumping to a new generation of climate models with a resolution of one or a few kilometers, which is fine enough that convective precipitation from cumulus clouds may no longer need to be parameterized. They discuss the possibility of eliminating the need for an entrainment parameter, the parameter which has the the greatest impact on ECS in perturbed-physics ensembles. High resolution could also eliminate the assumption of hydrostatic stability, which would allow the vertical velocity of a parcel of air to change (accelerate). They have references to work already underway.]
Thanks Frank for the long excerpt. Even though we are not supposed to infer motives here, this paper does that quite clearly. It also implies that the “circling the wagons” strategy has been widely held and followed among climate scientists.
This explains to me why climate science attracts so much criticism and dismissal from laymen. It is simple numerical analysis that every first year graduate student in a CFD course will be exposed to.
At current resolutions, numerical truncation errors are orders of magnitude larger than the changes in energy flows that are the important outputs. In this situation, skill can only be due to tuning so that large errors cancel for quantities used in the tuning. The models are probably tuned for overall energy input and ocean heat uptake so they are not totally wrong, but details will be wrong.
Whether massive increases in “fidelity” will improve the situation is unknown. You need merely look into the current CFD work on LES to realize that eddy resolving time accurate simulations are in their infancy. For one thing classical methods of numerical error control fail.
dpy6629: Thanks for the reply. I was in the process of writing the comment below about some improvements seen with the sub-10 kilometer scale models discussed by Palmer and Stevens when you replied.
dpy6629 said: “The models are probably tuned for overall energy input and ocean heat uptake so they are not totally wrong, but details will be wrong.”
Yes, but somewhere above we have discussed the large differences between models about how much energy is absorbed by the surface. So even though radiative fluxes at the TOA are tuned to agree with observations, the vertical heat fluxes must be very different at the surface and throughout the troposphere.
Just one more point. Cumulus convection is a classic ill-posed problem. It would make sense to first try to solve this problem in small scale settings before jumping into a massive effort which will require the largest and most expensive computers being run 24/7 for years just to debug the code.
Frank,
IMO, massive new spending on models is a waste of time and money. It isn’t going to change anyone’s mind. What’s really needed is a more realistic analysis of costs and benefits. But I’m not holding my breath. Pielke, Jr.’s attempt to do this ( see his The Climate Fix, for example ) got him tarred and feathered and ridden out of town on a rail.
DeWitt: The problem with analyzing costs and benefits is that you need to discount the cost of future damage avoided by mitigation back to its net present value so you can compare it to the cost of mitigation. You can’t make any sensible estimates of future damage without some idea of whether ECS is 2 K or 4K. Then there is the problem of choosing an appropriate discount rate. An economist, Frank Ramsey) mathematically proved that an optimum discount rate depends on expectations of future growth. The greater the economic growth you expect, the higher your discount rate should be. The future of CO2 emissions depends mostly on what undeveloped and developing nations choose to do, and it is politically untenable of any of those governments to abandoned the dream of emulating the Chinese and growing their economy at 5+%/year for the next few decades. If these countries apply Ramsey’s optimum discount rate, the net present cost of future damages from their emissions will be near zero. In the developed world, where 2% GDP growth might be realistic and 3% optimistic, we should apply a much lower discount rate and therefore a much high cost to future damage. However, we may not be willing to do so when the developing world does little or nothing to reduce their emissions. Private businesses use a different discount rate. Even if we precisely knew climate sensitivity AND damage, there isn’t a “globally useful” discount rate we can use to do a cost benefit analysis.
Wikipedia has an article on “social discount rate”, shows “Ramsey’s social discount rate” near the bottom, and criticizes its use – without noting that it has been mathematically proven to produce an optimum outcome.
There is a more intuitive way to express this problem. If you are a wealthy environmentalist who fears your unsustainable economy has serious damaged and depleted the planet, you fear that your children and grandchildren to have difficulty living as affluent a lifestyle as you do. (Your assumed economic growth rate is negative.) Your are probably willing to pay almost anything so that your CO2 emissions don’t make your descendant’s lives even more difficult. You aren’t going to discount the cost of future damages caused by your emissions at all. On the other hand, if you live in India and expect GDP triple every generation (1.05^22 = 3), you aren’t going to be willing to pay much if anything, to reduce emissions to smooth the future path of your more affluent children and extremely wealth grandchildren. Finally, if you are a Republican who believes in human ingenuity and continuing economic growth, you may think more like an Indian than an environmentalist.
China’s policy of economic growth at an environmental price known to be absurdly high makes since from this point of view: Our much richer children can clean up the environmental messes we have left behind, and spend large sums to replace current coal-fired electricity generation with lower carbon generation – if they prefer.
The most interesting high resolution modeling paper discussed by Palmer and Stevens (2019) that I read was Weber and Mass (2019): SUBSEASONAL WEATHER PREDICTION IN A GLOBAL CONVECTION-PERMITTING MODEL
https://journals.ametsoc.org/doi/pdf/10.1175/BAMS-D-18-0210.1
NCAR has developed the Model for Prediction Across Scales (MPAS) to study the effect of model resolution on model output. The authors looked at observations (from TRMM) and predictions of tropical rainfall for 28 days after initialization from three numerical weather prediction models with different resolution: the current standard model CFS2 from the NWS with roughly 100 km grid cells, a high resolution MPAS model with hexagons on 15 km centers and conventional parameterized convection, and an ultra-high resolution MPAS model with hexagons on 3 km centers capable of resolving many of the fine feature of deep convection and without parameterized entrainment during cumulus convection and without hydrostatic equilibrium. All three models had fixed SSTs. Vertical resolution wasn’t specified, but elsewhere 200 m near the surface used.
Only the ultra-high resolution model avoided the standard problem of producing too frequent light precipitation and too rare heavy precipitation (greater than 5 mm/h often associated with the MJO). Light precipitation is responsible for breaking up marine boundary layer clouds, but the authors didn’t discuss this subject. Qualitatively the model produced an MJO that was far more realistic. It appears as if there is a lot to be gained from avoiding parameterization of cumulus convection.
Diurnal cycle of precipitation. Average global precipitation is 0.1 mm/hr (0.9 m/yr), but can be 1-5+ fold greater in the tropics. The ultra-high resolution model did the best job of reproducing the observed diurnal pattern of tropical precipitation over the ocean: a maximum of 0.04 mm/hr above average at 6:00 am and a minimum of 0.04 mm/hr less than average at 6:00-9:00 pm. This pattern is the result of radiative cooling and subsidence of cloud tops at night. Over land, peak precipitation is observed at 6:00-9:00 pm at 0.10 mm/h above average and minimum precipitation is observed at 9:00 am at 0.08 mm/h below average. Like all models, the ultra high resolution model produced to much precipitation too early in the day, peaking at 0.13 mm/hr above average between 12:00 and 3:00 pm and too little precipitation in the early evening. This suggests (to me) that heat transfer from the land surface to the atmosphere is too rapid, possibly because vertical resolution in the boundary layer is still too coarse or parameterization of turbulent mixing is flawed. Ordinary climate models also tend to produce too much rain over land too early in the afternoon, but this problem can be minimized by changes in entrainment.
One ultra-high resolution 28-day simulation required 2.8 million core-hours of processor time, about 1 hour if run on the NCAR largest Cheyenne 2017 super-compute with 3 million cores. A 250 year climate simulation has 3000 months, 125 days on this machine. This is without an ocean, spin-up (another 100 years?) and without any of the carbon cycle, chemistry, vegetation and other non-fluid dynamics that now take more than half of computing time with today AOGCMs. These are resources Palmer and Stevens (2019) argues (in my comment above) are needed to fill in our current “blurry picture” of forced climate change. Since climate sensitivity can change significantly as the entrainment parameter is varied and since proper representation of marine boundary layer clouds may require getting eliminating the bias towards excessive light precipitation, they may be right.
Thanks for providing the details Frank. My opinion is that its grasping at straws. Did they do a grid convergence study? Did they vary all the parameters of the turbulence model for the shear layers? What about different time steps? Based on work on vastly simpler problems, we know these issues are all problematic.
Further, tuning is unscientific unless you can control numerical error. The best case scenario is that it will take 30 years to “find” a set of parameters that may give uncertainty of 5-10%. And then as things warm, this tuning becomes suddenly wrong. The worst case is that nothing really improves because all these millions of runs were cherry picked and the uncertainty is actually 50%. No one knows and [moderator’s snip here] ..culture that is dramatically overconfident in those memes and their own prowess.
Spend this money on theoretical work on attractor properties is a vastly better option. Start with small problems with low dimension.
dpy6629: The MPAS (Modeling for Prediction across All Scales) project is a large, multi-year effort that has certainly been documented in publications and reports. While searching for the height of grid cells, I ran into a presentation on validation studies, but I understood essentially none of what I read. I see no reason for you to suggest they failed to complete all appropriate validation studies before making the model available to outside researchers like Cliff Mass (U of W, host of weather blog). Given current limitations on computation, MPAS is more of a “weather forecast model” than a “climate model” and the parameters used by Mass came from weather prediction models. As best I could tell, Mass’s parameters (except entrainment) weren’t re-tuned when the resolution changed. When MPAS is initialized and used in a weather prediction mode, the output is “validated” by comparing with observations (unlike AOGCMs). Due to initialization uncertainty all models lost skill with time, but the skill of the highest resolution model decreased more slowly.
(The MPAS project includes a high resolution ocean model, but Mass did not use that in his 28-day simulations and I don’t know if the two have been combined into a true AOGCM.)
OK Frank thanks for pointing this out. I haven’t had time to read the paper and have a lot on my plate at the moment. I do know however based on CFD research that there are fundamental issues here that make truly scientific validation virtually impossible. Bear in mind that the concept of “skill” is a very low bar. Basically your model must on average be better than climatology.
I stand by my assertion that they have no idea whether the uncertainty is 5% or 50% in any new situation. It’s simply not possible to run the models enough or indeed find test cases where you can determine error levels to really address any rigorous error estimate.
The best case one can make is that a model with some skill is better than climatology. Whether its economic value is high I don’t know.
dpy6629 wrote: “I do know however based on CFD research that there are fundamental issues here that make truly scientific validation virtually impossible. Bear in mind that the concept of “skill” is a very low bar. Basically your model must on average be better than climatology. I stand by my assertion that they have no idea whether the uncertainty is 5% or 50% in any new situation. It’s simply not possible to run the models enough or indeed find test cases where you can determine error levels to really address any rigorous error estimate.”
I haven’t forgotten the existence of fundamental issues or SOD’s post showing how the size of the time step influences the numerical solution of Lorenz’s set of coupled differential equations. In the development of quantum mechanics, there was (and apparent still is) a great deal of concern about using the dubious mathematical trick of renormalization to eliminate infinities and their is still a debate about the interpretation of wave functions. Feynman once wrote that a theory should be judged by how well it predicts what we observe, so I personally prefer (in my relative ignorance of CFD) to judge weather prediction and climate models by this standard. What we know from about 70 centuries of Holocene climate suggests that any new “attractor” we might transition into isn’t globally as different from today as projected for forced warming. There are some scary regional historic precedents in terms of drought: The end of the African humid period and the desertification of the Sahara. Droughts in the Southwestern US.
In the case of weather prediction models, we know that initialization uncertainty is responsible for the degradation in their performance with time. In the Mass paper, Figure 6 shows that the ultra-high resolution (3 km) model showed significant skill (r about 0.7 between observed and forecast 500-hPa height anomalies) in the third week after initialization in three of four runs, while the conventional weather prediction model showed no skill (average r about -0.1).
You correctly point out that the uncertainty in NEW situations is problematic, but using one model to predict seasonal changes in weather over the planet covers a large range of existing conditions. Phenomena like tornados (and hurricanes in the case of AOGCMs without downscaling) are “new phenomena” in the sense that they can’t be accurately represented by grids cells, but the disturbances created by these phenomena obviously don’t persist (unlike Jupiter’s Red Spot). The new condition we are obviously concerned about is what happens when today’s concentration of CO2 has doubled. Given the dramatic changes in water vapor weather prediction models already handle, I’d say that a doubling in CO2 isn’t a dramatically “new” situation.
Frank,
Nitpick. The doubling would be from the pre-industrial level of ~280ppmv, not today’s 400+ppmv.
Frank wrote: “The new condition we are obviously concerned about is what happens when today’s concentration of CO2 has doubled.”
DeWitt helpfully nitpicked: The doubling would be from the pre-industrial level of ~280ppmv, not today’s 400+ppmv.
What did I mean? That is a tough question. Most economists think anthropogenic warming so far has been net beneficial (or non-problematic at worst), so I’m not concerned about 280 to 410 ppm.
If I thought in terms of RCPs, I should have said: “when radiative forcing has increased by 3.5 W/m2, equivalent to a doubling of CO2”.
RCP 7.0 is supposed to be the new “business as usual” and Hausfather argues “improvement as usual” puts on track for somewhere between RCP 4.5 and RCP 6.0. If I knew what radiative forcing was today, maybe I could confidently say adding another 3.5 W/m2 is a sensible thing to be concerned about.
AR5 says anthropogenic radiative forcing was 2.3 +/- 1.0 W/m2 in 2011 (and it has been increasing at about 0.33 W/m2/decade since 1980). Another 3.5 W/m2 would get us near RCP 6.0. Aerosols contributed a grossly uncertain -0.8 (+/-1.1?) W/m2 of forcing and that grossly uncertain negative forcing is projected to disappear in all scenarios. So maybe I should say 3.1 W/m2 of GHG forcing in 2011 plus another 3.5 W/m2 mostly from CO2 will get us near RCP 7.0.
In terms of just CO2, in 2100 RCP 4.5 is about 540 ppm CO2 (2X PI), 6.0 is 670 ppm (2.4X PI) and 8.5 is 936 ppm (3.3X PI) which would put the new 7.0 scenario at near 780 ppm (near 2X today).
link.springer.com/content/pdf/10.1007%2Fs10584-011-0156-z.pdf
It is amazing how complicated it is to translate the simple concept of doubling CO2 into the language used by the IPCC. Nevertheless, the equivalent of doubling CO2 is roughly what we are concerned about – but I didn’t understand why when I wrote it.
Finally, now that aerosols are falling, radiative forcing is probably rising at 0.4 W/m2/decade. A doubling of CO2 is about 9 decades at this rate of increase. That gets us near 7.0 W/m2, the business-as-usual scenario. The current rate of increase in CO2 is about 25 ppm/decade or 0.6%/decade. 1.06^9 is 1.7, about about 30% short of a doubling. If minor GHGs raised this rate to 33 ppm equivalent of CO2/decade, that would produce a doubling in 9 decades.
Another major scientific rationalization in climate change bit the dust:
“Climate change is amplified in the Arctic region. Arctic amplification has been found in past warm and glacial periods, as well as in historical observations, and climate model experiments. Feedback effects associated with temperature, water vapour and clouds have been suggested to contribute to amplified warming in the Arctic, but the surface albedo feedback—the increase in surface absorption of solar radiation when snow and ice retreat—is often cited as the main contributor. However, Arctic amplification is also found in models without changes in snow and ice cover. Here we analyse climate model simulations from the Coupled Model Intercomparison Project Phase 5 archive to quantify the contributions of the various feedbacks. We find that in the simulations, the largest contribution to Arctic amplification comes from a temperature feedbacks: as the surface warms, more energy is radiated back to space in low latitudes, compared with the Arctic. This effect can be attributed to both the different vertical structure of the warming in high and low latitudes, and a smaller increase in emitted blackbody radiation per unit warming at colder temperatures. We find that the surface albedo feedback is the second main contributor to Arctic amplification and that other contributions are substantially smaller or even oppose Arctic amplification.”
Click to access PithanMauritsen-ArcticAmplificationLapsrateOtherFeedbacks-O-NGeoSci2014.pdf
Pithan and Mauritsen (2014) DOI:10.1038/NGEO2071
In practice MJO is straightforward to model from the equations of fluid dynamics. Essentially an off-equatorial-latitude variant of the standing-wave ENSO pattern, which I have peer-reviewed and published
The authors of the paper linked below compared changes in precipitation seen in the AOGCMs and re-analysis products (observations). They separated wet-season and dry-season precipitation into a thermodynamic component – the 7%/K change in relative humidity with Ts – and a dynamic component – the change in vertical velocity at 500 hPa (ω) and seasonal changes in relative humidity. Models do a good job with the thermodynamic component, but do a poor job with the dynamic component, underestimating the magnitude of vertical velocity (in both directions) and circulation. The discrepancy – at least as presented by these authors – appears to be robust. The models used in this study were CMIP5 AMIP models – models forced by the observed (historic) rise in SST between 1979 and 2008; not by rising GHGs and aerosols. The advantage of using AMIP models is that unforced variability such as ENSO is present in both models and observation. In a single sentence with no data, the authors assert that this problem is even bigger when models are forced (as usual) with rising GHGs. (We know from other work that models in normal forcing mode usually show significantly higher climate sensitivity than in AMIP mode.)
The authors attribute this problem to the fact that a warmer upper troposphere decreases atmospheric instability and thereby reduces upward convection. Which suggests (to me at least) that the surface of the ocean would be warming too rapidly in normal model runs where the SSTs aren’t constrained to match the historic record.
Questions remain: If models are convecting too little heat upward in the tropics (and elsewhere), why isn’t the upper tropical troposphere colder in models than we observe? Are there compensating errors elsewhere?
The authors of this paper do not directly link their work to the controversy about how much warming is “amplified” in the upper troposphere compared with the surface. They cite Santer (2017) and other papers from the consensus as evidence that the upper tropical troposphere has warmed more in models than observations (according to central estimates) and ignore assertions that the difference is smaller than the uncertainty in measurements. IMO FWIW, this paper suggests that models do produce more warming than observed in the upper tropical troposphere, and this difference could artificially inflate climate sensitivity.
The mechanisms behind changes in the seasonality of global precipitation found in reanalysis products and CMIP5 simulations
Chia‐Wei Lan1 · Min‐Hui Lo1 · Chao‐An Chen2 · Jia‐Yuh Yu3
Climate Dynamics https://doi.org/10.1007/s00382-019-04781-6
Abstract: As the global atmosphere warms, water vapor concentrations increase with rising temperatures at a rate of 7%/K. Precipitation change is associated with increased moisture convergence, which can be decomposed into thermodynamic and dynamic contributions. Our previous studies involving Coupled Model Intercomparison Project Phase 3 (CMIP3) projections have suggested that seasonal disparity in changes of global precipitation is primarily associated with the thermodynamic contribution. In this study, a vertically integrated atmospheric water budget analysis using multiple reanalysis datasets demonstrated that dynamic changes played a significant role in seasonal precipitation changes during 1979–2008, especially in the global average and ocean average. The thermodynamic component exhibited almost consistent magnitude in the contribution of seasonal precipitation changes during 1979–2008 in both CMIP5_AMIP models and reanalysis datasets, whereas the dynamic component (related to the tendency of ω and water vapor climatology) made a lower or negative contribution in the CMIP5_AMIP models compared with the reanalysis datasets. Strengthened (weakened) ascending and descending motions in the reanalysis datasets (CMIP5_AMIP models), which were indicative of strengthened (weakened) seasonal mean circulation, tended to increase (reduce) precipitation in the wet season and reduce (increase) precipitation in the dry season during the study period. Vertical profiles of the tendency of moist static energy in the mid-to-upper troposphere suggested a trend toward stability in the CMIP5_AMIP models and one toward instability in the reanalysis datasets. Such disagreement in stability might be related to the di erent warming tendency in the mid-to-upper troposphere over the tropics.
Click to access The-mechanisms-behind-changes-in-the-seasonality-of-global-precipitation-found-in-reanalysis-products-and-CMIP5-simulations.pdf
Some illuminating quotes:
Introduction: “Owing to the inability of models to realistically simulate internal variability and SST patterns in response to external forcing, the uncertainty of the dynamic component is much larger than that of the thermodynamic component in model simulations (Kent et al. 2015; Knutti and Sedláček 2012; Long et al. 2016; Ma and Xie 2013).”
“AMIP-type simulations with prescribed sea surface temperature were used in this study to reduce the uncertainty surrounding internal model variability and different sea surface warming conditions. The averaged trend maps from 21 CMIP5_AMIP models (Fig. 4, trends in ω) had trends of stronger amplitude in ω at 500 hPa compared with those from CMIP5-coupled simulations (not shown), particularly in the tropics.”
From conclusions: “The higher warming rate from the mid-upper troposphere in most of the model simulations was a possible factor in the greater trend toward stability over the tropics, which tended to weaken upward and downward motion in the CMIP5_AMIP models. This indicated that a tendency toward instability in the observations and one toward stability in the climate models was the primary reason for the disagreement between central controlling mechanisms for seasonal precipitation changes between the reanalysis datasets and CMIP5_AMIP models. In addition, the differences in MSE stability between the reanalysis datasets and CMIP5_AMIP models resulted from more warming in the mid-to-upper troposphere over the tropics in the model simulations than in the reanalysis datasets or satellite observations (Fu et al. 2011; Mitas and Clement 2006; Po-Chedley and Fu 2012; Santer et al. 2017).”
Several of the big names associated with the pattern effect on climate sensitivity (Armour, Andrews, Forster) have a new GRL paper with a more complete analysis of the phenomena: Dong et al (2021) “Biased estimates of equilibrium climate sensitivity and transient climate response derived from historical CMIP6 simulations”.
Click to access Dong_etal_2021.pdf
Some of the key findings are found in Figure 2. The pattern effect in the satellite era (1979-2014) is associated with observed modest cooling in the Eastern Pacific and enhanced warming (0.2-0.4 K/decade) in the Western Pacific. When AGCMs are forced with observed warming (ampi experiment), they show a roughly 2 degK lower effective ECS than when the same AOGCM driven with historic forcing. When ECS is calculated from observed warming and forcing (energy budget method), effECS is also similarly lower. The advantage of using the satellite period is that the uncertainty in aerosol forcing is small.
There is also a pattern effect over the full historic period (1870- 2014). That pattern effect also causes ampi experiments to produce lower effECS and effECS calculated from observed warming and forcing to be smaller. However, the pattern in the different: Enhanced warming has been observed in the Indian ocean and diminished warming in the Pacific and near Antarctica compared with historic simulations.
Finally 4X models show enhanced warming in the Eastern Pacific after 20 years compare with the first 20 years and historic simulations. This leads to higher effECS after 20 years,
Finally, the authors also look at the reason why model TCR is much higher than observed TCR. It turns out that ocean heat uptake efficiency in 1% pa runs is smaller than observed, If more heat is transiently being taken up by the ocean more heat from forcing must be being radiated away to space per degK of surface warming.
They conclude by saying: “the projections by GCMs are confronted by not only uncertainties associated with atmospheric physics, for example, cloud feedback response to a given SST pattern, but also an open question: how reliable are model projections of future SST patterns? AOGCMs generally fail to reproduce the observed historical SST pattern, which led to an inconsistency between EffCS estimates from coupled historical runs and those from amip runs and observations. If the observed SST trend pattern is caused by natural variability, which will reverse sign in the coming decades according to AOGCM projections (Watanabe et al., 2021), then the higher values of EffCS and TCR found within AOGCMs may be more informative about near-future climate change under continued CO2 forcing. If the recently observed SST trend pattern is a result of model biases in the response to GHG forcing (e.g., Coats & Karnauskas, 2017; Seager et al., 2019), the lower values of EffCS_his and TCR_his from observations may persist over the coming decades, in which Case 21st century warming may be lower than that projected even by GCMs with realistic ECS values. This work suggests that both understanding the causes of the recent observed warming pattern and making accurate projections of future warming patterns are important for constraining transient and near-equilibrium climate change.”
Perhaps I’m imagining things, but the authors sound somewhat less confident (than they did when the pattern effect was first proposed) that all of these discrepancies are caused by unforced variability rather than model error. The abstract covers the same material without discussing the two hypothesis for the reason why there are discrepancies between observed and modeled warming.
Frank (I use Franktoo at some other blogs) dubiously wrote: “Finally, the authors also look at the reason why model TCR is much higher than observed TCR. It turns out that ocean heat uptake efficiency in 1% pa runs is smaller than in historic runs. If more heat is transiently being taken up by the ocean, [then] more heat from forcing must be being radiated away to space per degK of surface warming.”
This summary may be incorrect. The authors are using a sign convention for ocean heat uptake efficiency that differs from that of my intuition, which assumes that heat loss from both the surface to space and the surface to the deep ocean should be negative. However, heat loss to the deep ocean is also the radiative imbalance at the TOA, deltaN which is positive. In an energy budget model using deltaT/deltaF to calculate TCR and deltaT/(deltaF-deltaQ) to calculate ECS (where Q is ocean heat uptake), a model with an unreasonably high ESC can have a lower TCR by transporting more heat from forcing into the deeper ocean per degree of surface warming. Likewise, transporting more heat to space per degree of surface warming produces a lower (effective) ECS. We call the latter radiative feedback (lambda) and the former ocean heat uptake efficiency (kappa), both measured in W/m2/K. In any case, because of the difference in sign convention, their reciprocal relationship with climate sensitivity and my intuition, I have problems when I try to discuss the change in terms of “smaller” or “greater” ocean heat uptake [efficiency]. If you are confused by my summary, you need read the paper.
What wasn’t clear to me when I wrote above, is that there is another pattern effect associated with the use of only CO2 forcing in 1% pa experiments compared with all forcing agents in experiments that simulate historic forcing. Models have different ocean heat uptakes in different experiments because more or less warming is being sent to locations where ocean heat uptake is more or less efficient. This data is shown in Figure 3. TCR calculated from 1% pa experiments (with only rising CO2) is a massive 0.7 K greater than from experiments with historic forcing in the GFDL and Hadley models. This brings TCR for the GFDL model from 2.05 K to 1.32 K – in agreement with 1.35 K determined for the same period by Lewis and Curry (2018). This difference is much smaller or negligible in other models. The data needed to extract both lambda and kappa calculated from historic runs is only available for eight models and four of these now have TCR from historic runs that is within the confidence interval calculated by Lewis and Curry. (Only two were in agreement when TCR was determined from 1% pa experiments.)
FWIW, I’ve long thought the ocean heat uptake is poorly simulated when the mixed layer warms several degK in the first few years of 4X experiments (long before heat can penetrate deeper), making the ocean much more stably stratified. Nic Lewis has repeatedly reminded me that ECS from 1% pa experiments agreed fairly well with 4X experiments. Perhaps that generalization will change.