In VI – Australia CanESM2, CSIRO, Miroc and MRI compared vs history we looked at how each model thought rainfall had changed in Australia over about 100 years, and we compared that to observations. We did this for annual rainfall, also for Australian summer (Dec, Jan, Feb) and Australian winter (Jun, Jul, Aug).
Here we will look at two of the four emissions scenarios. We compare 2081-2100 vs 1979-2005.
Note that we are not comparing the end of the 21st century from the model with observations at the end of the 20th century. That produces much different results – the model’s view of recent history doesn’t match observations very well. We are comparing the model future with the model past. So we are asking the model to say how it sees rainfall changing as a result of different amounts of CO2 being emitted.
The two scenarios are:
- RCP4.5 – with current trends continuing we are something like RCP6. I think of RCP4.5 as being “what we are doing now” but with some substantial reductions in CO2 emissions. But it’s nothing like RCP2.6, which is more “project Greta” where emissions basically stop in a decade
- RCP8.5 – extreme CO2 emissions. Often described as “business as usual” perhaps to get people’s attention. Think – most of Africa moving out of abject poverty, not passing through the demographic transition (so population going very high) and burning coal like crazy with the efficiency of 19th century Europe.
Each pair of graphs is future RCP4.5 as % of recent past, and RCP8.5 as % of recent past. The four models, clockwise from top left – MPI (Germany), Miroc (Japan), CSIRO (Australia) and CAN (Canada):
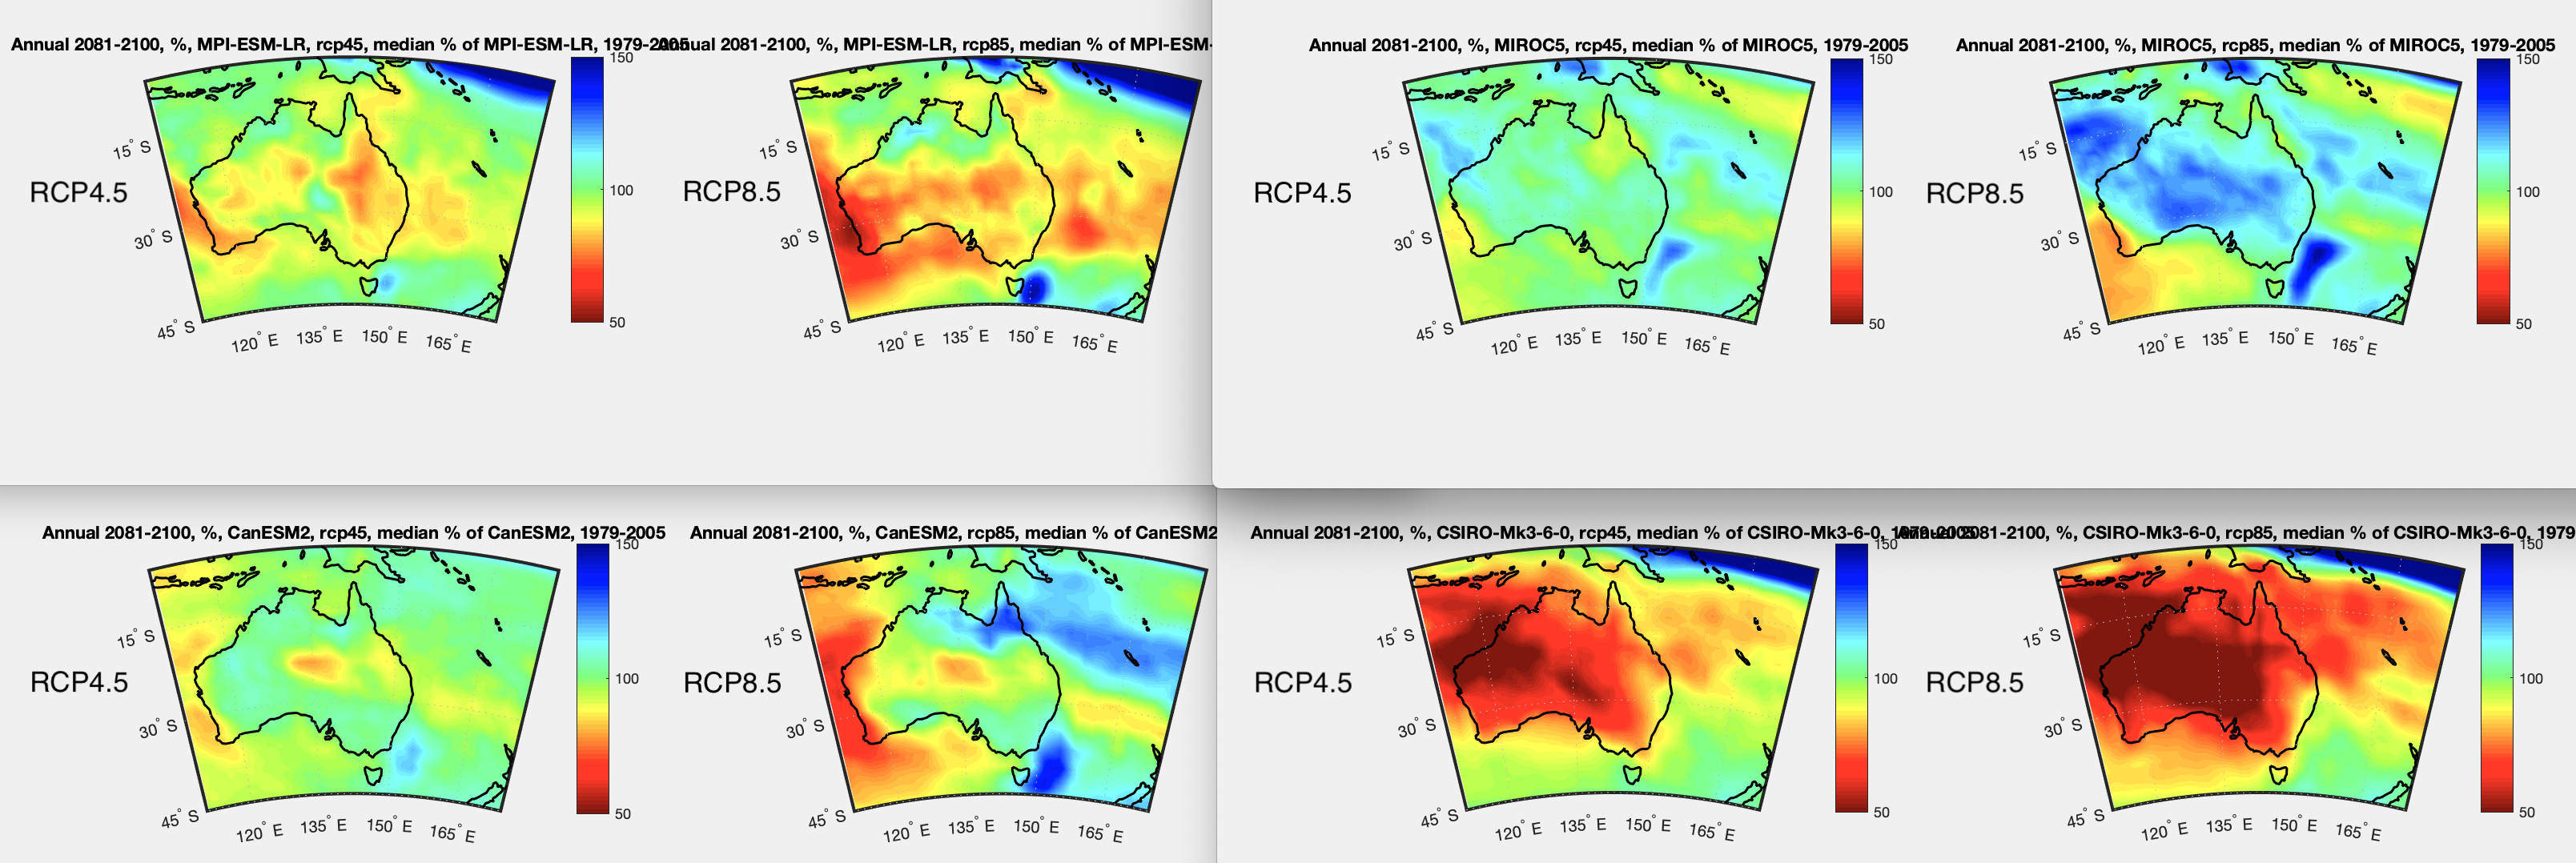
Figure 1 – Click to expand
And now the same, but only looking at Australian summer, DJF:
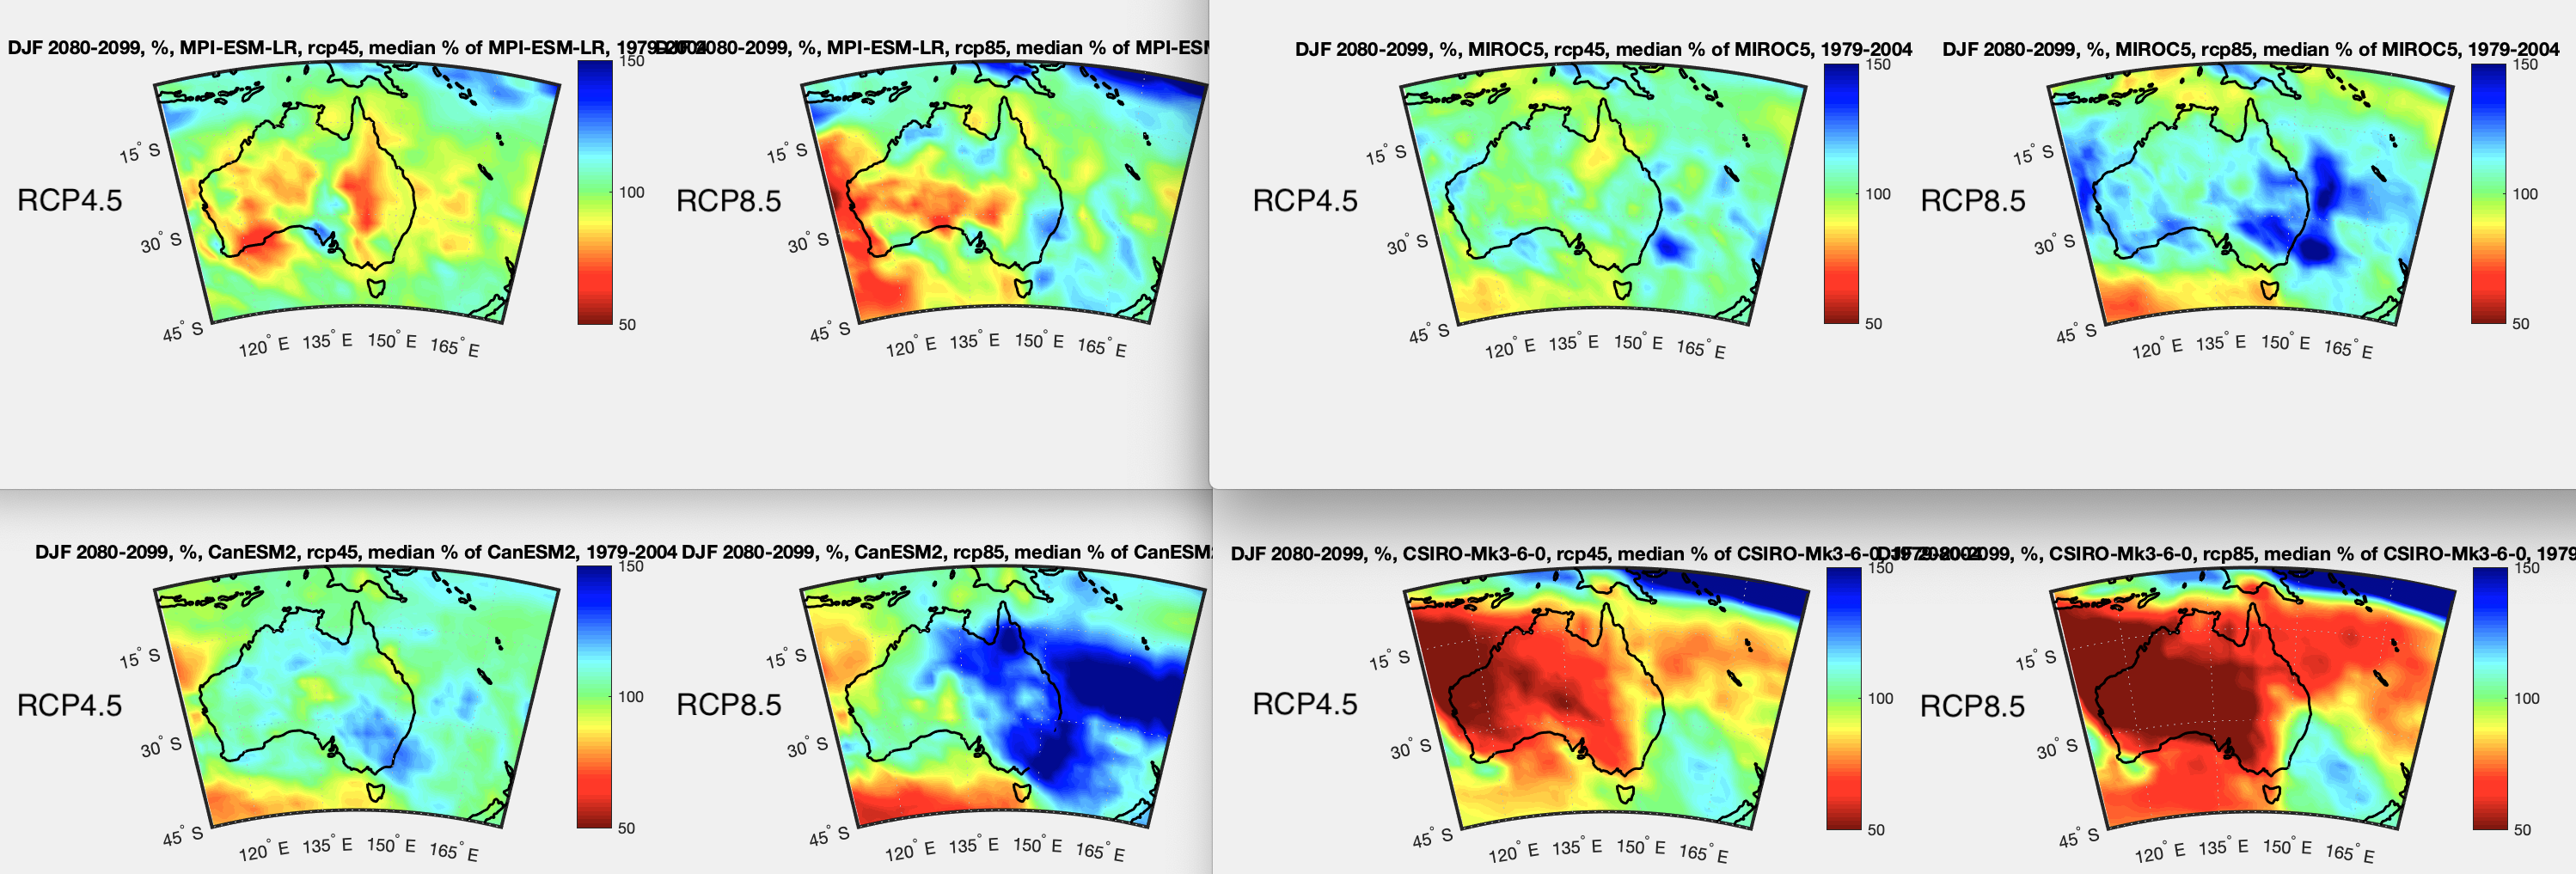
Figure 2 – Click to expand
Depending on which model you like, things could be really bad, or really good, or about the same with “climate change”.
Note that the color scale I’m using here is the same as the last article, but different from all the earlier articles, the % range is from 50% to 150% (rather than 0% to 200%).
References
An overview of CMIP5 and the experiment design, Taylor, Stouffer & Meehl, AMS (2012)
GPCP data provided by the NOAA/OAR/ESRL PSL, Boulder, Colorado, USA, from their Web site at https://psl.noaa.gov/
GPCC data provided from https://psl.noaa.gov/data/gridded/data.gpcc.html
CMIP5 data provided by the portal at https://esgf-data.dkrz.de/search/cmip5-dkrz/


SOD: I appreciate all of the work that went into making these posts. As best I can tell from them, there is little reason to have much confidence in the changes they predict. … which is frustrating without some overall rational or concept that explains what models do well in predicting precipitation and what they do poorly.
The one thought that keeps coming to my mind is that the change in global precipitation is tightly constrained by thermodynamics and probably can’t be much different from a 2% per degK increase. So all future large changes in precipitation are shifts from one location to another. Your plots of absolute change in precipitation accurately convey information about the largest shifts in precipitation, but the % change plots do not. IIRC, the largest precipitation shifts are into the Pacific ITCZ and from areas on either side of the ITCZ. It would be nice to have a rational for this prediction. I’ve reviewed plots for other big shifts, but didn’t retain any concepts.
SOD: I really like this Hovmoller diagram of precipitation from Dai (2005) because it provides a mechanism (or illusion of a mechanism) by which seasonal change effects precipitation: The ITCZ and the attached Hadley cells move north and south with the seasons. If an AOGCM did a good job of reproducing this phenomena in a particular region – say Australia or India – I might be inclined to place more faith in that model’s ability to predict changes in rainfall associated with predicted changes the ITCZ and Hadley cell. During the African humidity period, the same tropical monsoon that currently penetrates north into India (to 30 degN) during the summer (second row of figures) is believed to have penetrated north into the Sahara and Saudi deserts instead of stopping at about 15 degN as it does today (first row of figures). This change in northern extent of the African monsoon about 6000 years ago is believed to be associated with changing orbital mechanics, but AOGCMs fail to predict a green Sahara during the African Humid Period. There is a band of semi-arid land in the NH and SH subtropics where precipitation occurs almost exclusively during the summer and is associated with movement of the ITCZ. The projected precipitation changes in these arid regions might be meaningful if the model did an accurate job of reproducing changes in this transition zone – say in El Nino vs La Nina years or after volcanic eruptions. The failure to predict a green Sahara during the African Humid Period (which was studied as part of CMIP) is a sign that the predictions of change in this region (with large % changes) shouldn’t be considered reliable.
Unfortunately, in temperate regions precipitation is associated with weather fronts that generally move east (or northeast or southeast). IIRC, most of the rain in the eastern half of the US comes from moisture moving northeast (or north) from the Gulf of Mexico. Since storm tracks generally follow undulations in the jet stream, a Hovmoller diagram with latitude on one axis wouldn’t illuminate this mechanism. To some extent, the jet stream is often moving northeasterly in Western US plus southeasterly in the Eastern US OR southeasterly in the Western US and northeasterly in the Eastern US producing distinctively and opposite warmer/cooler and rainy/dry weather. Since the undulations in the jet stream are highly chaotic, I’m skeptical that models have the ability to predict a shift in precipitation from one side of the country to the other. On the other hand, during El Ninos, more storms penetrate the West Coast of the US further south than usual, bringing more snow to the Sierras in California and less to the Cascades in Washington and Oregon
Fig. 3. Zonally averaged precipitation (mm day−1) as a function of latitude (vertical coordinate, negative for the Southern Hemisphere) and month averaged over 1979–99 from (left) observations (CMAP) and (second column from left) one of the better and (right column) worse model simulations, together with the (third column) average of the 18 models. The zonal averaging was done for six longitude sectors (from top to bottom): Africa and Europe (10°–40°E), the Indian Ocean and Asia (60°–110°E), the western Pacific Ocean and Australia (115°–155°E), the central Pacific (165°E–135°W), the eastern Pacific and North America (80°–120°W), and the Atlantic Ocean (15°–40°W).
Frank,
The graphic didn’t show up in your comment (wordpress has some rules on graphics inserted in comments that I don’t understand).
Here it is, from Precipitation Characteristics in Eighteen Coupled Climate Models, Aiguo Dai, AMS (2006):
Click to enlarge
SoD.
If I click on the link in Frank’s comment, it says ‘page not found’. That may be one reason that they didn’t show up. Also, at lucia’s The Blackboard, I think you need author privileges to post images.
DeWitt,
Thanks. You know, I’m sure you figured it out here before.
I have a recollection (from you or someone else that did it) that the graphic needs to be from a wordpress site, and there are a few other graphics sites that wordpress will show graphics from.
SOD: Thanks for posting the Figure. I’ve been reasonably successful getting figures to display in comments recently, but I don’t have a clear understanding of what does and doesn’t work.
SoD, just checked in, interesting series thank you, good to see you back.
Hello – checking out this site – recently recommended to me .. may I ask who is the author and possibly their background? Thanks.
I don’t know and I don’t care. The idea that one needs proper credentials before one can be credible is unfortunate. Why not read some of the posts and comments and see for yourself.
Hope: In today’s world, there can be advantages to remaining anonymous at websites, and big disadvantages if you want credibility. On the other hand, someone can have loads of credentials, but be more interested FOR POLITICAL REASONS in telling you what to THINK about climate science. “In about this blog”, our host tells us:
“Opinions are often interesting and sometimes entertaining. But what do we learn from opinions? It’s more useful to understand the science behind the subject. What is this particular theory built on? How long has theory been “established”? What lines of evidence support this theory? What evidence would falsify this theory? What do opposing theories say?”
Our host takes you on a journey to find answers to such questions and usually provides references with each article. On a journey of exploration, you get to decide what to think, which is why both smart skeptics and supporters of the consensus hung out here. My recently, Professor Dessler has come to explain why his latest paper has the answers.
Hope,
Thanks for your interest. My name is Science O’ Doom, an interesting choice from my parents that I’ve had to suffer my whole life – no, I’m kidding (on the internet there’s always someone who doesn’t get the joke).
The idea of this site, which came to me in a dream (again, that bit, kidding) is to look at climate science critically. That does mean actually reading what climate scientists have written and published (unlike most inappropriately-named “skeptic” blogs).
The motto of possibly the oldest continuing scientific society in the world, the Royal Society, is “take no one’s word”.
It’s not “we believe the science”. And it’s not “we believe the scientists selected by journalists”, which is what “believe the science” actually means in practice.
It means, weigh up the evidence.
So, who I am is irrelevant. The scientific method is to look at the evidence and the arguments.
If someone is Super Distinguished Professor of Climate Science at The Most Prestigious University Ever then maybe you might just want to take their word for it. Me, not so much.
I’m pretty sure most climate scientists would agree with this approach.
scienceofdoom,
The 33 Deg C greenhouse effect. In the land,oceans and atmosphere, how many Joules of heat content is that.
I apologize for jumping into a post but I was reading through some of your archives on Gerlich because I’ve been following and occasionally commenting on a climate change discussion on an AIChE discussion board. The gentleman that runs this website (https://www.coatsengineering.com/Sustainability_and_CO2.htm) is spouting out his argument against the “mass conspiracy theory by NASA and other governments to push forth the false idea of CO2 caused global warming”. I have not attacked his theory much but I was asking where he got some of his assumptions (plant respiration is negligible in terms of exotherm vs the endotherm from photosynthesis and we just need to stop polluting the oceans with plastics and let plants do their job). I am about to go read your CO2 an insignificant trace gas posts. What are your thoughts on his disproofs? I read a small portion of the Gerlich rebuttal of Halpern’s comments on his paper and Mr Coats sounds a lot like Gerlich in his dismissal of well everyone but the people that agree with him. I don’t think I could say anything to dissuade him at this point as he just seems to go from engineering site to engineering site to start arguments. I just want to make sure I understand his flaws.
I can repost this under one of the CO2 discussions if you would prefer?
Noel: You aren’t likely to have any intelligent discussion with a guy like Coats that lists more than a dozen faulty and simplistic arguments about why rising CO2 can’t cause warming. If you are bothered by any one of his arguments (or you can get him to pick one argument at a time that he finds most convincing), then someone might be willing to help you address it. However, the real problem is confirmation bias – many people have a difficult time assimilating and recalling information that conflicts with their deeply-held beliefs – which often originate from politics, not science. With more than a dozen argument, Coats won’t be able to recall the any flaws you might point out in Rational #1 by the time you get to Rational #4.
Gerlich also discusses a variety of rationals and the same advice applies there.
Yes I agree, I just wanted to learn more for myself so I think I’ll just continue to read the backlogs here. Any other sites you recommend? Coats argument for the cause of global warming is basically the decrease in photosynthesis from mass plant death, not CO2 concentration changes. I tried to discuss his assumption to neglect plant respiration and he said “we have oxygen in the atmosphere”. I pretty much stopped talking to him there and then got lost down the rabbit hole of science!
Mass plant death??? That’s definitely going to be the funniest thing I’ve heard today and possibly in quite some time. All indications are that total active (alive) biomass has increased a lot over the last few decades. You’re not going to convince someone who believes that to change his mind about anything. I’m reminded of the paper I saw some time ago which claimed that when the CO2 level in the atmosphere went above 400ppmv, we were all going to die. Apparently the author was unaware that the CO2 level in nuclear submarines on long underwater missions reaches about 2%.
Yes DeWitt he is quite convinced that if we stop wasting money on the whole CO2 “conspiracy” and just regulate dumping, increase plastics recycling, and stop deforestation and death of marine plants we’ll be ok because the increased photosynthesis of the plants not being killed off by pollution will cool the earth eventually and reverse the warming….
Every blog has an agenda that motivates the host to do the work. Our host was motivated to explore the fundamental physical processes important to climate change. If that is what you want to learn, you are in the right place. When comments suggest that a message wasn’t getting through, the host addressed the issue. I personally find it hard to find this I remember reading (clever titles make this more challenging), so use the road map and consider reading series rather than chronologically.
From my perspective, climate change can be divided into two basis problems: 1) How GHGs slow radiative cooling to space – radiative forcing in W/m2. 2) How much warming is required to compensate for radiative forcing and restore balance at the top of the atmosphere – the climate feedback parameter measure in W/m2/K. The reciprocal of the climate feedback parameter is climate sensitivity which is reported in units of K/doubling rather than K/(W/m2). A summary of posts on radiative forcing can be found at the link below.
IMO, one of the biggest problems is that emission and absorption of radiation are taught as two separate subjects: 1) Absorption spectroscopy and Beers Law in the laboratory using a very intense light source to make emission negligible. 2) Emission of blackbody (which many don’t recognize is radiation where emission and absorption are in equilibrium. From absorption spectroscopy, we know that absorption by GHGs involves many lines or bands, but GHG’s certainly don’t emit a blackbody spectrum of radiation. The combined effects of absorption and emission by GHGs are calculated using radiative transfer calculations, but the equations and physics of those calculations isn’t commonly taught. After spending a long time putting a lot of pieces together that I was introduced to here, I tried to compress the fundamentals of radiative transfer calculations into the below Wikipedia article. (Since I haven’t gotten much feedback on the article, I suspect it doesn’t meet the needs of many readers.)
https://en.wikipedia.org/wiki/Schwarzschild%27s_equation_for_radiative_transfer
Thanks Frank!
The formulas of Gibbs are more instructive and have been placed in free software libraries (TEOS-10). Einstein called Gibbs the best scientific mind of all time (The World According To Measurements – 12).
Antarctica is the largest desert on Earth. The Sahara gets more rainfall (Hot, Warm, & Cold Thermal Facts: Tidewater-Glaciers – 8).
The origin of sea level change there is a ‘Grounding Line’ story. Check it out.
You know what is still missing on this site? A part two of.. https://scienceofdoom.com/2010/12/27/emissivity-of-the-ocean/
I mean there is, kind of, but it comes to a very different conclusion..
https://greenhousedefect.com/what-is-the-surface-emissivity-of-earth
You stated “the model’s view of recent history doesn’t match observations very well”
Can you please expand on that:
What models?
How bad were they?
SOD
I have been working on maths problems for many years with a special interest [fixation] on Fermat’s theorem.
–
That is no two positive integers to a power of 3 or greater can ever form a third integer to that same power.
–
The answer, which would fit in the margins of a book as Fermat proposed is as follows
“The sum of two cubes is 2 identical cubes plus a gap
When the sum is a cube and the gap is a cube the first cube has to be two identical cubes
Yet two identical cubes can never be a cube.
Therefore the first cube can never be a cube if the gap and sum are cubes.
Only a non cube can add to a cube to make a cube
This proof applies to all powers 3 or greater.”
–
I hope you do not mind me tucking it into your blog.
If it proves reasonable with no flaws please let me know.
The WaPo just had a big article on the drought in the West and the dramatic fall in reservoirs on the Colorado River since 2000 – which, of course, they blame on climate change. Figure 25.3 in the Fourth Nation Climate Assessment has a collection of four figures (river flow, water storage, temperature, and precipitation) that summarize the story:
https://nca2018.globalchange.gov/chapter/25/
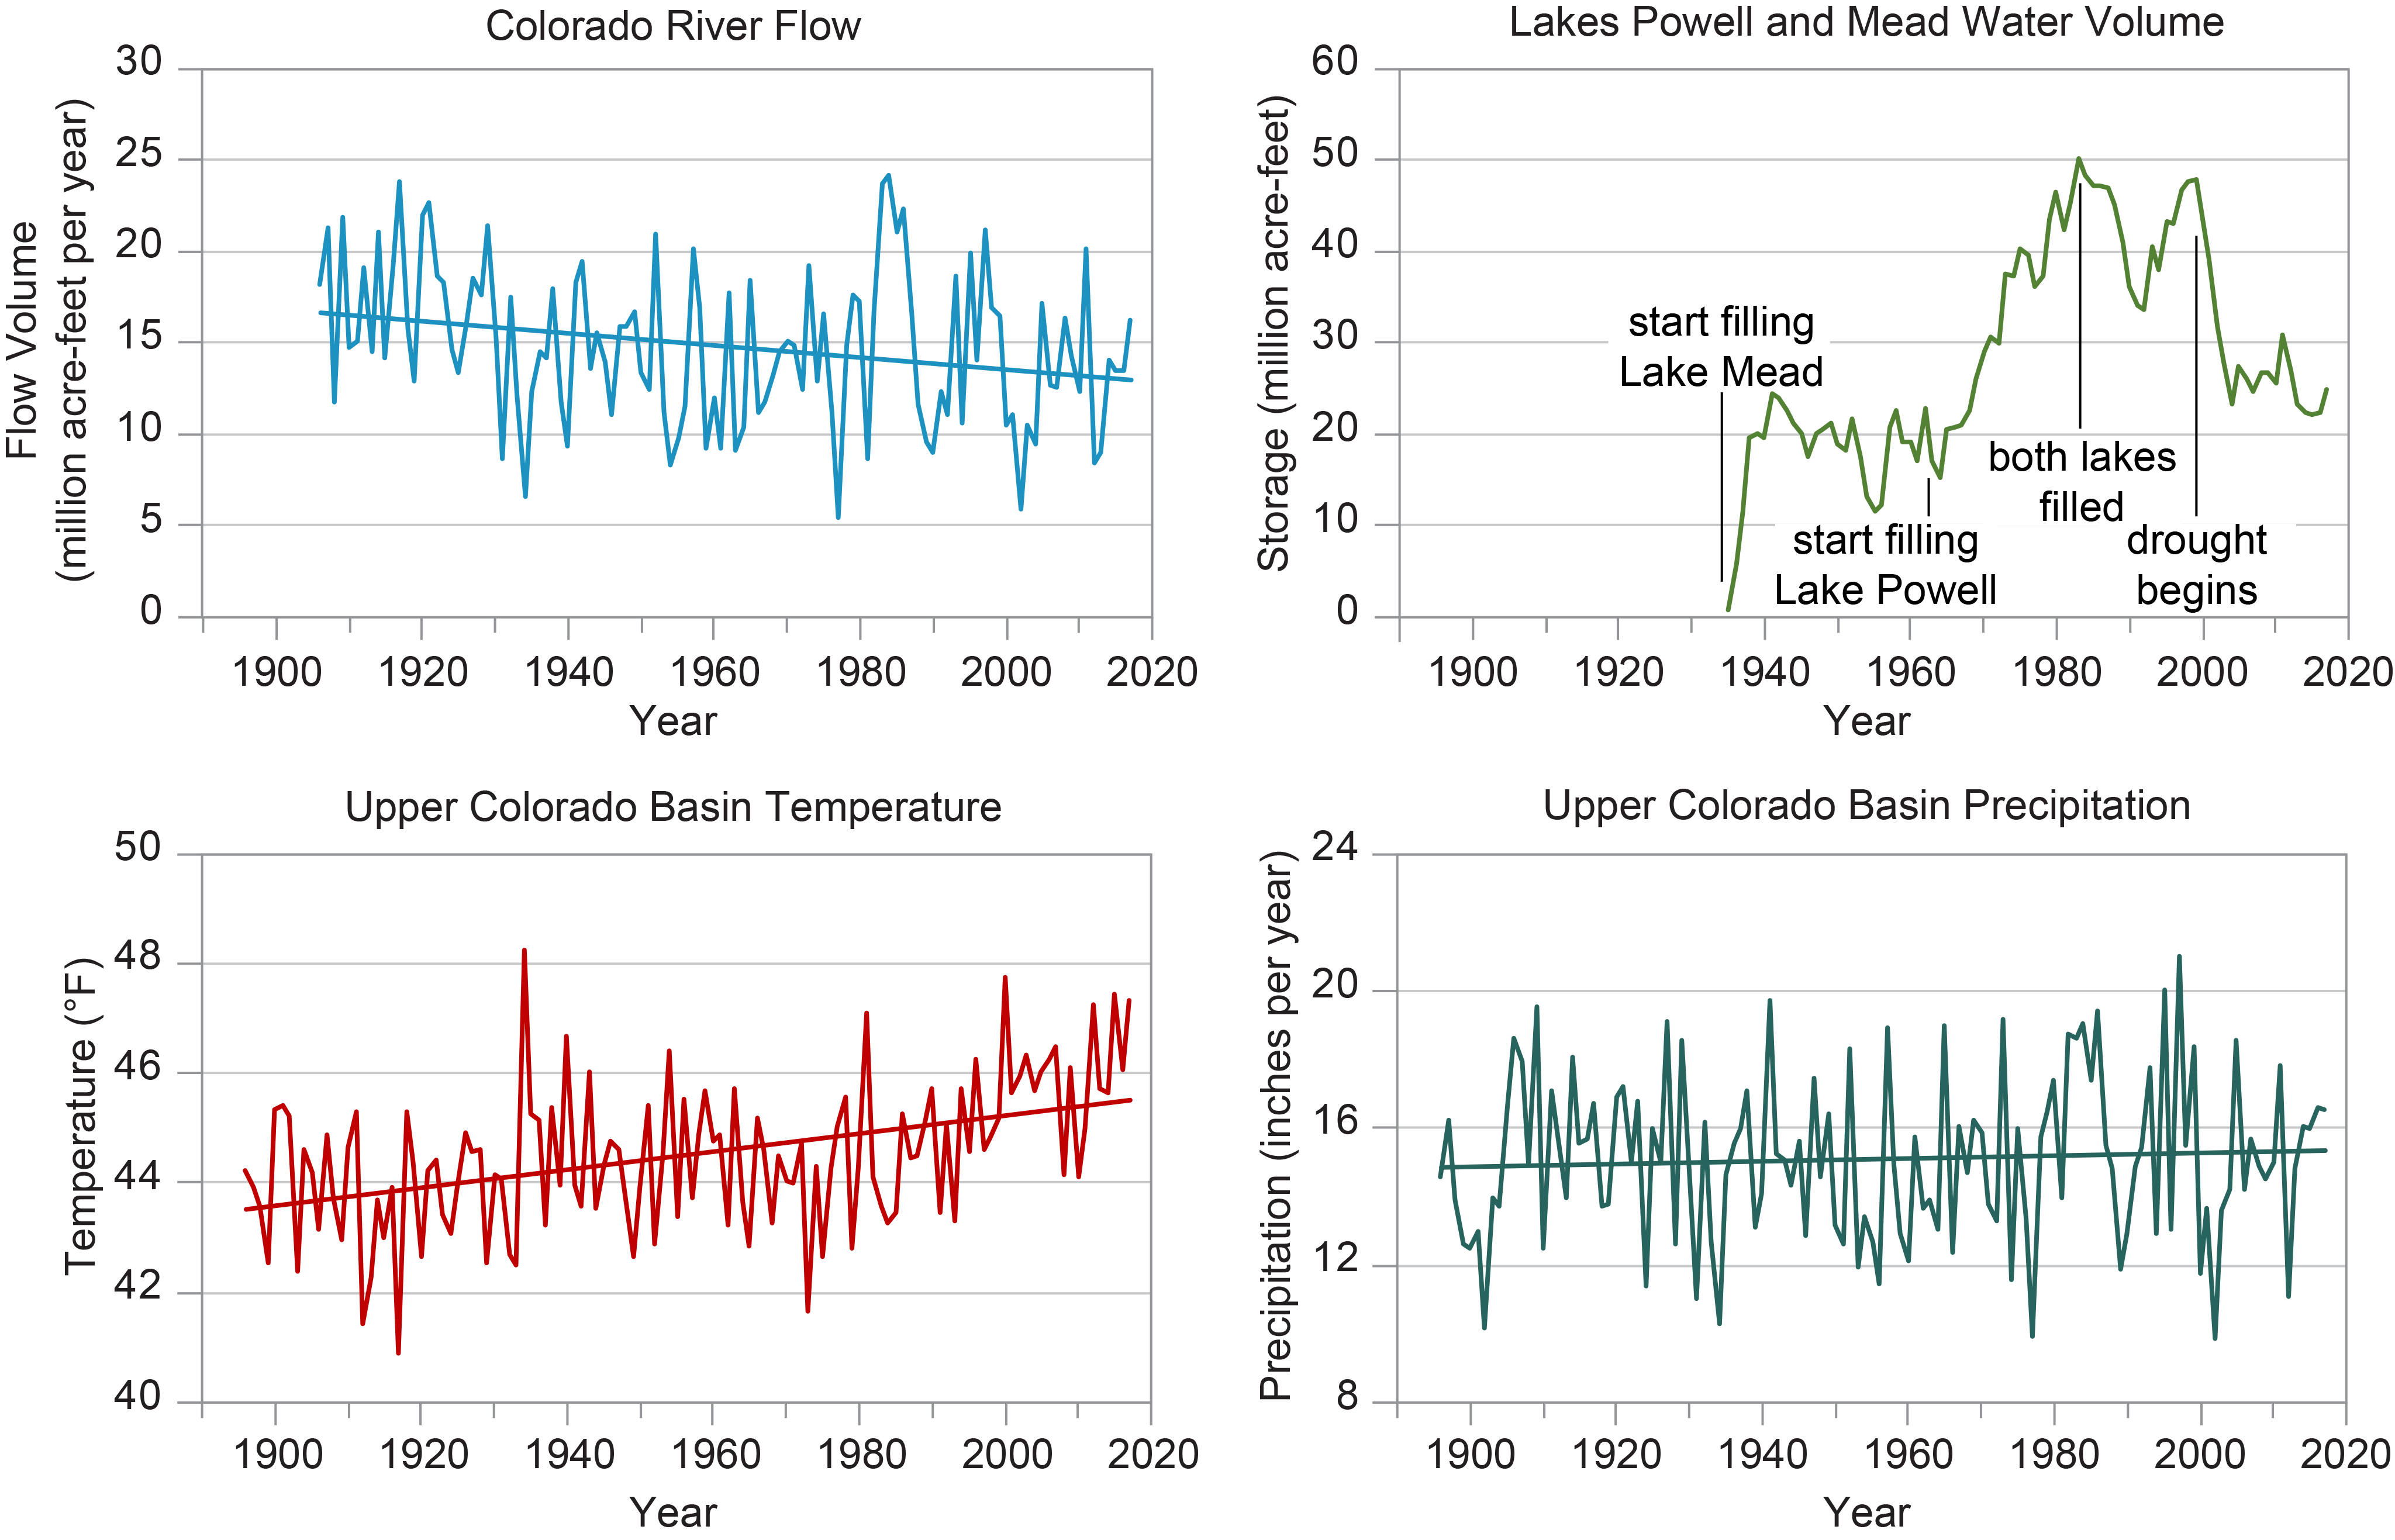
Water storage in Lakes Mead and Powell had dropped below 50% of maximum storage when this NCA was written in 2017 and apparently have fallen significantly further in the past few years and flow from the Upper Colorado into these reservoirs has slowed about 20-25% over the past century. However, there is no long-term decrease in precipitation (a slight increase if anything) in the Upper Colorado River basin, consistent with model trends for GLOBAL precipitation increasing 2% per degK. Temperature has risen about 1 degC, so increasing drought over the century is associated with rising temperature (and rising evaporation), not decreasing precipitation.
However, if evaporation (and transpiration) increase 7% per degK rise, increased evaporation can’t account for most of the reduced flow from the Upper Colorado. One hypothesis is river flow and water levels are low on the Lower Colorado because more water is being diverted from the Upper Colorado for agriculture and cities. Another hypothesis is that transpiration increases with temperature more than 7% per degK. I couldn’t find a clear answer to my second hypothesis. Transpiration also depends on relative humidity and wind speed, but these aren’t supposed to change globally in response to climate change. Plants conserve water during droughts by closing their stomata, so 7% might even be an over-estimate. However, there is clearly a negative short-term correlation between temperature extremes and low flow in the river. The hottest year (4 degF above the long-term trend) was during the mid-1930’s (presumably 1935) is associated with the third lowest flow. The second (2000?) and third (1980?, tied) hottest years are associated with the second and third lowest flows. This doesn’t tell me whether increased human diversion or increased transpiration is responsible for low flow, but diversion in the 1930’s seems less likely.
If anyone has reliable information about how transpiration is expected to vary with temperature, I would greatly appreciate a link. We could adapt to a 7% increase in transpiration per degC, but a 20-25% change per degC in Colorado River flow would be a far more serious matter.
FWIW, Reconstructions from drought-sensitive tree rings, suggest that droughts more severe than today’s occurred in the late 16th, late 19th and mid 11th centuries. The late 19th century isn’t known as a particularly warm period, this drought may have been due to lower rainfall.
https://agupubs.onlinelibrary.wiley.com/doi/full/10.1029/2005WR004455
Of course it’s climate change, that’s a truism. The term ‘climate change’ is redundant. In fact the climate isn’t stable, making ‘stable climate’ an oxymoron. The question is whether it’s primarily anthropogenic or not. With the current state of climate models, as you point out below, it’s not possible to say.
Thanks for the replies. Alarmists make a big deal about the increase in drought associated with a warmer climate. It’s always been clear to me that drought associated with climate change on a global scale (where evaporation must come down as precipitation somewhere) is associated with an increase in evaporation and transpiration. If these go up 7% per degC of warming, the drought associated with warming isn’t going to be catastrophic.
In the above data for the first time, I see a possibility of catastrophic drought accompanying warming: A roughly 25% decrease in Colorado river flow accompanying a 1 degC increase in temperature on a century time scale that is not caused by a decrease in rainfall [natural variability]. 2 degC of warming and 50% less river flow would be catastrophic. On an annual time scale, I see a 50% reduction in river flow in 1935 when natural variability raised the temperature 4 degC for one year.
Thanks to your comments on distinguishing between natural variability and climate change, I now see how the problem could be approached using the the equation below:
RF(Y) = a*P(Y) – b*dT(Y) – D(Y)
where RF(Y) is River Flow in year Y, P(Y) is precipitation in year Y, dT(Y) is the temperature anomaly in year Y, D(Y) is diversion to cities and farms from the Upper Colorado in year Y and a and b are constants. b*dT(Y) would be a 7%/K reduction in river flow if evaporation and transpiration increased 7%/K. However, all of the decreased river flow in the last century were due to a 25%/K increase in transpiration. The low flow in 1935 is due to 50% less rainfall that year and the increase transpiration associated with 4 degK of [unforced] warming
There must be a number of highly sophisticated models that predict river flow based on precipitation, temperature, diversion (if any), deficit in soil moisture from previous year, etc. If b in these sophisticated models were 25%/K, we would be hearing much clearer screams that increased transpiration associated with 4 degK of global warming will consume the entire flow of the Upper Colorado, leaving none for Phoenix, Las Vegas, LA and power generation. The groups I encountered briefly searching for information seemed to be focused on the real river today facing natural variability and not the river in a climate model.
Frank,
If the relative humidity remains constant, then the total water content of the atmosphere goes up by about 7%/degC. I don’t think that requires the rainfall to increase by the same amount. That would also be a substantial increase in the latent heat transfer, which would be a negative feedback and keep the climate sensitivity at the low end of the range, I think. If rainfall is more or less independent of temperature, then the evaporation would only increase until the correct water content was reached and then evaporation and precipitation would become balanced again.
Also, if the land surface temperature is increasing faster than the sea surface temperature, won’t there be a net transfer of water from land to sea? That seems logical to me and would certainly happen in a small closed system with two pans of water at different temperatures. The warmer pan would cool from evaporation and the cooler pan would warm from condensation.
DeWitt wrote: “If the relative humidity remains constant, then the total water content of the atmosphere goes up by about 7%/degC. I don’t think that requires the rainfall to increase by the same amount. That would also be a substantial increase in the latent heat transfer, which would be a negative feedback and keep the climate sensitivity at the low end of the range, I think.”
If vertical transport of water vapor (latent heat) rose 7% per degK of global warming, that would carry and additional 5.6 W/m2 per degK of global warming from the surface to the atmosphere, However, that much radiation isn’t emitted as LWR or reflected as SWR per degK of global warming. The climate feedback factor is probably between 1 W/m2/K (ECS = 3.6 K/doubling) or 2.5 W/m2/K ( ECS = 1.44). So the vertical transport of water vapor (or the “overturning” of the troposphere) must slow.
Slowing of vertical transport of water vapor from the ocean starts with slowing of evaporation, which depends on wind speed and undersaturation of the air immediately above the ocean. Isaac Held discusses some of this in the post linked below:
https://www.gfdl.noaa.gov/blog_held/47-relative-humidity-over-the-oceans/
DeWitt,
Another factor (in accord with evap % is not axiomatically equal to rainfall %) is that hot/warm flows to colder/cooler molecules/atoms in seawater (via infrared photon transport) downward to cooler depths … https://blogdredd.blogspot.com/2020/03/quantum-oceanography-2.html
The information on the drought inn the Colorado River Basin posted above made me wonder what climate models were predicting for the change in precipitation in this river basin, a subject explored for Australia in this post. AR6 WG1 Figure 10.13a has some interesting new information bearing on this subject. 100 runs of the MPI-GE model driven with all natural and external forcing completely fail to reproduce the 1983-2014 precipitation change from wet to dry. Some runs show an increase in rainfall in the Southwest and other shown a decrease similar to observations, with the mean showing a 0-5% decrease in the western US (except Washington) and a 0-5% increase in the east. However, 100 runs with a different climate model forced with observed SST’s (and ENSO, PDO, etc) did a much better job on the average of reproducing the location and magnitude of the current drought, although the wettest runs still showed drought only in Northern Mexico and a slight increase in rain everywhere else. a very modest increase in rainfall everywhere except Northern Mexico.
https://www.ipcc.ch/report/ar6/wg1/downloads/report/IPCC_AR6_WGI_Chapter10.pdf Page 1422
This reminds me of the low climate sensitive observed with climate models forced by observed SSTs rather than rising GHGs and aerosols. Either the pattern effect of misplaced warming in AOGCM or the pattern effect of unforced variability the location of warming over the past few decades explains why climate models predict more warming that we have observed so far. The IPCC believe unforced variability is responsible, but they can’t reproduce it in the output of even 1 in 100 model runs. The inability of models to reproduce SST patterns means models probably can’t be used to make useful regional predictions about future drought.
The southern portion of the Colorado River watershed is also threatened by the expected poleward shift of the descending branch of the Hadley circulation and associated subtropical deserts. AR6 no longer believes this will be an important factor in climate change in the NH:
“However, several studies based on modern reanalyses and CMIP5 models have recently shown that the current contribution of GHGs to Northern Hemisphere tropical expansion is much smaller than in the Southern Hemisphere and will remain difficult to detect due to large natural variability, even by the end of the 21st century.”
Climate models have been useless for regional forecasts since ever. I see that nothing has changed.
See by seaports (Seaports With Sea Level Change – 22).