In the last article we looked at a comparison between Miroc (Japanese climate mode) and MPI (German climate model). See that article for more details.
Now we add CanESM2 and CSIRO-Mk3-6-0 to the comparison.
CanESM2 is a Canadian climate model, with an ESM component – this is an earth system model, basically it means that CO2 emissions are explicitly controlled, but not the atmospheric CO2 concentration (so the model simulates aspects of the carbon cycle). Their model has 5 historical simulations and 5 each each of three RCPs (skipping RCP6 like many other CMIP5 contributors)
CSIRO-Mk3-6-0 is an Australian model. Their model has 3 historical simulations and 10 each of the four RCPs.
As in the previous article, MPI, Miroc, CAN and CSIRO for RCP4.5 for 2081-2100. Each graphic – the median of all of the simulations as % of the median of that model’s historical 1979-2005 simulations:
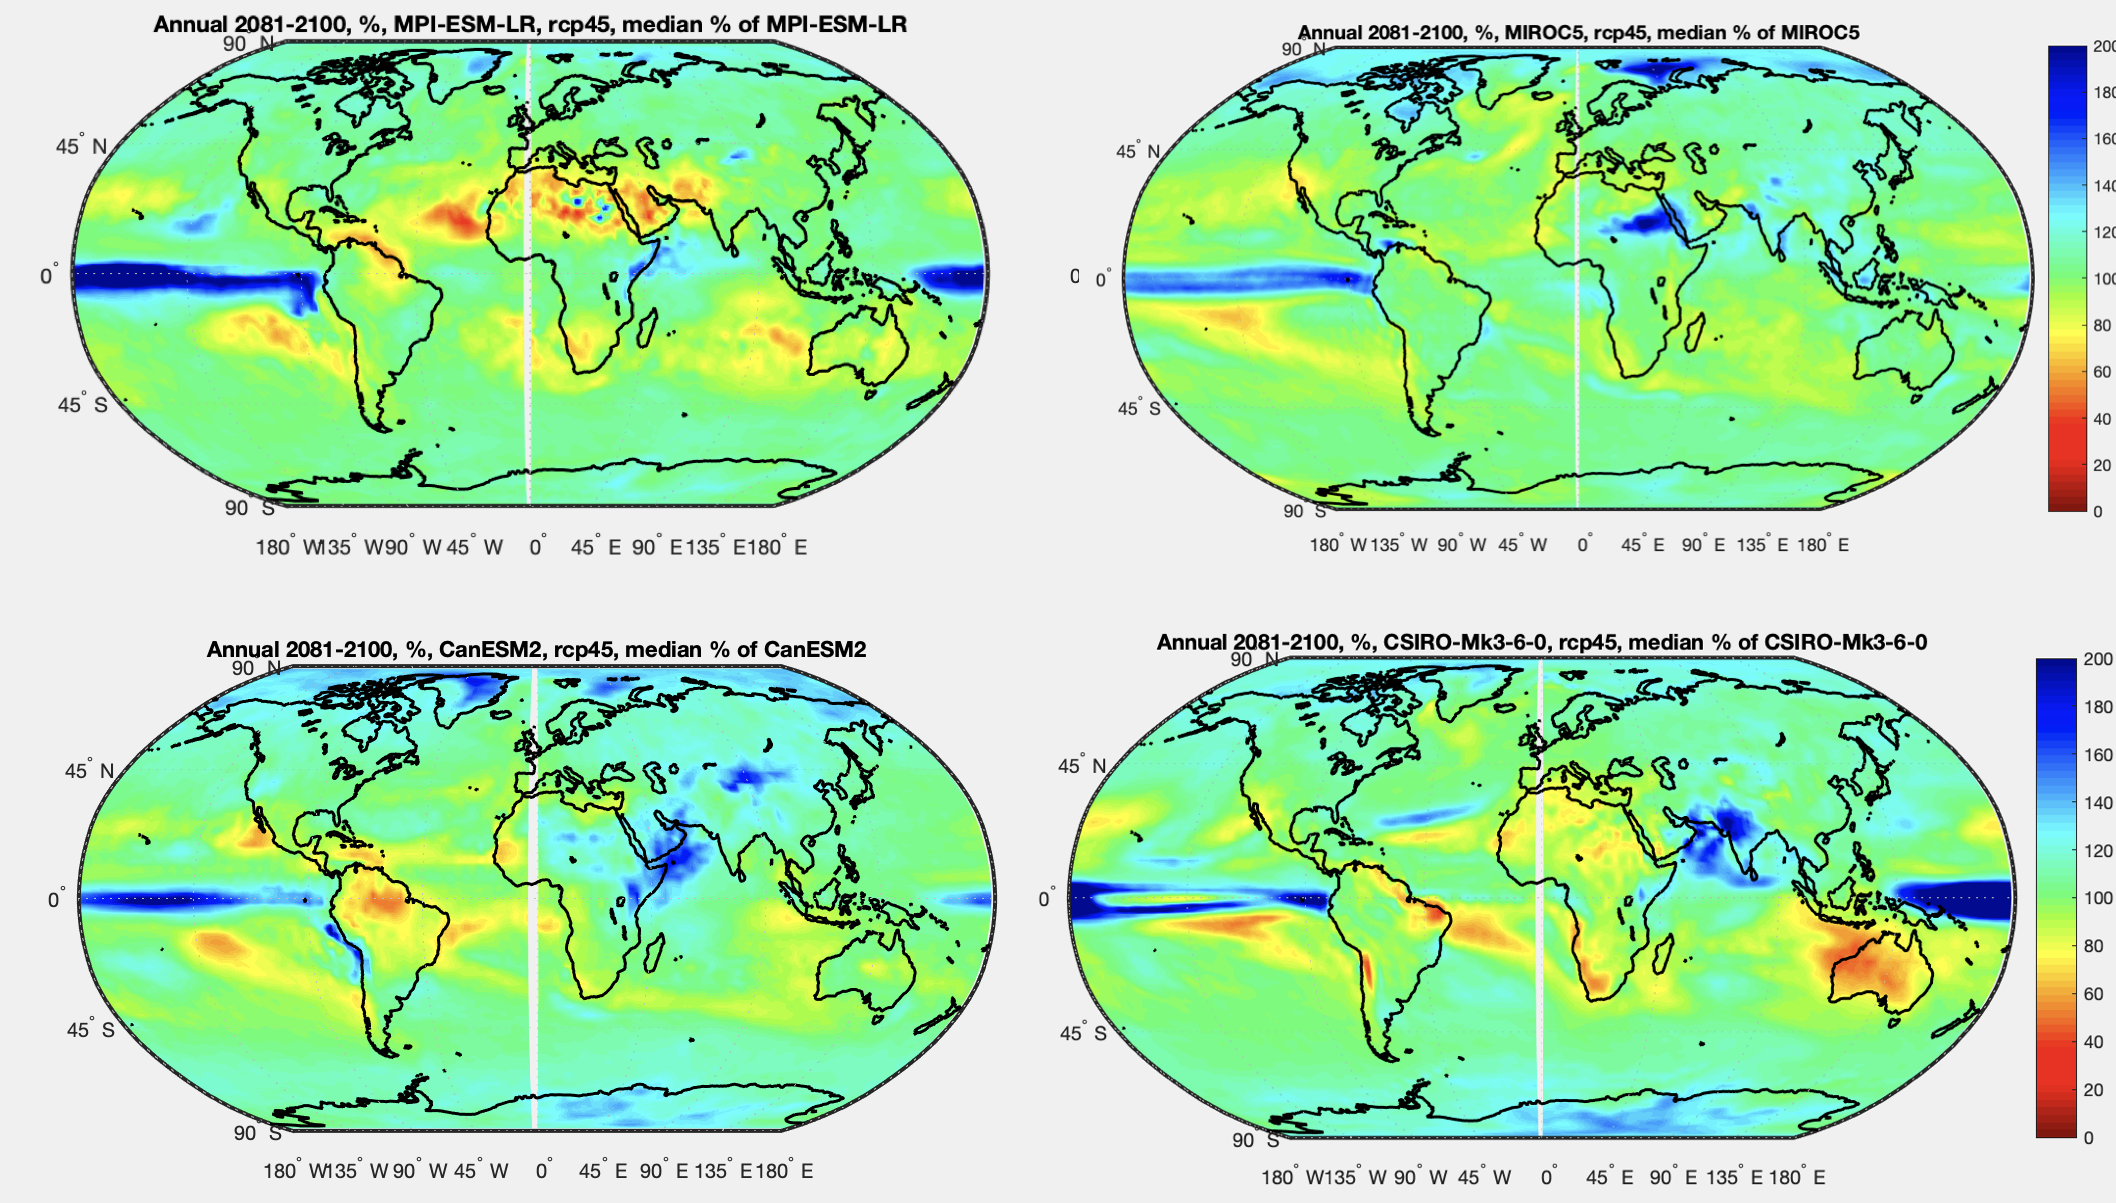
Figure 1 – MPI, Miroc, CAN & CSIRO for RCP4.5 (%) – Click to expand
And for RCP8.5 for 2081-2100
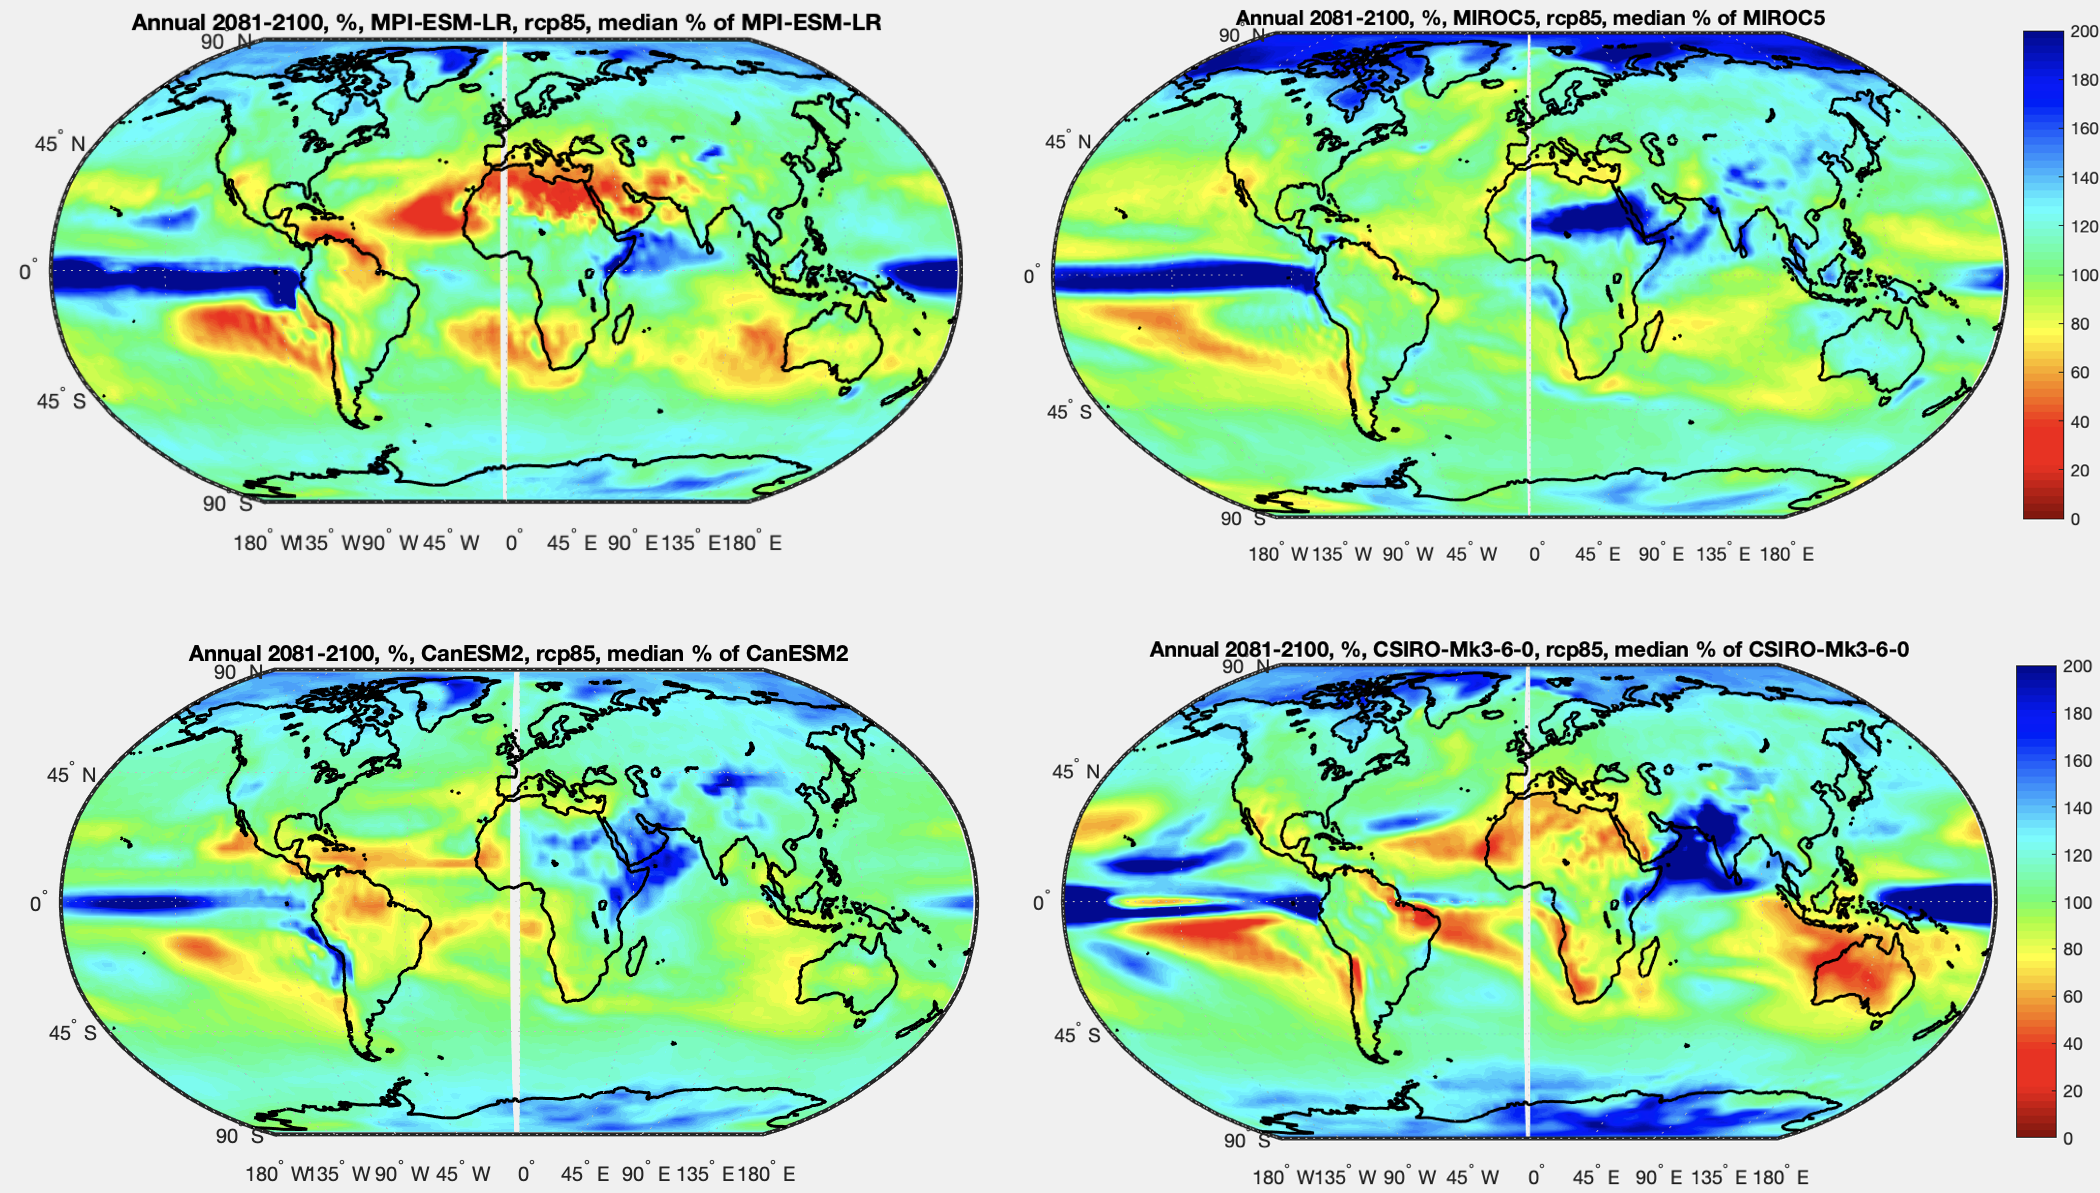
Figure 2 – MPI, Miroc, CAN & CSIRO for RCP8.5 (%) – Click to expand
And comparisons of each models’ historical runs (the median of multiple runs): % of observations (GPCC) over 1979-2005. So blue means the model over-estimates actual rainfall, whereas red means the model under-estimates:
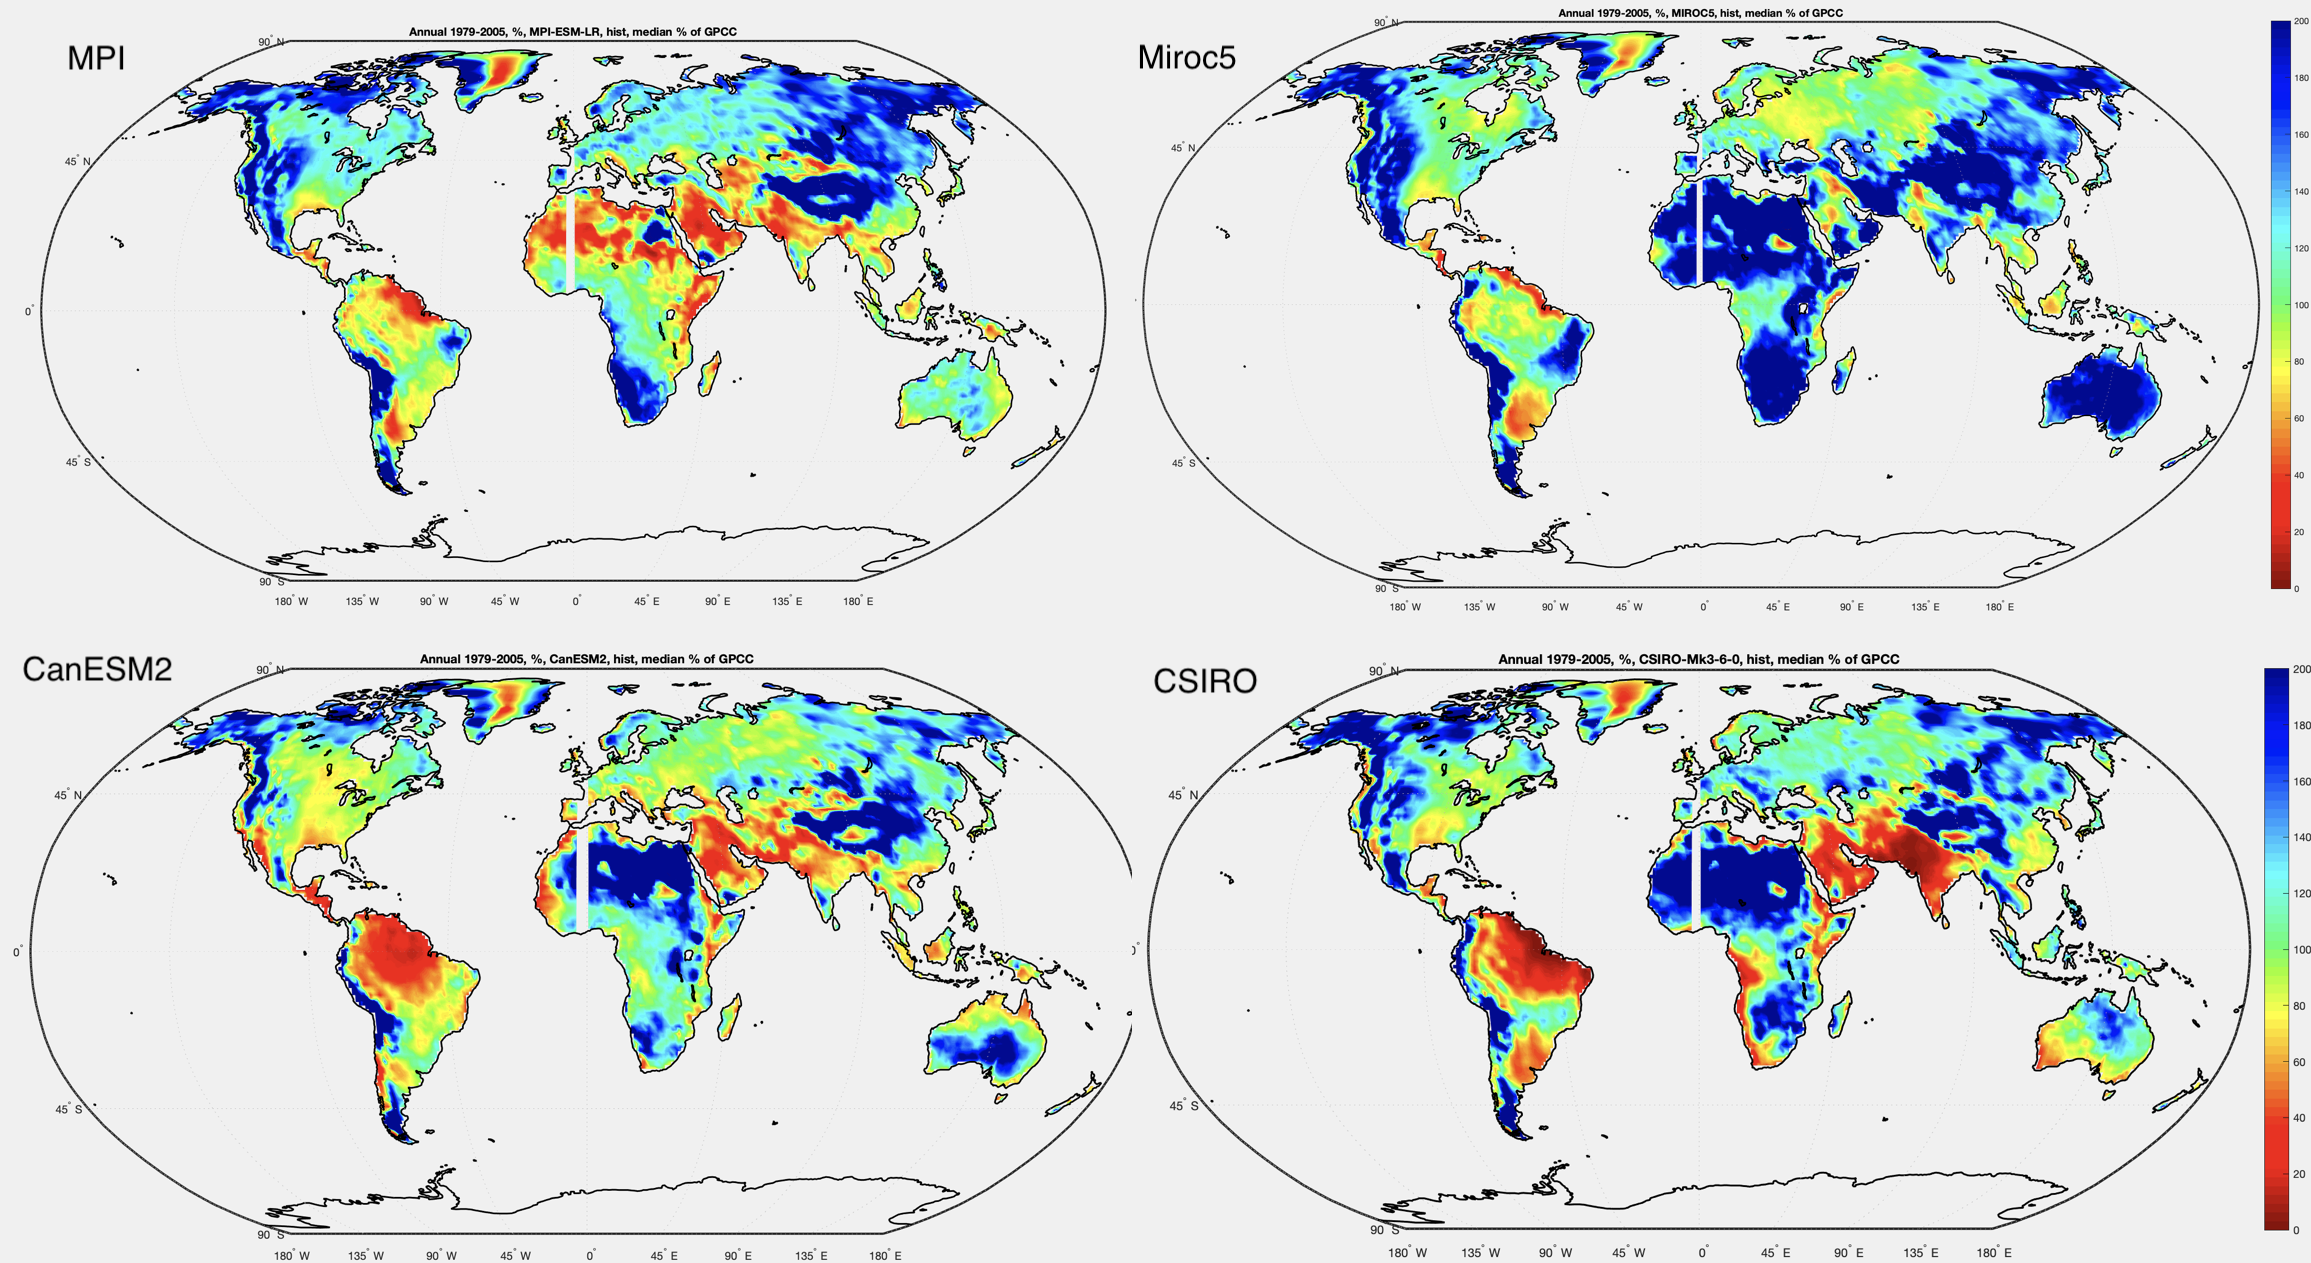
Figure 3 – MPI, Miroc, CAN & CSIRO historical runs compared with GPCC over the same 1979-2005 period – Click to expand
Clearly a strong consensus.


The blue and red colours in Figure 3 give an impression that climate models have too much intensification of dry and wet conditions over different areas. And it applies to the whole 20th century. This point to some model biases.
“However, the intensification of the twentieth-century-mean hydroclimate anomalies in the simulations, as compared to previous centuries, is not supported by our new multi-proxy reconstruction.” From: Northern Hemisphere hydroclimate variability over the past twelve centuries. Fredrik Charpentier Ljungqvist, et al 2016.
https://www.nature.com/articles/nature17418
From a presentation Climate Home News by Alex Kirby:
“The lead author, Fredrik Charpentier Ljungqvist, a historian and climate researcher at Stockholm University, says: “Despite strong 20th-century warming, we find that rainfall and drought extremes in the 20th century have varied within the natural variability we can now see in earlier centuries.
“Several other centuries in the past 1,200 years show stronger and more widespread extremes and deviations from the average. Climate models strongly overestimate the intensification of wet and dry extremes in the 20th century.”
The team used tree-rings, lake sediment, historical data and other types of archive material to produce their new picture of past climate. They found larger land areas with relatively wetter conditions in the 9th to 11th centuries and the 20th century. But drier conditions than during the 20th century were more widespread between the 12th and 19th centuries.
“The lack of agreement between the reconstruction and the climate models in the 20th century indicates that the models can have limitations in realistically predicting which regions may get wetter and which may get drier in a warmer world,” Dr Ljungqvist says.
Some model biases was pointed out already in 2005 by A Dai: Precipitation Characteristics in Eighteen Coupled Climate Models.
With the conclusion: ” Most models produce too much convective (over 95% of total precipitation) and too little stratiform precipitation over most of the low latitudes, in contrast to 45%–65% in convective form in the Tropical Rainfall Measuring Mission (TRMM) satellite observations. The biases in the convective versus stratiform precipitation ratio are linked to the unrealistically strong coupling of tropical convection to local SST, which results in a positive correlation between the standard deviation of Niño-3.4 SST and the local convective-to-total precipitation ratio among the models.” Such biases in models tend to be longlived.
nobodysknowledge,
Interesting paper, thanks.
NK: I’m not particularly excited about using precipitation proxies to determine whether forecast changes in precipitation are bigger or smaller than natural variability in precipitation. This approach didn’t work well in the case of temperature proxies.
However, I looked up Dai (2005) and found that paper extremely interesting. Unfortunately, the paper is a bit dated (CMIP3) and models with flux adjustments did some things better than the models we use today. However, papers I have read (particularly on much higher resolution models) discuss many of these same weaknesses discussed by Dai.
https://journals.ametsoc.org/doi/full/10.1175/JCLI3884.1
Monthly and 3-hourly precipitation data from twentieth-century climate simulations by the newest generation of 18 coupled climate system models are analyzed and compared with available observations. The characteristics examined include the mean spatial patterns, intraseasonal-to-interannual and ENSO-related variability, convective versus stratiform precipitation ratio, precipitation frequency and intensity for different precipitation categories, and diurnal cycle. Although most models reproduce the observed broad patterns of precipitation amount and year-to-year variability, models without flux corrections still show an unrealistic double-ITCZ pattern over the tropical Pacific, whereas the flux-corrected models, especially the Meteorological Research Institute (MRI) Coupled Global Climate Model (CGCM; version 2.3.2a), produce realistic rainfall patterns at low latitudes. As in previous generations of coupled models, the rainfall double ITCZs are related to westward expansion of the cold tongue of sea surface temperature (SST) that is observed only over the equatorial eastern Pacific but extends to the central Pacific in the models. The partitioning of the total variance of precipitation among intraseasonal, seasonal, and longer time scales is generally reproduced by the models, except over the western Pacific where the models fail to capture the large intraseasonal variations. MOST MODELS PRODUCE TOO MUCH CONVECTIVE PRECIPITATION (over 95% of total precipitation) AND TOO LITTLE STRATIFORM PRECIPITATION OVER MOST OF THE LOW LATITUDES, in contrast to 45%–65% in convective form in the Tropical Rainfall Measuring Mission (TRMM) satellite observations. The biases in the convective versus stratiform precipitation ratio are linked to the unrealistically strong coupling of tropical convection to local SST, which results in a positive correlation between the standard deviation of Niño-3.4 SST and the local convective-to-total precipitation ratio among the models. The models reproduce the percentage of the contribution (to total precipitation) and frequency for moderate precipitation (10–20 mm day−1), BUT UNDERESTIMATE THE CONTRIBUTION AND FREQUENCY FOR HEAVY PRECIPITATION (>20 mm/day) AND OVERESTIMATE THEM FOR LIGHT PRECIPITATION (<10 mm day−1). The newest generation of coupled models still rains too frequently, mostly within the 1–10 mm day−1 category. Precipitation intensity over the storm tracks around the eastern coasts of Asia and North America is comparable to that in the ITCZ (10–12 mm day−1) in the TRMM data, but it is much weaker in the models. THE DIURNAL ANALYSIS SUGGESTS THAT WARM SEASON CONVECTION STARTS TOO EARLY AND OCCURS TOO FREQUENTLY AT REDUCED INTENSITY in some of the models. The results show that considerable improvements in precipitation simulations are still desirable for the latest generation of the world’s coupled climate models.
Ultra-high resolution models accurately models convective plumes and produce a correct distribution of heavy, medium and light precipitation. However high-resolution models with conventional parameterization of the boundary layer still produce convective precipitation over land too early in the afternoon.
Anone enamored by Willis's "thermostat hypothesis" should be aware that it might applies to tropical land, but not tropical ocean. Tropical SSTs warm less than 1 degC during daytime. More rain falls at night than day over tropical oceans. Nocturnal rain is initiated by radiative cooling of cloud tops.
[…] « Models and Rainfall – V – CanESM2, CSIRO, Miroc and MRI compared […]