I probably should have started a separate series on rainfall and then woven the results back into the Impacts series. It might take a few articles working through the underlying physics and how models and observations of current and past climate compare before being able to consider impacts.
There are a number of different ways to look at rainfall models and reality:
- What underlying physics provides definite constraints regardless of individual models, groups of models or parameterizations?
- How well do models represent the geographical distribution of rain over a climatological period like 30 years? (e.g. figure 8 in Impacts XI – Rainfall 1)
- How well do models represent the time series changes of rainfall?
- How well do models represent the land vs ocean? (when we think about impacts, rainfall over land is what we care about)
- How well do models represent the distribution of rainfall and the changing distribution of rainfall, from lightest to heaviest?
In this article I thought I would highlight a set of conclusions from one paper among many. It’s a good starting point. The paper is A canonical response of precipitation characteristics to global warming from CMIP5 models by Lau and his colleagues, and is freely available, and as always I recommend people read the whole paper, along with the supporting information that is also available via the link.
As an introduction, the underlying physics perhaps provides some constraints. This is strongly believed in the modeling community. The constraint is a simple one – if we warm the ocean by 1K (= 1ºC) then the amount of water vapor above the ocean surface increases by about 7%. So we expect a warmer world to have more water vapor – at least in the boundary layer (typically 1km) and over the ocean. If we have more water vapor then we expect more rainfall. But GCMs and also simple models suggest a lower value, like 2-3% per K, not 7%/K. We will come back to why in another article.
It also seems from models that with global warming, rainfall increases more in regions and times of already high rainfall and reduces in regions and times of low rainfall – the “wet get wetter and the dry get drier”. (Also a marketing mantra that introducing a catchy slogan ensures better progress of an idea). So we also expect changes in the distribution of rainfall. One reason for this is a change in the tropical circulation. All to be covered later, so onto the paper..
We analyze the outputs of 14 CMIP5 models based on a 140 year experiment with a prescribed 1% per year increase in CO2 emission. This rate of CO2 increase is comparable to that prescribed for the RCP8.5, a relatively conservative business-as-usual scenario, except the latter includes also changes in other GHG and aerosols, besides CO2.
A 27-year period at the beginning of the integration is used as the control to compute rainfall and temperature statistics, and to compare with climatology (1979–2005) of rainfall data from the Global Precipitation Climatology Project (GPCP). Two similar 27-year periods in the experiment that correspond approximately to a doubling of CO2 emissions (DCO2) and a tripling of CO2 emissions (TCO2) compared to the control are chosen respectively to compute the same statistics..
Just a note that I disagree with the claim that RCP8.5 is a “relatively conservative business as usual scenario” (see Impacts – II – GHG Emissions Projections: SRES and RCP), but that’s just an opinion, as are all views about where the world will be in population, GDP and cumulative emissions 100-150 years from now. It doesn’t detract from the rainfall analysis in the paper.
For people wondering “what is CMIP5?” – this is the model inter-comparison project for the most recent IPCC report (AR5) where many models have to address the same questions so they can be compared.
Here we see (and along with other graphs you can click to enlarge) what the models show in temperature (top left), mean global rainfall (top right), zonal rainfall anomaly by latitude (bottom left) and the control vs the tripled CO2 comparison (bottom right). The many different colors in the first three graphs are each model, while the black line is the mean of the models (“ensemble mean”). The bottom right graph helps put the changes shown in the bottom left into a perspective – with the different between the red and the blue being the difference between tripling CO2 and today:
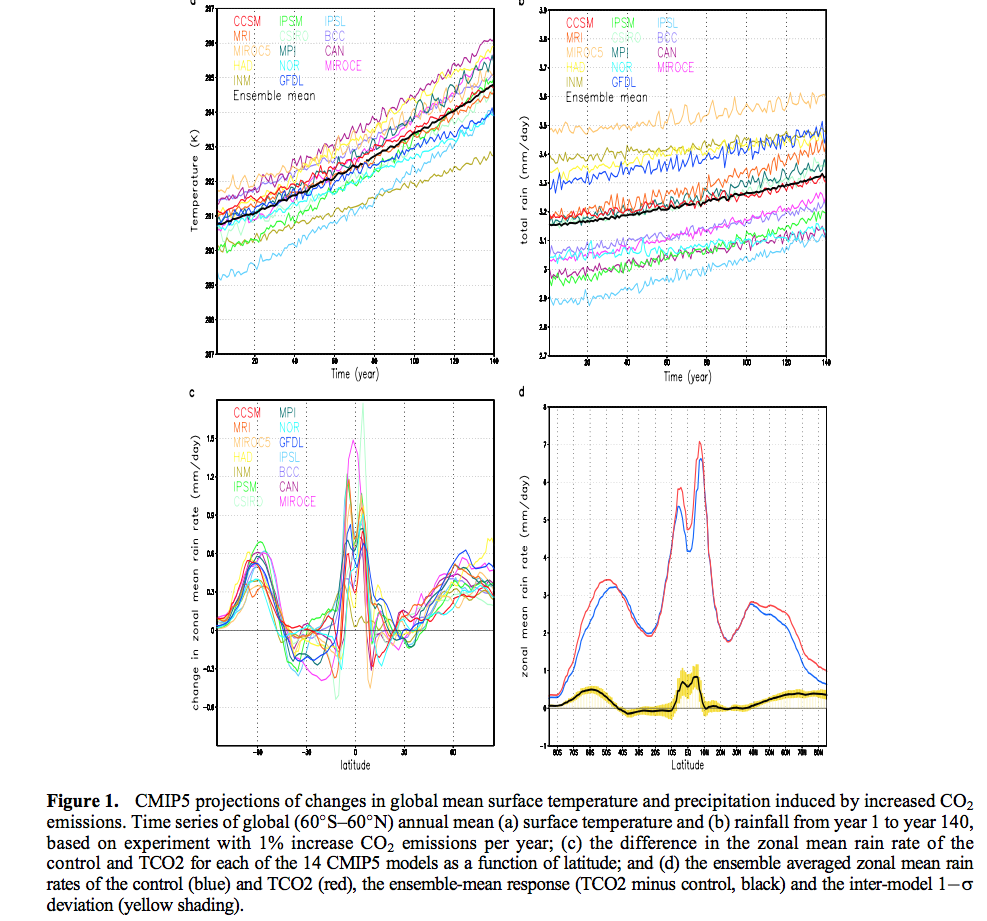
From Lau et al 2013
Figure 1 – Click to enlarge
In the figure above, the bottom left graph shows anomalies. We see one of the characteristics of models as a result of more GHGs – wetter tropics and drier sub-tropics, along with wetter conditions at higher latitudes.
From the supplementary material, below we see a better regional breakdown of fig 1d (bottom right in the figure above). I’ll highlight the bottom left graph (c) for the African region. Over the continent, the differences between present day and tripling CO2 seem minor as far as model predictions go for mean rainfall:
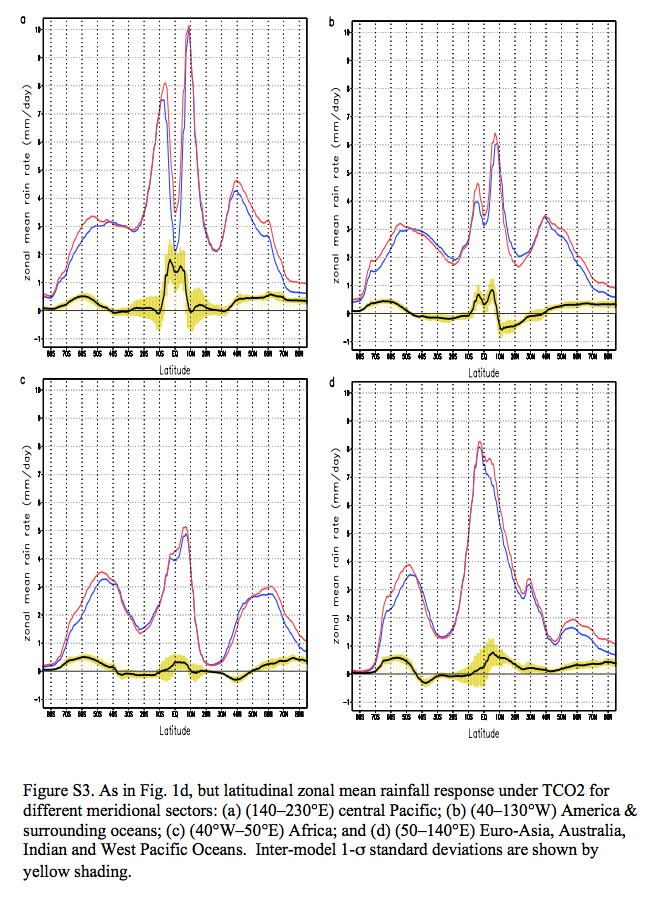
From Lau et al 2013
Figure 2 – Click to enlarge
The supplementary material also has a comparison between models and observations. The first graph below is what we are looking at (the second graph we will consider afterwards). TRMM (Tropical Rainfall Measuring Mission) is satellite data and GPCP one rainfall climatology that we met in the last article – so they are both observational datasets. We see that the models over-estimate tropic rainfall, especially south of the equator:
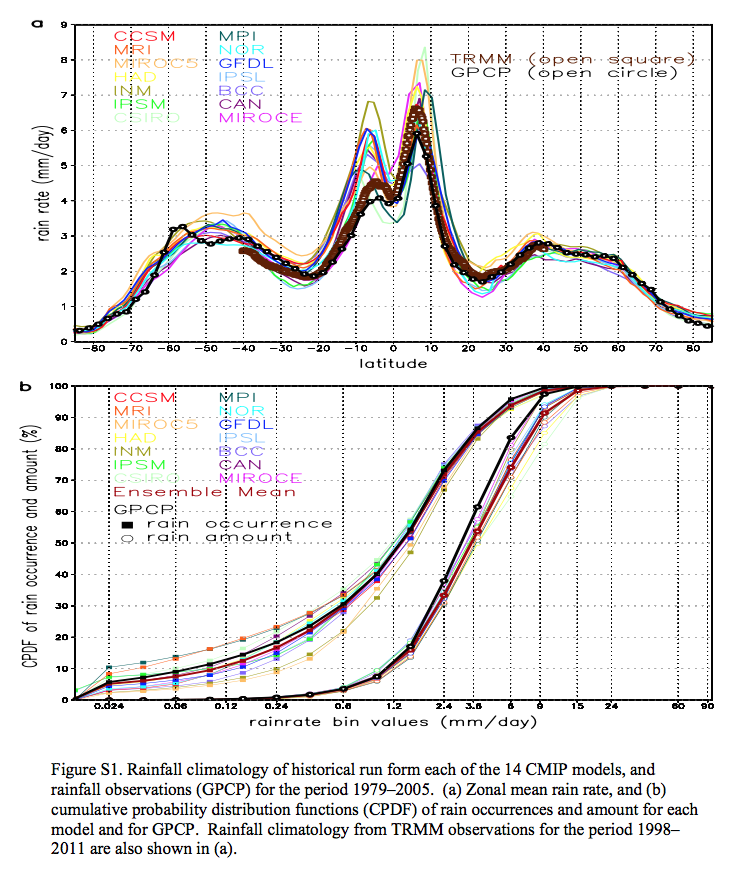
From Lau et al 2013
Figure 3 – Click to enlarge
Rainfall Distribution from Light through to Heavy Rain
Lau and his colleagues then look at rainfall distribution in terms of light rainfall through to heavier rainfall. So, take global rainfall and divide it into frequency of occurrence, with light rainfall to the left and heavy rainfall to the right. Take a look back at the bottom graph in the figure above (figure 3, their figure S1). Note that the horizontal axis is logarithmic, with a ratio of over 1000 from left to right.
It isn’t an immediately intuitive graph. Basically there are two sets of graphs. The left “cluster” is how often that rainfall amount occurred, and the black line is GPCP observations. The “right cluster” is how much rainfall fell (as a percentage of total rainfall) for that rainfall amount and again black is observations.
So lighter rainfall, like 1mm/day and below accounts for 50% of time, but being light rainfall accounts for less than 10% of total rainfall.
To facilitate discussion regarding rainfall characteristics in this work, we define, based on the ensemble model PDF, three major rain types: light rain (LR), moderate rain (MR), and heavy rain (HR) respectively as those with monthly mean rain rate below the 20th percentile (<0.3 mm/day), between response (TCO2 minus control, black) and the inter-model 1s the 40th–70th percentile (0.9–2.4mm/day), and above the 98.5% percentile (>9mm/day). An extremely heavy rain (EHR) type defined at the 99.9th percentile (>24 mm day1) will also be referred to, as appropriate.
Here is a geographical breakdown of the total and then the rainfall in these three categories, model mean on the left and observations on the right:
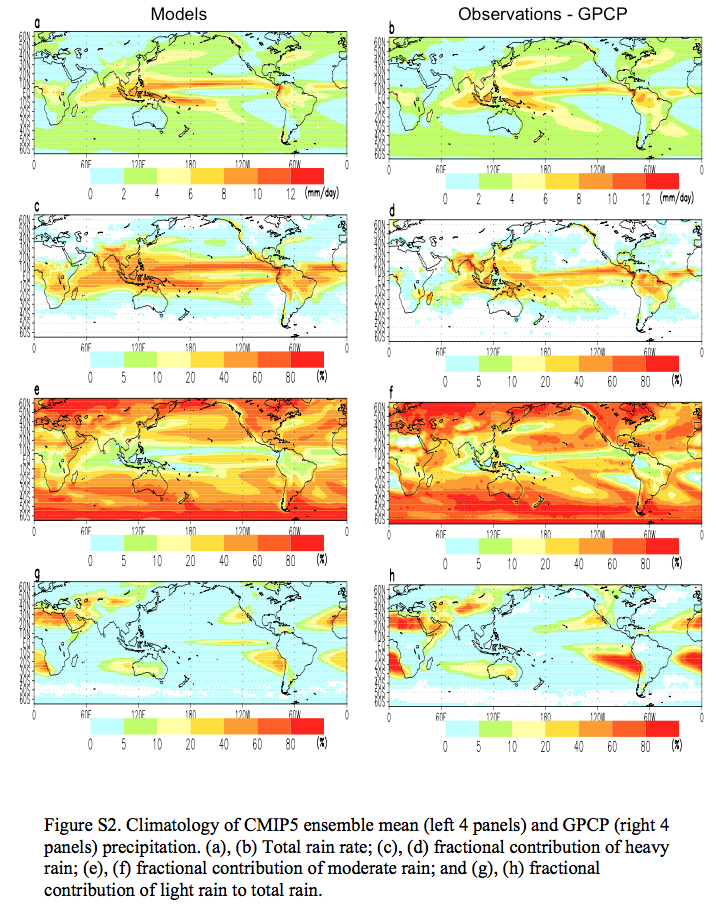
From Lau et al 2013
Figure 4 – Click to enlarge
We can see that the models tend to overestimate the heavy rain and underestimate the light rain. These graphics are excellent because they help us to see the geographical distribution.
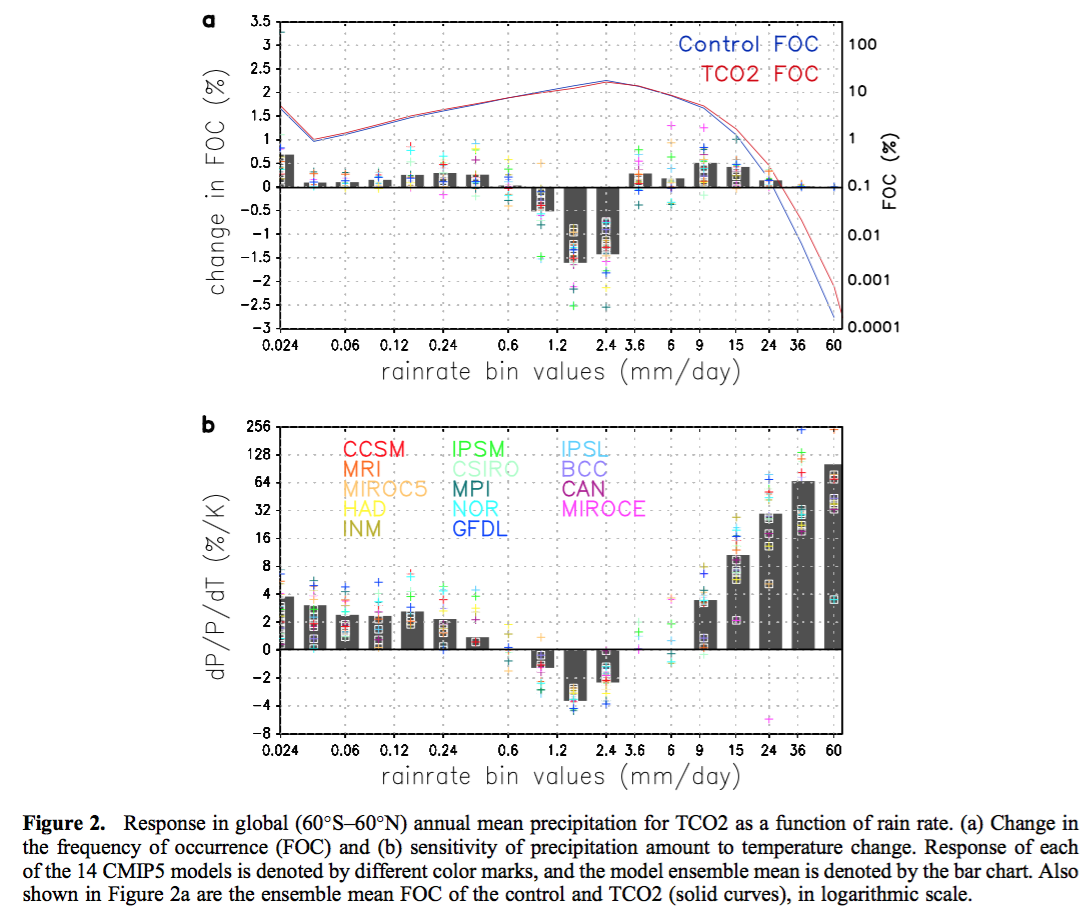
Now in the graphs below we see at the top the changes in frequency of mean precipitation (60S-60N) as a function of rain rate; and at the bottom we see the % change in rainfall per K of temperature change, again as a function of rain rate. Note that the bottom graph also has a logarithmic scale for the % change, so as you move up each grid square the value is doubled.
The different models are also helpfully indicated so the spread can be seen:
From Lau et al 2013
Figure 5 – Click to enlarge
Notice that the models are all predicting quite a high % change in rainfall per K for the heaviest rain – something around 50%. In contrast the light rainfall is expected to be up a few % per K and the medium rainfall is expected to be down a few % per K.
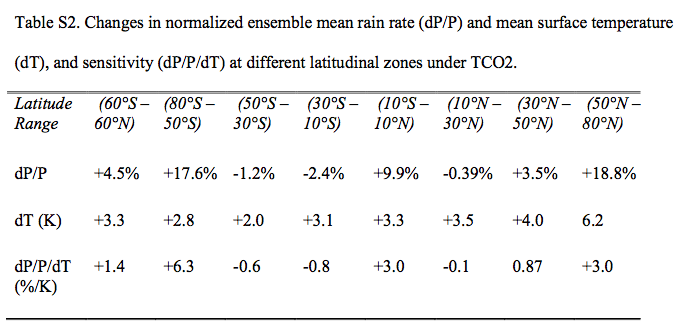
Globally, rainfall increases by 4.5%, with a sensitivity (dP/P/dT) of 1.4% per K
Here is a table from their supplementary material with a zonal breakdown of changes in mean rainfall (so not divided into heavy, light etc). For the non-maths people the first row, dP/P is just the % change in precipitation (“d” in front of a variable means “change in that variable”), the second row is change in temperature and the third row is the % change in rainfall per K (or ºC) of warming from GHGs:
From Lau et al 2013
Figure 6 – Click to enlarge
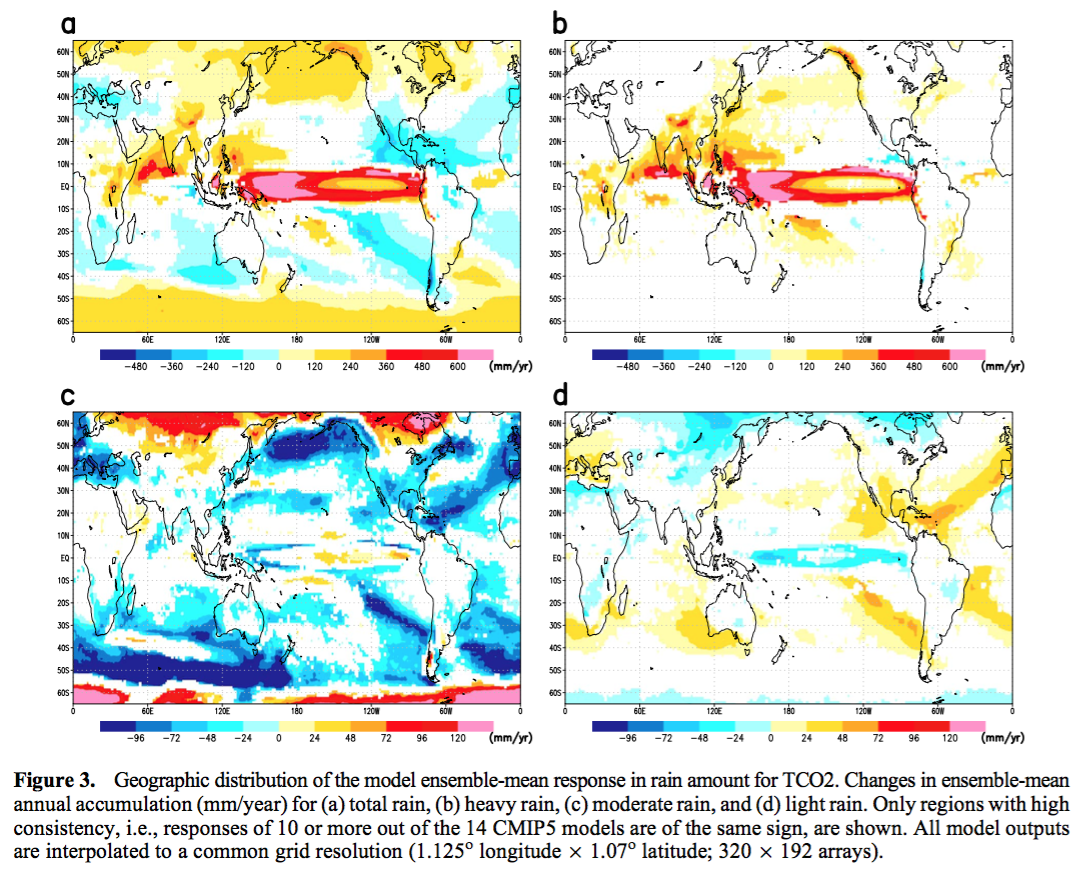
Here are the projected geographical distributions of the changes in mean (top left), heavy (top right), medium (bottom left) and light rain (bottom right) – using their earlier definitions – under tripling CO2:
From Lau et al 2013
Figure 7 – Click to enlarge
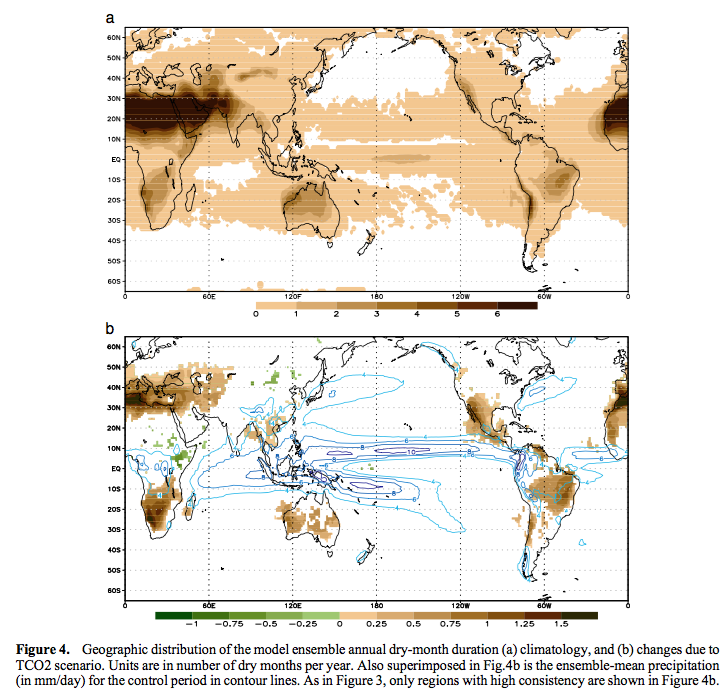
And as a result of these projections, the authors also show the number of dry months and the projected changes in number of dry months:
From Lau et al 2013
Figure 8 – Click to enlarge
The authors conclude:
The IPCC CMIP5 models project a robust, canonical global response of rainfall characteristics to CO2 warming, featuring an increase in heavy rain, a reduction in moderate rain, and an increase in light rain occurrence and amount globally.
For a scenario of 1% CO2 increase per year, the model ensemble mean projects at the time of approximately tripling of the CO2 emissions, the probability of occurring of extremely heavy rain (monthly mean >24mm/day) will increase globally by 100%–250%, moderate rain will decrease by 5%–10% and light rain will increase by 10%–15%.
The increase in heavy rain is most pronounced in the equatorial central Pacific and the Asian monsoon regions. Moderate rain is reduced over extensive oceanic regions in the subtropics and extratropics, but increased over the extratropical land regions of North America, and Eurasia, and extratropical Southern Oceans. Light rain is mostly found to be inversely related to moderate rain locally, and with heavy rain in the central Pacific.
The model ensemble also projects a significant global increase up to 16% more frequent in the occurrences of dry months (drought conditions), mostly over the subtropics as well as marginal convective zone in equatorial land regions, reflecting an expansion of the desert and arid zones..
..Hence, the canonical global rainfall response to CO2 warming captured in the CMIP5 model projection suggests a global scale readjustment involving changes in circulation and rainfall characteristics, including possible teleconnection of extremely heavy rain and droughts separated by far distances. This adjustment is strongly constrained geographically by climatological rainfall pattern, and most likely by the GHG warming induced sea surface temperature anomalies with unstable moister and warmer regions in the deep tropics getting more heavy rain, at the expense of nearby marginal convective zones in the tropics and stable dry zones in the subtropics.
Our results are generally consistent with so-called “the rich-getting-richer, poor-getting-poorer” paradigm for precipitation response under global warming..
Conclusion
This article has basically presented the results of one paper, which demonstrates consistency in model response of rainfall to doubling and tripling of CO2 in the atmosphere. In subsequent articles we will look at the underlying physics constraints, at time-series over recent decades and try to make some kind of assessment.
Articles in this Series
Impacts – II – GHG Emissions Projections: SRES and RCP
Impacts – III – Population in 2100
Impacts – IV – Temperature Projections and Probabilities
Impacts – V – Climate change is already causing worsening storms, floods and droughts
Impacts – VI – Sea Level Rise 1
Impacts – VII – Sea Level 2 – Uncertainty
Impacts – VIII – Sea level 3 – USA
Impacts – IX – Sea Level 4 – Sinking Megacities
Impacts – X – Sea Level Rise 5 – Bangladesh
References
A canonical response of precipitation characteristics to global warming from CMIP5 models, William K.-M. Lau, H.-T. Wu, & K.-M. Kim, GRL (2013) – free paper
Further Reading
Here are a bunch of papers that I found useful for readers who want to dig into the subject. Most of them are available for free via Google Scholar, but one of the most helpful to me (first in the list) was Allen & Ingram 2002 and the only way I could access it was to pay $4 to rent it for a couple of days.
Allen MR, Ingram WJ (2002) Constraints on future changes in climate and the hydrologic cycle. Nature 419:224–232
Allan RP (2006) Variability in clear-sky longwave radiative cooling of the atmosphere. J Geophys Res 111:D22, 105
Allan, R. P., B. J. Soden, V. O. John, W. Ingram, and P. Good (2010), Current changes in tropical precipitation, Environ. Res. Lett., doi:10.1088/ 1748-9326/5/52/025205
Physically Consistent Responses of the Global Atmospheric Hydrological Cycle in Models and Observations, Richard P. Allan et al, Surv Geophys (2014)
Held IM, Soden BJ (2006) Robust responses of the hydrological cycle to global warming. J Clim 19:5686–5699
Changes in temperature and precipitation extremes in the CMIP5 ensemble, VV Kharin et al, Climatic Change (2013)
Energetic Constraints on Precipitation Under Climate Change, Paul A. O’Gorman et al, Surv Geophys (2012) 33:585–608
Trenberth, K. E. (2011), Changes in precipitation with climate change, Clim. Res., 47, 123–138, doi:10.3354/cr00953
Zahn M, Allan RP (2011) Changes in water vapor transports of the ascending branch of the tropical circulation. J Geophys Res 116:D18111


Thanx SOD – keep up the good work!
As you indicate, you intend to delve further into the physics and physical constraints of precipitation. I think it’s valuable to also consider a distinction between the predictability of temperature versus precipitation.
Radiative forcing from increased CO2 in the global mean is quite similar whether the atmosphere is at rest or in motion. Because of this, global mean temperature change, implied by the radiatively forced global energy budget, may well be predictable.
In contrast, precipitation is critically dependent on atmospheric motion. An atmosphere at rest has zero precipitation, and so, the effect of increased CO2 on precipitation for an atmosphere at rest is also zero. For atmospheric motions, we know that the specific motions that cause precipitation events are not predictable beyond a week or so. I think we should keep in mind that the predictability of regional precipitation changes may be zero for annual/decadal/centennial time scales.
Such forecasts are not validatable for another century.
And as indicated by figure S2, some egregious errors exist in hindcasts. That is also the finding of Zhang,Liu, and Zhang who unfortunately found worse results for CMIP5 compared to CMIP3.
Precipitation represents energy transfers, and these transfers alter the very atmospheric motions which cause precipitation. A partially self dependent variable would seem to be fertile ground for unpredictability beyond the infinite array of wave patterns that occur.
TE,
You can’t have an atmosphere at rest in the real world. The pure radiative lapse rate is way too high. You can’t predict individual precipitation events more than ~10 days in advance. That doesn’t necessarily mean you can’t predict global average precipitation. IMO, the current crop of AOGCM’s predict too small an increase of global precipitation with temperature and that’s one of the reasons their predicted climate sensitivity is too high.
Right. An atmosphere at rest acted on by the various forces would very soon begin to move. The point I was after is that predicting global mean temperature change does not depend so much on the motions of the atmosphere being correctly predicted. Precipitation changes, especially regional differences by contrast, critically depend on atmospheric motions being correctly predicted. Figure 1 d,h,l of ZLZ depicts how the V Component near the equator of the SH is too erroneously strong. The CMIP5 erroneously creates too much precipitation because it erroneously creates too much convergence toward the ITCZ:
SOD wrote: “As an introduction, the underlying physics perhaps provides some constraints. This is strongly believed in the modeling community. The constraint is a simple one – if we warm the ocean by 1K (= 1ºC) then the amount of water vapor above the ocean surface increases by about 7%. So we expect a warmer world to have more water vapor – at least in the boundary layer (typically 1km) and over the ocean.”
Although your conclusion may still be correct, I believe your reasoning is flawed. The C-C equation (+7%/K) technically only applies only to water vapor in equilibrium: 100% relative humidity. That is found only within the layer of air adhering to the surface of the ocean, perhaps 1 mm thick. The boundary layer is only about 80% relative humidity, and is less that 100% relative humidity even far from land because drier air from the free atmosphere is being turbulently mixed into the boundary layer. IF this mixing process remains unchanged with warming, then the relative humidity of the boundary layer may rise at 7%/K.
In fact, climate models predict that the mixing process will change – that the rate of “overturning” of the atmosphere (or average time between evaporation and precipitation) will slow down. And this may cause a rise in the relative humidity of the boundary layer.
https://www.gfdl.noaa.gov/blog_held/47-relative-humidity-over-the-oceans/
I suspect you are headed towards discussing some of this material. However, it makes sense to get things correct from the start: 7%/K only applies to saturation vapor pressure. Constant relative humidity needs to be demonstrated, not postulated.
Frank wrote: “Although your conclusion may still be correct, I believe your reasoning is flawed.”
SoD did go on to say “But GCMs and also simple models suggest a lower value, like 2-3% per K, not 7%/K. We will come back to why in another article.” I look forward to that article.
Frank wrote: “The boundary layer is only about 80% relative humidity, and is less that 100% relative humidity even far from land because drier air from the free atmosphere is being turbulently mixed into the boundary layer.”
I only comment on this since I think Frank likes to get things right and I think there is a mistake here. The reason the RH is less than 100% near the ocean surface is that there must be a net upward flux of water vapor at the surface. That flux provides the water vapor to precipitating clouds over both land and sea. If RH were 100% at the surface, there would be no driving force for evaporation and therefore no net evaporation. Also, the RH must increase with elevation, so there would be a permanent fog. Liquid water would then be falling back toward the surface; the resulting removal of water vapor would lower the RH until net evaporation balances the return of liquid water.
If you only consider mass transfer, then at constant RH a 7% increase in saturation vapor pressure would produce a 7% increase in water vapor partial pressure, a 7% increase in the evaporative driving force and a 7% increase in net evaporation. But you also have to consider heat transfer. That constrains the increase in evaporation to less than the increase in vapor pressure and causes the RH to decrease.
Mike: I like your explanation. IMO, the expectation that relative humidity will remain constant (+7%/K) is the second biggest over-simplification in climate science (after GHG’s “trapping” heat in the atmosphere). The heat transfer constraint that force precipitation to rise at a lower rate (+2%/K) appears to be essential to the expectation that climate sensitivity is around 3 K or higher – enough though precipitation is not clearly linked to the feedbacks normally associated with high climate sensitivity.
“Also, the RH must increase with elevation, so there would be a permanent fog”
This isn’t quite true — air can be oversaturated with water, as without sufficient nuclei or time to condense out, a rising parcel of air at 100% RH can go over 100% (and will, as at 100% humidity there’s no driving force for condensation).
So, if the air was 100% RH at the ocean surface, it doesn’t imply that there would be a fog directly above it. That’s dependent upon the rates of nucleation and condensation and their function of oversaturation, plus the rate of convection.
windchasers wrote: “This isn’t quite true — air can be oversaturated with water, as without sufficient nuclei or time to condense out, a rising parcel of air at 100% RH can go over 100% (and will, as at 100% humidity there’s no driving force for condensation).”
True. But it hardly matters. With 100% RH at the surface, there would be 101% RH at about 15 m. That is more than enough for rapid cloud condensation.
This is an interesting graphic that reminds us of the dynamics. Relative humidity is lower in the winter hemisphere and higher in the summer hemisphere (I’m assuming these are surface). This is because of the much greater generation of cold, dry air masses during winter. These masses spread equatorward, taking up humidity as they traverse the oceans ( though at a rate that leaves them still relatively more arid than during summer ). Peixoto and Oort indicate that evaporation is actually greater in the winter hemisphere and lower in the summer hemisphere ( drier air, windier conditions ). At the same time, precipitation is greater for the summer hemisphere than the winter hemisphere, though dominated by the tropics. This implies cross equator transport of water vapor.
There seems to be some systematic bias on rainfall in models.
“In fact, at a global scale, all models overestimate the total precipitation
amount as well as its higher quantiles (e.g. 75th and 90th percentiles).”
From: Seasonal and regional biases in CMIP5 precipitation simulations
Zhu Liu1 Ali Mehran1 Thomas J. Phillips2 Amir AghaKouchak1,* 2014
Does it mean that they assume that it is more water vapor pr degree increase than it actually is? And how does such systematic bias get feedbacks and sensitivity wrong?
I am very suspicious of the “wet get wetter and the dry get drier” mantra. During the Holocene climate optimum, when things were warmer than now, most areas that are now deserts were savanna. And during the ice ages, when temperatures were lower, deserts were much more extensive than now.
I have seen the claim that both the mantra and the claim of greater extremes are artifacts of something unphysical in the models. The idea behind those things seems to be that if you have an area where water vapor is condensing and more water vapor is flowing into that area, then you get more condensation in those areas. What is left out is that the extra latent heat release results in an increased flow divergence that, in turn, leads to distributing the precipitation over a wider area.
Mike: I asked earlier whether our host intended to discuss the “mantra” that the “wet get wetter and the dry get drier”.
SOD replied: “I do plan to. One of the commonly cited papers for this is Robust Responses of the Hydrological Cycle to Global Warming, Held and Soden, Journal of Climate (2006).
http://journals.ametsoc.org/doi/full/10.1175/JCLI3990.1
Unfortunately (for skeptics), the arguments are mathematical and appear to rise above “mantra”. I’ve been waiting to see if a post from SOD and comments can shorten my learning curve on this subject.
Unfortunately (for skeptics), the arguments are mathematical and appear to rise above “mantra”.
Hmmm….
The authors take it even further. Not only do “wet get wetter and the dry get drier”, but also “the-middle-class-also-getting-poorer”. As SoD alluded to, this is spread as a marketing tool which makes me suspicious.
And at least in one way, the mantra is incorrect as modeled: The Arctic is quite dry in absolute terms, but a large increase of precipitation is modeled there. So, there’s at least one big caveat: “the dry will get drier, except for the Arctic, which is supposed to get wetter.”
But, these are not validated models, after all. As I alluded to above, radiative models alone indicate varying levels of temperature increase for nearly all areas of earth. Precipitation, particularly regional variation of precipitation, in great contrast, requires accurate prediction of atmospheric motion from the general circulation models. Such models are chaotic and this periodicities of this chaos include centennial scales.
That doesn’t mean nothing is predictable. Many forcing agents of climate and even the general circulation remain relatively constant ( and so, predictable ). That includes the rotation of earth, earth’s orbit around the energetic sun, the presence of oceans and mountains, and of course, gravity. Earth’s orbit will continue to create pole-to-equator thermal gradients, which means we’re confident that a jet stream will exist similar to today’s. The polar thermal deficit and equatorial thermal surplus implies an exchange of mass between the poles and tropics, which coupled with a warming driven increase in humidity, also implies an increase in polar precipitation, as the GCMs seem to indicate.
The problem short of some of these logical assumptions, however, is that even were warming to slightly alter the intensity of the thermal gradient, there are still an infinite array of wave patterns that are all mathematically equally valid ( and provide us with the variations of weather and climate we observe ). Each of these wave patterns, for whatever duration they endure, implies a precipitation surplus or deficit compared with some baseline average ( which itself may represent a fluctuation from some other baseline ). And example of this is the so called 5 wave pattern versus the 3 wave pattern of global circulation. And even within a given 5 or 3 wave, there are constantly changing differing sizes, shapes, frequencies, speeds of the smaller wave distributions which imply different precipitation:

Turbulent Eddie wrote: “The authors take it even further. Not only do “wet get wetter and the dry get drier”, but also “the-middle-class-also-getting-poorer”.”
If you are referring to Soden and Held, as cited by Frank, you just made that up.
Turbulent Eddie wrote: “And at least in one way, the mantra is incorrect as modeled: The Arctic is quite dry in absolute terms, but a large increase of precipitation is modeled there.”
I think that is meant in general, not in all cases. And “dry regions get drier” refers to the difference between precipitation and evaporation, not the change in precipitation alone.
“the-middle-class-also-getting-poorer” is a direct quote from the Lau et. al. paper under discussion.
“wet get wetter and the dry get drier” in Lau et. al. is demonstrated in terms of CMIP5 modeled precipitation. The Arctic should be noted as an exception. While these are the model outputs, I’m not sure what physical principal there would be for increased precipitation where precipitation falls more frequently and decreased precipitation where precipitation falls less frequently. If there were such a principal, it would probably be invoked:
“the wet get wetter and the dry get drier because…”
Turbulent Eddie: My statement that mathematical arguments support the conclusion that he “the wet get wetter and the dry get drier” is based in part on equation 6 from Held and Soden (2006) linked above. This equation – whose derivation and limitations I would like to understand better – is based on physical principles. It also agrees with the results of GCM’s. Like you, I wonder how much faith should be placed in where AOGCMs predict increasing precipitation will and won’t fall.
d(P-E) = a*dT*(P-E)
P = precipitation, E = evaporation, a = 7%/K from the CC equation.
More importantly, changes in the hydrological cycle are as important to high climate sensitivity as are WV+LR and cloud feedbacks. However, these changes in the hydrological cycle are usually presented as an independent prediction of climate models rather than a mathematical consequence of high climate sensitivity.
Ahhh…
Lau et. al. indicate changes in precipitation, whilst Held and Soden’s eq. 6 is about the differential of precipitation and evaporation.
δ(P – E) = αδT(P – E)
Is this the original source of the mantra?
It seems to me that the relationship is being misapplied.
Held and Soden were considering hemispheric, meridional transport to explain high latitude precipitation changes. This relationship would not seem to apply on other scales.
The assumptions mentioned in deriving equation 6:
“If one can remove δT from the derivative, assuming that P ⫺ E has more meridional structure than δT, then P ⫺ E itself satisfies CC scaling”
Held and Soden also note:
The approximation in (5) can potentially predict the unphysical result that P ⫺ E ⬍ 0 over land; the modified version (6) has the accidental advantage in this regard that it predicts that P ⫺ E will simply remain small where it is already small.
The relationship can explain or at least describe an increase in high latitude precipitation with temperature, because, as they caveat, high latitude precipitation “has more meridional structure than δT”( Arctic and Antarctic precipitation/evaporation difference doesn’t vary much longitudinally):

This would not appear to apply to land ( where significant variations occur ) nor to some oceanic features, such as the eastern basin subsidence zones which also vary as much or more longitudinally as they do meridionally )
A further assumption in even the high latitude precipitation description is: “If one assumes that the eddy sensible heat transport does not change”
Frank wrote: “My statement that mathematical arguments support the conclusion that he “the wet get wetter and the dry get drier” is based in part on equation 6 from Held and Soden (2006) linked above. This equation – whose derivation and limitations I would like to understand better – is based on physical principles.”
I think the math mostly obscures the assumptions. Held & Soden write: “A seemingly simplistic but useful starting point for discussion is the assumption that the response of F is everywhere dominated by the change in lower- tropospheric mixing ratios rather than changes in the flow field”. Of course, changes in latent heat transfer must produce changes in flow field, so although it is clear the assumption is simplistic, it is far from clear that it is useful.
Then what they end up with is that evaporation, E, should be proportional to temperature change (for small changes) and, on average, precipitation, P, should be proportional to temperature change, so the difference, P-E, should be proportional to T change. But that refers to averages, so it really says nothing about specific areas. In particular, they later admit that the assumption is likely to fail for arid and semi-arid areas.
So “wet areas get wetter” is plausible. That seems likely since an increased hydrological cycle seems to be a result that really is pretty sound. So that almost surely means more rain, on average, in places that get a lot of rain. But with a lot of variation from one area to another. Also, more latent heat release implies more flow divergence and rainfall spread out over larger areas.
But “dry areas get drier” is the much bigger concern since that implies desertification and increased water stress in areas that are already stressed. There seems to be little basis for that part of the claim. First, the assumption used is likely to break down. Second, what I just said about flow divergence. Third, the important thing is not the difference, P-E, but the ratio, P/E (P/E < 0.5 is arid, 0.5 < P/E < 1.0 is semi-arid). If we assume the simplistic theory to be true, then P/E would not depend on temperature. Remember that the theory says that precipitation increases, even in dry areas. Finally, there is the established record of what has happened with past temperature change. Oh, and a bonus: increased CO2 lets plants reduce water loss due to evapo-transpiration, which can be a significant contribution to net evaporation over land.
That the mantra gets repeated so much, even by scientists, would seem to be evidence for people uncritically accepting that which they want to believe.
My claim was that it is a marketing mantra that catchy slogans spread easily.
I didn’t claim that “the wet get wetter and the dry get drier” is a climate science mantra. That could imply some devaluation of the physics reasoning that went into the idea.
We should be suspicious of mantras, even though this marketing one is definitely true.
We should question physics. The strength of the hypothesis is independent of the catchiness of the saying adopted.
SOD wrote: “We should question physics”, by which I assume he means question the assumptions that are used when physical laws are being applied. Soden and Held (2006) says:
“The observed trend over the past two decades in the tropical lapse rate remains a subject of controversy (see Santer et al. 2005). In the context of this paper, we provisionally assume that this controversy will be settled in favor of a tropical atmosphere that stays close to a moist adiabat. Otherwise the models are seriously deficient, and aspects of these arguments will need to be revisited.”
In the last decade, more evidence is accumulating that the observed trend has been deviating from a moist adiabat.
The Abstract of the Lau et al. (2013) concludes with:
“Our results suggest that increased CO2 emissions induce a global adjustment in circulation and moisture availability manifested in basic changes in global precipitation characteristics, including increasing risks of severe floods and droughts in preferred geographic locations worldwide.”
[Bold by edh]
I think the words in bold represent an extrapolation of the results. Especially, floods depend on important local/regional factors that cannot be determined from CMIP5 numbers.