In Atmospheric Circulation – Part One we saw the Hadley circulation: convection in the tropics and subsidence in the subtropics:

From Marshall & Plumb (2008)
Figure 1
The distribution of relative humidity in the atmosphere is a result of this circulation.
The sun heats the tropical ocean surface which both warms the air just above it and also evaporates water into this air. This hot moist air rises. As this air rises it cools, due to adiabatic expansion (see Potential Temperature), and water vapor condenses out, releasing the latent heat stored. The strongest examples are known as deep convection because the convected air rises all the way to the tropopause (the top of the troposphere).
Cold air can hold much less water vapor than hot air – for example, air at 30°C can hold seven times as much water vapor as air at 0°C. Air at the warmest ocean surface can hold about 1,000 times (in g/kg) more water vapor than the coldest point in the atmosphere (the tropical tropopause).
So by the time convected air reaches the very cold tropopause (top of the troposphere) it has become very dry.
Once at the tropopause it slowly subsides, and warms due to compression by the atmosphere [updated sentence Dec 27th]. During this subsidence, the absolute amount of water vapor doesn’t increase (no source of new water vapor), but the temperature does increase. Therefore, the relative humidity (RH) – the amount of water vapor present vs the maximum that could be held – keeps decreasing.
Here is the annual average of relative humidity (originally shown in Clouds and Water Vapor – Part Two):

From Soden (2006)
Figure 2
The tropical troposphere is moist, while the sub-tropics are much drier. Here is the frequency of very low humidity at 500hPa (about 5.8 km altitude) from Roca et al (2012):

From Roca et al 2012
Figure 3
And from the same paper, a longer term average of the free tropospheric humidity (FTH = humidity above the boundary layer) to the left and the frequency of occurrence of very low humidity (<10%) to the right:

From Roca et al 2012
Figure 4
Why are we interested in very low humidity?
Pierrehumbert 1995
There are a number of climate scientists with a significant contribution to the study of water vapor in climate, and with apologies to people I have missed, my own informal list includes Richard S Lindzen, Kenneth Minschwaner, Kerry Emmanuel, Isaac M Held, Brian J Soden, Raymond T Pierrehumbert, Steven C Sherwood, Andrew E Dessler, Rémy Roca.
Pierrehumbert wrote a 1995 paper, Thermostats, radiator fins, and the local runaway greenhouse, which seems to be somewhat out of date now but a good starting point to illustrate some important concepts. (A more comprehensive paper on the background to this topic is Pierrehumbert’s 1999 paper, reference below).
The author comments:
Our version of the single-cell model is distinguished primarily by a choice of some radical simplifications that allow us to bring out the central behavior transparently. The chief utility of the model is didactic. We introduce it to bring out in concrete terms the repercussions of some of the phenomena discussed in section 3. It has too many adjustable parameters and too much missing physics to enable reliable quantitative projections of climate change to be made, but it will be nonetheless of interest to see whether such a model can be made to yield earthlike conditions..
[Emphasis added]. For those who are unfamiliar with climate models, this is much much much simpler than any real climate model. As an aside Isaac Held has a great article on the rationale for, and problem of, simplifying climate models in The ‘Fruit Fly’ of Climate Models. It’s an article more about making simpler GCM’s than about making 2-box models, but the points are still valid.
Below, the tropics represented in two parts – the convective region with high humidity, and the subsiding region with low humidity.

From Pierrehumbert 1995
Figure 5
The essence of the main part of his paper is that the tropical atmosphere, with high humidity, is not very efficient at radiating away the large amounts of solar heat absorbed, while the low humidity subsiding region is much more effective at this.
Here is a simplified example demonstrating the problem of radiating away high incident solar radiation as relative humidity (RH) increases (very simplified because this atmospheric profile has a constant RH above the boundary layer):

From Pierrehumbert 1995
Figure 6
Pierrehumbert comments:
From Fig. 2 [figure 6 in this article] we see that if the full annual-mean insolation of 420 W/m² were absorbed, T(0) would run away to temperatures in excess of 340K for any relative humidity greater than 25%. Even in Sc [solar radiation] is reduced to 370 W/m² to account for the mean clear sky albedo in the tropics, the temperature would run away for relative humidities as low as 50%.
Considered locally, the present-day tropics would thus be in a runaway state (or nearly so) so long as it is sufficiently close to saturation.
Clouds do not alter this conclusion because insofar as Cs + Cl = 0 in the tropics the reduction in solar absorption is compensated by an equal reduction in OLR. In order to stabilize the tropical runaway, one must appeal to the lateral heat transports out of the moist regions. Satellite observations show OLR of 300 W/m² or less over the warmest tropical oceans, confirming the inability of the warmest oceans to get rid of the absorbed solar radiation locally.
(See Note 1).
So, of course, one well known mechanism for tropical cooling is export of heat to higher latitudes. Basic climate texts demonstrate that this takes place as a matter of course by plotting the absorbed solar radiation vs OLR by latitude. The tropics absorb more energy than they radiate, while the poles radiate more than they absorb. The average poleward transport of energy by latitude can be calculated as a result.
The other mechanism of tropical cooling takes place in the subsiding regions of the tropics.
Pierrehumbert comments (on his simple model):
The warm pool atmosphere cannot get rid of its heat, because of the strong water vapor greenhouse effect; this heat must be exported via zonal and meridional heat fluxes, to drier regions where it can be radiated to space. These dry, non-convective regions act like “radiator fins” stuck into the side of the warm pool atmosphere. The “super greenhouse” shape of the clear-sky OLR curve in the analysis of Raval and Ramanathan (1989) and Ramanathan and Collins (1991) provides direct evidence for radiator fins, since it shows that OLR is generally higher in some cooler SST regions than it is over the warmest tropical waters.
How does Air at the Tropopause Subside?
The air at the tropopause is very cold. Why doesn’t it sink down below the warmer air underneath?
This question was answered in Potential Temperature. Air that rises cools even without any exchange of heat with the surroundings (due to losing internal energy while doing work expanding against the lower pressure).
Air that sinks warms without any exchange of heat with the surroundings (due to gaining internal energy from work done on it by the compression of the higher pressure atmosphere).
And the formulas for both of these processes are very simple and well-understood. So the important graph is the graph of potential temperature vs altitude (or pressure), which shows what temperature each parcel of air would have if it was moved to the surface without any exchange of heat. It allows us to properly compare air temperature at different heights (pressures).
We see that potential temperature – the real comparison metric – increases with height. This is to be expected – warmer air floats above cooler air:

From Marshall & Plumb (2008)
Figure 7 – Click for a larger image
So, if we take air, warmed by strong solar heating at the surface, and raise it quickly to the tropopause, how does it ever come down?
Consider the air with potential temperature of 360K (almost 87°C if moved adiabatically back to the surface). If it starts to sink it warms (due to compression by the atmosphere) and its natural buoyancy pushes it back up.
Radiative Cooling
The mechanism for air to subside involves losing heat “diabatically”. Adiabatic means no exchange of heat with surroundings, which can happen with rapid air movement during convection. Diabatic means there is an exchange of heat with the surroundings.
And as the air cools it sinks. (Its actual & potential temperature decreases, allowing it to sink, but then compressional warming takes place and its actual temperature increases).

From Minschwaner & McElroy 1992
Figure 8
If there was no radiative cooling there would be no gentle subsidence, at least nothing like the current process we see in the atmosphere.
Skip the next section if you don’t like maths..
Maths Digression
There is an equation for the subsiding region which relates the heating rate (=-cooling rate), H, with two important parameters:
H ∝ cp.ω.∂θ/∂p
where H = heating rate (=-cooling rate), ∝ is the symbol for “proportional to”, cp = heat capacity of air under constant pressure, ω = rate of change of pressure with time following the parcel (how fast the parcel is ascending or descending), ∂θ/∂p = change in potential temperature with pressure, so this is a measure of the atmospheric stratification
The two important parameters are:
- ω – subsidence rate
- ∂θ/∂p – stratification of the atmosphere
The value H is essentially dependent on the amount of radiatively-active gases in the atmosphere in the subsiding region. There is also an effect from any mixing with extra-tropical colder air.
Results from the Teaching Model
Here is a sample result from Pierrehumbert’s model under some simplified assumptions (no ocean heat transport and no heat transfer between tropics and extra-tropics).
The solid curve is Energy In to the warm pool = absorbed solar – cooling due to atmospheric circulation from the cold pool. The dashed curve is Energy Out from the warm pool:
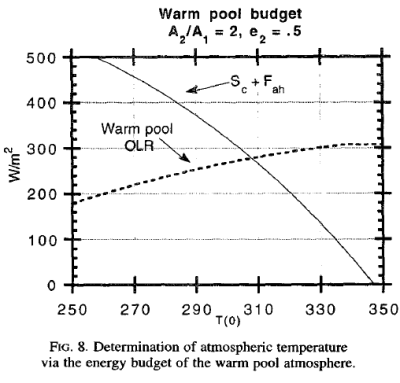
From Pierrehumbert 1995
Figure 9
Pierrehumbert makes the comment that the stability of the solution depends on the steepness of the solid curve and this is due to the fixed emissivity of the “cold pool” atmosphere. Remember that the region with subsidence has little water vapor above the boundary layer. In fact, as we will see in the upcoming graphs, it is the ability of the subsiding region to cool via radiation that allows the atmospheric circulation.
Here is set of graphs under the same simplified assumptions (and with RH=100% in the warm pool) showing how the surface temperature (Ts1 = warm pool sea surface temperature, Ts2 = cold pool sea surface temperature) varies with emissivity of the cold pool atmosphere. Each graph is a different ratio of surface area of cold pool vs warm pool. Remember that the “warm pool” is the convecting regions and the “cold pool” is the subsiding regions:
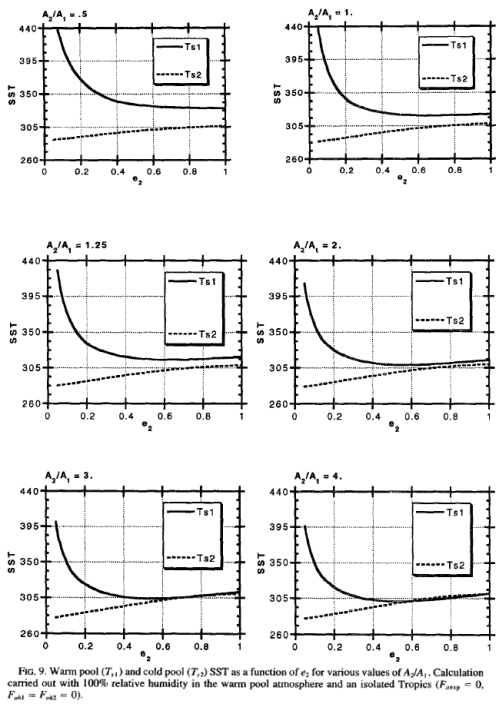
From Pierrehumbert 1995
Figure 10
We can see that when the emissivity of the cold pool region is very low (when the amount of “greenhouse” gases is very low) the warm pool regions go into a form of thermal runaway. This is because radiative cooling is now very ineffective in the subsiding regions and so the tropical large-scale atmospheric circulation (the Hadley circulation) is “choked up”. If air can’t cool, it can’t descend, and so the circulation slows right down.
Consider the case where there is much less CO2 in the atmosphere – then the emissivity is governed mostly by water vapor. So the dry subsiding region has little ability to radiate any heat to space – preventing subsidence – but the hot moist convecting region cannot radiate sufficient heat to space because the emission to space is coming from higher up in the atmosphere, e.g. see fig. 6, of the water vapor.
So increasing the emissivity from zero (increasing “greenhouse” gases) cools the climate to begin with. Then as the emissivity increases past a certain point the warm pool surface temperatures start to increase again.
And so long as the cold pool area is large enough compared with the warm pool area the temperatures can be quite reasonable – even without any export of heat to higher latitudes.
This is a very interesting result. We see that climate is not “linear”. In simple terms “not linear” means that just because one area cools down by 1°C doesn’t mean that an equal size area must heat up by 1°C.
Now we see a result with slightly more realistic boundary conditions – heat is exported to higher latitudes (and RH reduced to 75% in the warm pool):
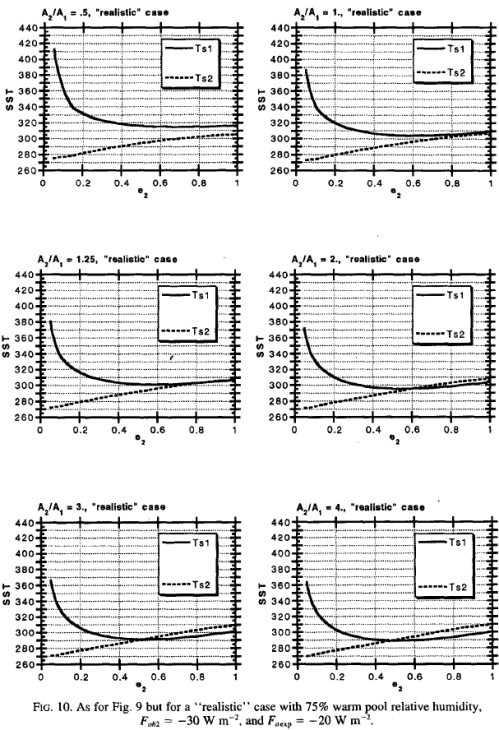
From Pierrehumbert 1995
Figure 11
Overall, the result of the (slightly) more realistic conditions is simply reducing the temperatures. This is not surprising.
Conclusion
The 1995 paper is quite complex and covers more than this topic (note for keen readers, the end of the paper has a summary of all the terms used in the paper, something I wish I had known while trying to make sense of it).
The model is a very simplified model of the atmosphere and can easily be criticized for any of the particular assumptions it makes.
The reason for highlighting the paper and drawing out some of its conclusions is because there is a lot of value in understanding:
- the large scale circulation
- its effect on water vapor
- what factors allow air near the tropopause to cool and descend
- the non-linearity of climate
Of particular interest might be understanding that more “greenhouse” gases in the subsiding regions allow a faster circulation, which in turn removes more heat from the climate than a slower circulation.
Articles in the Series
Part One – introducing some ideas from Ramanathan from ERBE 1985 – 1989 results
Part One – Responses – answering some questions about Part One
Part Two – some introductory ideas about water vapor including measurements
Part Three – effects of water vapor at different heights (non-linearity issues), problems of the 3d motion of air in the water vapor problem and some calculations over a few decades
Part Four – discussion and results of a paper by Dessler et al using the latest AIRS and CERES data to calculate current atmospheric and water vapor feedback vs height and surface temperature
Part Five – Back of the envelope calcs from Pierrehumbert – focusing on a 1995 paper by Pierrehumbert to show some basics about circulation within the tropics and how the drier subsiding regions of the circulation contribute to cooling the tropics
Part Six – Nonlinearity and Dry Atmospheres – demonstrating that different distributions of water vapor yet with the same mean can result in different radiation to space, and how this is important for drier regions like the sub-tropics
Part Seven – Upper Tropospheric Models & Measurement – recent measurements from AIRS showing upper tropospheric water vapor increases with surface temperature
Part Eight – Clear Sky Comparison of Models with ERBE and CERES – a paper from Chung et al (2010) showing clear sky OLR vs temperature vs models for a number of cases
Part Nine – Data I – Ts vs OLR – data from CERES on OLR compared with surface temperature from NCAR – and what we determine
Part Ten – Data II – Ts vs OLR – more on the data
References
Atmosphere, Ocean and Climate Dynamics, Marshall & Plumb, Elsevier Academic Press (2008)
Tropical and Extra-Tropical influences on the distribution of free tropospheric humidity over the inter-tropical belt, Roca et al, Surveys in Geophysics (2012)
Thermostats, radiator fins, and the local runaway greenhouse, Pierrehumbert, Journal of the Atmospheric Sciences (1995) – free paper
Subtropical Water Vapor As a Mediator of Rapid Global Climate Change, Pierrehumbert, (1999)
Notes
Note 1 – The statement:
Clouds do not alter this conclusion because insofar as Cs + Cl = 0 in the tropics the reduction in solar absorption is compensated by an equal reduction in OLR
relates to the fact that in the tropical region the overall cloud effect is close to zero. This is surprising and the subject of much study. For a starting point see On the Observed Near Cancellation between Longwave and Shortwave Cloud Forcing in Tropical Regions, J.T. Kiehl, Journal of Climate (1994)


Let’s start the discussion with a different view on the same issue.
The circulation in the atmosphere leads always to dissipation in many ways. To maintain the circulation in presence of dissipation we need the “atmospheric heat engine”. The atmospheric heat engine works as all heat engines based an a process where heat is added to the system at a high temperature and taken off form the system a low temperature.
The principal high temperature region is the tropical surface where solar heating heats the atmosphere where it’s temperature is well above average. (That’s true for both the real temperature and the equivalent potential temperature, the equivalent potential takes the condensation into account, see Temperature Profile in the Atmosphere – The Lapse Rate.) This is the hot side of the heat engine, but we need also the cold side, and we need a geometry that leads to the circulation.
The geometry is produced naturally by the location of the hot side. Heated air rises and pushes air higher up to higher latitudes, while it sucks surface air from higher latitudes to the tropical region. Thus the power of the heat engine is determined largely by the cold side: how much colder it is than the hot side and how much energy it releases to space (of course the properties of the hot side are equally important). The comparison of temperatures must be based on potential temperatures, but that’s made a little complex by the difference between the dry and moist potential temperatures and by the specific roles each of them has.
The above post tells, how additional CO2 adds significantly to the amount emitted from parts of atmosphere where the amount of water vapor is small. It’s small both very high in the tropics and over a wide range of altitudes in subtropic. In subtropic that extends to higher temperatures where emission rate is higher. Much of this is masked by atmosphere higher up but even so the emission of low potential temperature to space proceeds more freely than in the tropics.
Pekka Pirilä.
“Let’s start the discussion with a different view on the same issue.”
OK.
“The circulation in the atmosphere leads always to dissipation in many ways.”
I concur.
“To maintain the circulation in presence of dissipation we need the “atmospheric heat engine”.”
Why only this? We also have Earth’s centrifuge system which, though seemingly forgotten, produces the three climate cells in each hemisphere.
“The atmospheric heat engine works as all heat engines based an a process where heat is added to the system at a high temperature and taken off form the system a low temperature.”
Ignoring the ‘typos’. A “heat engine” generates energy that can be converted into a form of energy that you can use, namely, ‘enthalpy’. Without ‘enthalpy’ the energy just goes to waste ‘entropy’. This ‘should’ register as a basic level introduction to the engineering science of thermodynamics and a post grad doctorate of climate science. 🙂
Seriously, you’re missing the ‘elephant in the room’ here. In a “heat engine” (engine being the major descriptor), the ‘engine’ is a means towards the ‘conversion’ of energy into ‘another’ medium! Thus, its conversion efficiency can be ‘rated’ as ‘eta’ (sorry, but I don’t have the ability to write ‘open source’ script here).
Later, you may be able to see the attractors to energy that define the course of ‘insolation’ to ‘OLR’. If I decide to post here again. Your “Geometry” is awry.
That’s all I want to say here at this time. 🙂
Best regards, Ray.
suricat,
Enthalpy and internal energy and their differences and relation to heat are not the important point here. Going deeper to thermodynamics we could start to discuss (Helmholtz) free energy and it’s relationship to internal energy. It’s called “free” because it’s free to do work. That would be a more fruitful extension of the approach.
The atmospheric heat engine is an useful concept to determine general properties of the atmospheric processes, and to find out some fundamental limits on how it can behave as a whole. Whether it is as useful part of more detailed analysis is more questionable.
Pekka Pirilä.
“Enthalpy and internal energy and their differences and relation to heat are not the important point here”
I concur on the subject of “heat”, but not on the point of ‘energy transport’.
“Going deeper to thermodynamics we could start to discuss (Helmholtz) free energy and it’s relationship to internal energy.”
Why? Many energy transport scenarios are NOT ‘reversible’.
“It’s called “free” because it’s free to do work.”
That only means that ‘this’ energy has many attractors. Thus, the attractor of your choice is likely to receive energy from this source (with its associated efficiency rating). This limits the ‘observational’ diversity of the attractors to the ‘source’ of energy.
“That would be a more fruitful extension of the approach.”
I’m doubtful.
“The atmospheric heat engine is an useful concept to determine general properties of the atmospheric processes, and to find out some fundamental limits on how it can behave as a whole.”
Only for basic conceptions (I’m ignoring ‘typos’ again). The ‘Atmospheric Heat Engine’ concept can only be fully understood by individuals with the technical degree of insight able to conceptualise this scenario. I’m happy to ‘go with this’, but I’m not sure that this site is the best place to discuss this.
“Whether it is as useful part of more detailed analysis is more questionable.”
I concur (typo included).
You’re not really serious here are you. If you were, you’d be more careful with your scripted construction.
Best regards, Ray.
suricat,
I have not tried to present any full construction. My main idea in writing the first comment was to point out that the same phenomena that were studied by the toy model of Pierrehumbert can be approached by another model that can be described concisely and that may offer some additional insight to the phenomena.
A don’t propose that my short comment would be even such a concise description by itself but hoped that it would have given the basic idea of it.
Free energies (perhaps Gibbs rather than Helmholtz) are useful at least in discussion of evaporation and condensation. Enthalpy is more useful than internal energy, but I don’t understand.
I did mention in another comment that the efficiency of the atmospheric heat engine is almost zero in one way of looking at that. Lifting water from surface to clouds can be considered either work done by the engine or dissipation within the engine. The heat engine within the Hadley circulation drives the Ferrel cells that circulate in the “wrong” direction. This could be considered work done by the “Hadley cell engine” or again part of the atmospheric dissipation. There are further examples of similar nature. The concept is vague enough to allow for different interpretations.
Pekka Pirilä.
“That Earth is spinning affects certainly the circulation greatly, but it’s just one factor out of many.”
It is, but it’s also the ‘base’ factor affecting circulation of an atmosphere for ‘any’ planet ‘supports’ an atmosphere that rotates with an appreciable rate of revolution. Where have I missed this in this thread, or (indeed) in coupled climate models of the period for this Pierre Humbert review?
The truth is (with no disrespect to yourself Pekka), ‘Climate Science’ (per se) has become too ‘fragmented’ and tends to deal only with ‘the issue at hand’ whilst loosing the ‘greater picture’. For example, Earth’s rotational effect spans the ‘entire globe’, but becomes ‘broken’ into the latitudes that ‘appear’ to make more sense when these latitudes are viewed in isolation. This is ‘broken’ science and detracts from any understanding of the ‘big picture’. All latitudes of the Earth are affected by influences generated by Earth’s rotation, but these ‘influences’ don’t seem to be mentioned any more.
“I wrote my comment because I believe that it provides another view on the same phenomena and that this other view is complementary and useful. The concept of atmospheric heat engine is well known and used by many also in textbooks of climate science. If you wish to point out that my description of it is false then you should tell more specifically, how it differs from the widely accepted ones.”
OK. You deserve further explication. 🙂
The ‘atmospheric heat engine’ concept involves ‘enthalpy’. Enthalpy is a value for the energy that is ‘used’ to achieve your required outcome. However, to enable your ‘required outcome’ a greater value of energy needs to be used to achieve this (no system is 100% efficient because other systems tend to ‘rob’ the ‘system under observation’ of energy in accordance with their hierarchical status for energy absorption within ‘the system’).
If (for example) you apply these observations to the thermodynamics of a ‘wet adiabat’ during ‘subsidence’… Water is evolved from ‘WV’ (water vapour) during the ‘ascension’ of the gas and the opposite should be realised for a ‘parcel’s’ decrease in altitude. IOW, during ‘subsidence’ the extra temp. generated by the ‘pressure’ (PV=nRT) system promotes evaporation of water within the ‘parcel’ to, not only, alter buoyancy/density within the atmosphere, but to alter its volume/mass ratio as well (these values also alter for the property values for Earthbound compounds generated at their various Ps,Vs, & Ts.
It’s a more complex problem than ‘just an adiabat’ in De Witt’s scenario. 🙂
I’m happy that I found the time to post here again during the ‘festive season’.
Best regards, Ray.
suricat,
Haven’t you noticed how many posts of this site discuss the rotation of the Earth and how rotation affects circulation.
Haven’t you looked at any general textbook of atmospheric science? They use a major part of their pages to discuss how Earth rotation affects the atmospheric circulation. (It’s, however, true that the book on Planetary Climate by Pierrehumbert has very little text on this as its emphasis is on other issues. That may be a real weakness of the book but it has 598 pages before it gets to the short chapter on dynamics where the circulation is discussed. One book cannot cover everything at the level of detail of Pierrehumbert’s book.)
The rotation of Earth alone would just keep the atmosphere rotating at the same speed. Atmosphere would be in rest with respect to the surface underneath. The power that’s behind all circulation comes from heating somewhere and cooling elsewhere. The rotation of the Earth makes then the ensuing circulation very different from what it would be on a non-rotating or very slowly rotating Earth.
Maintaining circulation requires conversion of heat to large scale collective motion. The concept of atmospheric heat engine is used to describe this conversion. The large scale collective motion of air is the atmospheric circulation. The rotation of the Earth forces that circulation to have the structure that includes Hadley and Ferrel cells, tropospheric jet stream and many other components and features. The strongest driving force to maintain all this comes from the heating of tropical surface areas in combination with cooling of the upper troposphere over that range of latitudes that covers the Hadley cells. Through the Coriolis force Hadley circulation drives the jet stream. Further consequences of this circulation are baroclinic instabilities and Ferrel cells.
The Hadley cells are the main atmospheric heat engine that has enough power to drive a major part of all atmospheric circulation. There are also other processes that involve heating at one point and cooling at another in the way that affects the circulation, but the power produced to affect the circulation is less in these other cases as both the temperature differences and the amounts of heat are smaller.
Pekka Pirilä.
“I have not tried to present any full construction. My main idea in writing the first comment was to point out that the same phenomena that were studied by the toy model of Pierrehumbert can be approached by another model that can be described concisely and that may offer some additional insight to the phenomena.”
Yes, and I ‘do’ appreciate our discourse. However…..!
“I did mention in another comment that the efficiency of the atmospheric heat engine is almost zero in one way of looking at that.”
Yes, and this method of observation doesn’t provide any account for any energy transfer that is ‘away’ (ejected) from Earth’s systems. The ‘energy balance’ is represented ONLY at ‘TOA’ (Top Of Atmosphere). Thus, with this model ‘type’ (introspective), only generates ‘delays’ to energy transport away from Earth’s systems and can only be considered as a ‘delay loop’, of sorts, that alters the ‘reactance period’ (either ‘temporarily’ or ‘semi-permanently’). However…..!
“The heat engine within the Hadley circulation drives the Ferrel cells that circulate in the “wrong” direction”
Absolutely NOT the case! There is an underlying process here! Earth-spin!
However, being as our host is trying to underpin their understanding of ‘old papers’, our dialogue is superfluous to this thread (see: | Reply scienceofdoomn December 25, 2012 at 12:17 am and scienceofdoom december 24, 2012 at 11:25 pm.
I hope that all here had a happy Christmas and shall have a happy new year! 🙂
Best regards, Ray Dart.
Suricat,
That Earth is spinning affects certainly the circulation greatly, but it’s just one factor out of many.
I wrote my comment because I believe that it provides another view on the same phenomena and that this other view is complementary and useful. The concept of atmospheric heat engine is well known and used by many also in textbooks of climate science. If you wish to point out that my description of it is false then you should tell more specifically, how it differs from the widely accepted ones.
Your judgment is obviously that discussing the approach further is misplaced. That’s logical based on your views about it. I tried to explain above, why my views differ on both counts.
The assumption of adiabatic expansion/contraction may not be entirely correct for large scale circulation. The vertical velocities are quite low, small fractions of a Pa/s at 500 hPa, and given the turbulence that always exists in the atmosphere due to the large distance scales, some mixing must occur. That should mean that even in a perfectly transparent atmosphere, there will still be a lapse rate in the troposphere in the descending regions in the sub-tropics and probably at higher latitudes as well.
The hypothesis that increased ghg’s leads to faster circulation would explain the model results of faster tropical upper troposphere heating. The problem is that this heating does not seem to be occurring in the real world.
This would also seem to be related to Lindzen’s Iris hypothesis.
That should be: “…there will still be a positive lapse rate…”
The circulation cannot be adiabatic but must dissipate all the work produced by the atmospheric heat engine. That fact must manifest itself in many ways in the lapse rates as well.
One example of dissipative processes is related to rain. Water is transported from the surface to various altitudes where it condensates and rains down as liquid drops (or hail). Transporting the water up takes work which is not recovered from the rain as work but converted to heat trough friction during the fall. The kinetic energy left when the drops hit the surface produces heat there. Thus all the potential energy that the drops have in gravitational field presents dissipation of work to heat somewhere in the system.
To get the order of magnitude raising 1 ton of water to 1 km altitude takes 10 MJ. 10 MJ/m^2 in a year is 0.3 W/m^2, which would be the dissipation of this effect alone. That should be compared with the ideal power of the atmospheric heat engine which is of the order of 10 W/m^2 (solar heating minus net radiative heat transfer is about 100 W/m^2, multiplying by Carnot efficiency of 10% assuming an average temperature difference of 30 C between the hot side and the cold side results in 10 W/m^2). The real power of the atmospheric heat engine is much lower than 10 W/m^2, perhaps 2 W/m^2.
I must add that I’m not sure what the real power of atmospheric heat engine means. I have seen the number of 2 W/m^2 but don’t know how the corresponding power is defined as all that power is ultimately dissipated and very little is taken off from the atmosphere as power.
There are wind turbines that take a little power and oceans take some more but by far most is dissipated in atmosphere itself.
Pekka,
As I remember, turbulent flow is by definition dissipative. You’re not going to get laminar flow in the atmosphere which implies that all atmospheric flow is dissipative. I think that’s the source of the 2 W/m² number, most of which is horizontal flow.
Any vertical circulation will force the lapse rate towards the adiabatic rate because the work needed to move air up and down is zero at the adiabatic lapse rate. Note, that’s force towards, not that the lapse rate must be adiabatic.
DeWitt,
Turbulence must be the best known form of dissipation. It involves transformation of kinetic energy of collective flows to heat which is always a dissipative process, and it involves also mixing which is dissipative whenever the gases of differing temperature or differing humidity are mixed.
Vertical convection is typically due to a temperature gradient that exceeds the moist adiabatic lapse rate. In that case the change is always towards adiabatic lapse rate. Vertical convection may, however, be driven also by pressures that deviate from equilibrium. Hadley cells are supported by the cooling of the air by radiation in the upper troposphere but the strong convection near equator drives the cell formation also due to the surface temperature gradients. This second mechanism is essentially a pressure effect from the point of view of the subsiding flow. For such a flow dissipation may, at least in principle, bring the lapse rate to a value that exceeds slightly the adiabatic lapse rate. (Other forms of dissipation like radiative heat transfer over a distance work towards a less steep temperature gradient and may ultimately win.)
I would like to see estimates of the strengths of various dissipative mechanisms but haven’t found many. Perhaps someone could help in finding those.
Dewitt: How fast is the Hadley circulation? The figures for vertical velocities you cite are annual averages, but the ITCZ moves north and south with the sun. If the central core of convection spent 10% of its time over one spot, the core flow would be 10X bigger. If 1%; 100X.
I took the figure of 10^9 kg/s for the Hadley circulation in Figure 1, a density of 0.65 kg/m3 (500 mb, 0 degC), an arbitrary ITCZ convective region 40,000 km around the earth by 1 km wide and calculated (hopefully correctly) 10 days to reach 15 km. The size of the convective area would need to be much smaller to envision an adiabatic process. We need measured velocities that are not averaged over time.
Frank,
The problem is that 90+% of all upward convection returns downward locally. Any upward velocity measurement must be corrected for this. That’s why the net velocities are averaged over time and space. But note that the averages for the graph I linked were for the month of July for 1979-2001, not for the whole year. The ITCZ shouldn’t move much in one month.
This fact is relevant for the discussion of dissipation as the vertical convection that’s combined with nearby subsiding flow must be a one of the strongest sources of dissipation through turbulent mixing and other mechanisms.
Here is the graph that DeWitt linked (3:52pm):
Click for a larger image.
DeWitt,
It’s not correct. However, the rapid ascent during deep convection does appear to involve little energy exchange with the surrounding atmosphere. The slow subsidence in the descending branch of the circulation is of course not adiabatic.
In this simple model this effect occurs in the change from little or no GHGs through to a lower value than we have in the current climate.
SoD,
That’s obviously true for an atmosphere that absorbs and emits in the thermal IR. My point was that it would also be true in a perfectly transparent atmosphere because of mixing with the surrounding air. Hence you wouldn’t necessarily get Pekka’s isothermal upper atmosphere with only a thin boundary layer for a perfectly transparent atmosphere.
Does it make sense for Pierrehumbert to assume that sum of cloud shortwave (Cs) and longwave (Cl) feedbacks will be unchanged in the tropics? My limited understanding indicates that Cl depends on the temperature of the cloud tops (ie their altitude) and that Cs depends on their composition (droplet size, ice vs liquid, ?) Clouds are a cooling influence over the planet as a whole (-18 W/m2) and regional variations exist within the tropics. See SOD’s: https://scienceofdoom.com/2010/05/30/clouds-and-water-vapor-part-one/ Your Kiehl reference suggests this is a coincidence.
Pierrehumbert’s assumption is good for one thing – it guarantees his model won’t have negative cloud feedback in the tropics.
Since current data is somewhat or highly inconsistent with the existence of a hot-spot in the upper tropical troposphere, are speculative articles like this one from the 1990’s still relevant?
It seems to me that excessive surface warming will always produce convection that travels high enough for radiative cooling to become practical. Whether the main GHG is water or carbon dioxide, as a parcel of air ascends the pressure will eventually drop enough so that photons can escape between the GHG molecules. At that altitude, however, there will still be some GHG left to emit those photons. Any convective parcel must remain at an altitude where radiative cooling is effective while it has travels far enough poleward to reach a subsiding region
Frank,
It is more about using the available data.
Here is what Pierrehumbert says:
[Emphasis added].
Note – “the assumption that (Cs+Cl)=0″ is for the tropics – the area of study in this 1995 paper.
In the conclusion, the author states:
Pierrehumbert’s paper is explaining the role of the subsiding regions of the tropical climate in cooling the tropical climate via radiative effects. In this study the role of clouds to the best available knowledge was minimal.
It seems like a reasonable approach to me.
SOD: I did read the quoted section of the paper carefully, but I lost interest when I encountered this seemingly arbitrary assumption that would eliminate the possibility of negative cloud feedback. Since cloud feedback is negative elsewhere on the planet and variable within the tropics, I respectfully disagree with your judgment that this is a reasonable assumption. Cloud feedback is negative outside the tropics, probably because cloud tops are lower there. I do recognize that warmer SSTs might drive tropical convection and cloud tops even higher and produce positive feedback, but not all cloud tops in the tropics are high enough to produce positive feedback. Furthermore, warmer tropical SSTs must exist before the cloud tops can be driven higher by enhanced convection. The introduction to several of your references mentions evidence that tropical SSTs are surprisingly stable. Several mechanisms have been proposed, but I don’t know enough about them to comment intelligently.
Some of this work is derived by observations made by ERBE a quarter century ago. I’d be more interested in knowing how observations have changed over that period of time and what they tell us about the future – assuming that the measurements are stable enough over time for changes to be meaningful. But that doesn’t mean I don’t deeply appreciate your efforts to present what you feel is important climate science and host an intelligent forum to discuss them.
If we consider the Pierrehumbert paper only as an explanation of certain phenomena then it makes sense to check what happens in his toy model.
If our interest is to get a feeling of the present understanding on the feedbacks in the tropics then it’s questionabel whether we should spend time on a 1995 paper in a field that has been of extensive scientific interest all the 19 years that have past since the paper was originally submitted for publication.
I checked, how the Pierrehumbert paper has been referred in later scientific publications. According to Google Scholar the paper has been cited 249 times which is a respectable number. Checking later review articles is a good way of getting feeling about the significance of the paper. One such article is the 2005 article by Graeme Stephens on cloud feedbacks.
Here the Pierrehumbert paper is mentioned in the following two paragaraphs:
where I have skipped the first category and left out the third.
These quotes and the further discussion of the Stephens review suggest that the paper has proposed ideas that have not lost their interest but present just one of many hypotheses of equal standing.
One side remark from this is that Stephens refers specifically to Walker circulation, Pierrehumbert mentions Hadley-Walker circulation and seems thus consider both zonal and meridional circulations.
Frank (6:52pm),
Not sure what you are saying. This is a model of the tropics. Apparently, shortwave and longwave climate forcing just about cancel out in the tropics.
Why is it an arbitrary assumption? Do you think he is claiming something about the effect outside the tropics? Do you think the measurements of the cloud forcing in tropics are wrong?
When I typed “climate forcing” in the comment above I had meant to type “cloud forcing”.
Pekka on December 24, 2012 at 9:11 pm:
If I have given the impression that this paper represents some unquestioned truth of atmospheric physics then this was not my intention. This is a useful paper for considering some important concepts in humidity, feedback, atmospheric circulation and tropical temperature stability.
The point is that the primary atmospheric circulation does not really describe all the patterns of convection and subsidence.
The Hadley circulation describes the main meridional circulation (from equator to 30’N and 30’S), the Walker circulation describes the circulation between different cells on the same latitude.
However, convection and subsidence are also taking place side by side, as can be seen in this graphic:
The values I have seen for the area for which convection is taking place vs subsidence cover quite a range, but it is clear that at any one time convection takes place over a small percentage of the total area of the tropics.
Pekka (from 9:11pm),
Here’s an interesting perspective on older papers, from How Well Do We Understand and Evaluate Climate Change Feedback Processes?, Bony et al, Journal of Climate (2006):
This paper is well worth a read.
SoD,
I have tried several times to post the following comment, but failed. Now I try from another computer.
When I read your post my impression was that you were just describing one mechanism and avoiding claims on its quantitative applicability. Later discussion has shown that at least Frank has read the post at least little differently and that it’s likely that he is far from the only one.
Discussing how good or bad is the assumption of little net forcing from tropical clouds is a step towards discussing the quantitative applicability of the Pierrehumbert paper. You could have restricted your comments on that to the argument that there was at least some empirical evidence on the validity of that assumption. Only part of the results are affected strongly by this assumption and my view is that those results were not the most central from the point of view of your post.
SoD: After re-reading your reasons for citing this paper in the conclusions, in retrospect I have no complaints about your featuring this paper. The paper illustrates important principles.
I do have some difficulties in accepting this paper as an explanation for the apparent negative feedback which limits tropical SST to around 300 degK (the main purpose of this paper). The review mention by Pekka shows that we have multiple theories/models concerning this phenomena developed a long time ago using even older data. In the normal scientific process, we don’t pay much attention to hypotheses that are developed to explain a given set of observations (for example the differences between April 1987 – El Nino – and April 1985 observed by ERBE. We pay much more attention when theories/models explain things that weren’t known when the theory/model was developed (such as observations the half-dozen ENSO cycles that have taken place since then). Pierrehumbert’s 1999 paper that you cited does look at some new data – from one location in the subtropical Pacific on 4 days in March of 1993.
The same thing goes for Ramanathan’s calculation of clear sky water vapor+lapse rate feedback and the “supergreenhouse” from ERBE data obtained during one year in the late 1980’s.
“We can see that when the emissivity of the cold pool region is very low (when the amount of “greenhouse” gases is very low)”
It is important to consider the geometry of the subsidence layer.
The top of the subsidence layer contains little water vapor, thus doesn’t cool, and thus doesn’t subside any further.
But the bottom of the subsidence layer creates the situation of a deep dry layer over a low level moist layer ( the boundary layer ). The emissivity of the this boundary is very high. More importantly, because the emission takes place from a low, warmer level, the energy lost to space from the regions of subtropical subsidence is the greatest anywhere on earth.
Climate Weenie,
If the emissivity above the boundary layer is too low then radiative cooling cannot take place and no subsidence will occur (until mixing from colder extra-tropical air takes place).
However, in the current climate the emissivity of the air is significant even with zero water vapor. This means air near the tropopause can cool to space and therefore subside.
The total OLR (outgoing longwave radiation) in the subtropics has a much larger component from the surface than the convective regions of the tropics. This is why OLR is higher in the cooler sub-tropics. But if we only had cooling to space from the surface in the sub-tropics then the large-scale circulation would be much less effective.
The importance of radiative cooling at high altitude can be seen when considering cell circulation without such cooling.
The rising convection starts by warm moist air that cools following the moist adiabat while the subsiding flow is dry and follows the dry adiabat. That would result in a much warmer air at the point where the subsiding flow stops than at the same altitude for the rising air. This is obviously not sustainable. A strong radiation from the air at low altitudes ant the surface to space does not remove the problem because it would lead to a temperature inversion and would not help much in keeping the circulation going.
DeWitt noted already on the similarity of this development with my proposal for the stationary state of a totally transparent atmosphere. The situation is not identical but there are close similarities. (I haven’t given up with my proposal as a plausible outcome in spite of the doubts presented by others. The actual outcome depends on quantitative factors that remain open based on what I have seen.)
Pekka,
While a nearly isothermal atmosphere would maximize the entropy of the atmosphere, it would result in a wider temperature range at the surface. I haven’t even thought about trying to run the numbers, but my intuition says that increased circulation causing a non-isothermal atmosphere would result in higher entropy of the system.
DeWitt,
What happens quantitatively in case of totally transparent atmosphere is a nice issue to ponder but of no practical interest as far as I can see. We agree on the physical processes but have differing intuitive guesses on the quantitative outcome. It would be interesting to see the results of a careful analysis, but not more than that. The situation is not a thermodynamic equilibrium and thus entropy maximization doesn’t necessarily tell the right answer, a dynamic analysis is required to resolve the issue.
I think that it’s an interesting observation that a very low concentration of non-condensing GHG’s could lead to similar phenomena in tropics (although certainly not all the way to isothermal atmosphere). These phenomena are essentially the same that lead to stratification in my view of the transparent atmosphere, but in this case a moist adiabatic lapse rate would still apply in the weak rising convection that would continue even with very low GHG concentration.
Walker circulation might be stopped totally but it’s difficult to see, how Hadley circulation would not remain in a weakened form.
Some explanation for why I have written an article on a paper that is quite dated. (This also applies to Clouds and Water Vapor – Part One where the content was from a 2006 book, but ultimately much of it came from Observational Determination of the Greenhouse Effect,Raval & Ramanathan, Nature 1989).
Most current papers, even review papers, draw on, supersede, or oppose the concepts, theories and ideas that have more clearly expressed in earlier papers.
Without getting a clear grasp on the earlier ideas I cannot really understand the modern papers.
It’s a bit like trying to understand a paper on the calculation of radiative forcing due to increases in CO2 without understanding the basics of the theory of radiative transfer.
And the other reason for using this paper was to highlight large scale subsidence via radiative cooling as an important concept. Many papers try to calculate something of significance via arguments about subsidence, for example, Water Vapor Feedback in the Tropical Upper Troposphere: Model Results and Observations, Minschwaner & Dessler, Journal of Climate (2004) – abstract:
[…] […]
SoD wrote (about the descending branch of the Hadley circulation):
“Once at the tropopause it slowly subsides, and warms due to adiabatic compression. During this subsidence, the absolute amount of water vapor doesn’t increase (no source of new water vapor), but the temperature does increase. Therefore, the relative humidity (RH) – the amount of water vapor present vs the maximum that could be held – keeps decreasing.”
A dry adiabatic lapse rate of about 10 deg/km times roughly 13 km between the tropopause and the boundary layer predicts temperatures at the bottom of the descending circulation that are far too warm. If you look at your plot of absolute humidity vs altitude and latitude (see link), you’ll see that absolute humidity does increase as the Hadley circulation descends. My calculation on the vertical velocity associated with the Hadley circulation (based on 10^9 kg/s) and Dewitt’s info suggest that descent (and possibly ascent) may be too slow to be adiabatic.
Your description of the Hadley circulation may be too idealized. The real circulation appears to be distorted by radiative energy transfer and turbulent meridional convection of water vapor and sensible heat at all altitudes (not just poleward near the tropopause and – “equatorward” near the surface). Of course, these significant distortions are small enough that the big picture (warm moist air ascending over the equator, warm dry air descending over the subtropics) is still correct.
Frank,
I also said later in the article when I was trying to explain in more detail:
So definitely, subsidence is not an adiabatic process. My intro description was not clear and I will amend it.
I have amended the sentence from the intro to read: “Once at the tropopause it slowly subsides, and warms due to compression by the atmosphere [updated sentence Dec 27th].“
SoD: Since absolute humidity does increase during subsistence (almost 10-fold?),
I suspect your description need to include a source of water vapor during descent (as well as a loss of heat). As best I can tell, there is far more horizontal mixing than your simple model suggests.
According to the paper of Folkins and Martin (link in a comment further down) absolute humidity is increased by evaporation of precipitation. That’s easy to understand when the sinking flow occurs near to the rising one, i.e. in the case described in the picture of a comment of SoD further up. In case of larger scale Hadley and Walker circulation that seems less likely.
As far as I can see the simple picture of only a rising and a subsiding air flow requires cooling by radiation. I wrote on that in my above comment.
To maintain the circulation cooling is needed in one way or another. If that doesn’t happen by radiation from the circulating air at high altitudes then there must be mixing from higher latitudes. Here we come again to my hypothesis on the state of a fully transparent atmosphere or in other words:
There cannot be strong circulation without strong radiative cooling from high altitudes somewhere in the atmosphere.
This much is certain even it it’s not certain that the alternative is an atmosphere that’s almost everywhere stratified as the alternative may also be an atmosphere with a adiabatic lapse rate throughout a high troposphere but with weak circulation.
Slowness of the circulation makes it diabatic only to the extent there are dissipative processes that are fast enough in a slowly moving atmosphere. One example is horizontal mixing that may get important if horizontal winds are strong relative to vertical motion. Dissipation due to radiation has also more time to act when vertical motion is slow. In some scenarios all dissipation would, however, also be reduced with slower vertical flows and perhaps even more than the vertical motion.
Thus it’s not possible to conclude that slower vertical circulation makes the assumption of adiabatic expansion and compression any less accurate. For that conclusion the dissipative processes must be discussed as well and found to get stronger relative to the vertical circulation.
Pekka,
Planetary rotation is also important to circulation. As I remember from the comment (which I can no longer find) from someone who has used a GCM to model a planet with a transparent atmosphere, if the planet is tide locked with one side always facing the sun he found something like the stratified atmosphere you describe. For a planet with a rotation rate similar to Earth, he didn’t. Apparently, addition of the Coriolis effect increases dissipation and mixing enough to allow more vertical circulation. Maybe. But as you say, this is interesting but not very relevant.
“So definitely, subsidence is not an adiabatic process.”
How about a modification to this statement?
The process of subsidence is adiabatic ( compression and decompression are reversible processes ) but the process which induces subtropical subsidence, namely radiative cooling by water vapor, is adiabatic.
Here is a good image to add:
It depicts the importance of subsidence forced by the radiative cooling of water vapor.
As you hinted at above, this sets up a limit to water vapor feedback:
Increasing water vapor in the tropical atmosphere increases subsidence which dries the (upper) tropical atmosphere.
Interpreting that image is not so straightforward. This text from the introduction of the related paper of Folkins and Martin tells something about the background:
The paper is on the budget of water vapor. It has some relationship with the subject of the post but the connection is not simple. The mechanisms discussed in the paper do not tell much of the moisture of subsiding flow of cell circulation. That would remain low due to the clear separation from the regions of deep convection and the dryness of air at the high altitude where the deep convection stops.
Pekka – from December 25, 2012 at 3:49 pm
Sorry that your comment got trapped by the spam filter. I only just found it and resurrected it.
As stated in Comments & Moderation
SoD,
I tried to figure out what could have been the bad word in that message, but couldn’t find anything. I tried several times and also through different routes. I did that to be sure that the problem was in the text and not due to some other cause. I sent you a email message and then gave up as the message started to get a bit outdated as well. The message was also directed more to you than others as it was a response to one of your comments without much additional information.
It has happened several times that my messages end up in moderation giving a response that tells of that but this was the first time it just disappeared. The reasons for ending up in moderation have not been obvious either, WordPress seems to be unnecessarily aggressive in many cases.
Pekka,
The good news about having WordPress host the blog is it takes away all the pain from me and it handles spam and moderation mostly very well.
The main reason they can do that is they host like a million blogs so spam is easier to identify.
The bad side is they have a number of false positives.
For a while Frank’s posts always ended up in moderation for no reason I could see and now a few of yours. It is most likely that it is related to a combination of factors including your IP address, perhaps a spammer has been operating from an adjacent IP.
If the blog tells you your post is in moderation then I will get an email. If it disappears then the spam filter has grabbed it and I will never know unless someone emails me, or I happen to trawl through pages of spam comments looking for a real one.
suricat wrote on December 29, 2012 at 5:12 am:
Fascinating commentary.
How many papers do you read and what subjects do you search for?
How would your viewpoint be falsified?
What about the continual stream of papers in the theme of Axisymmetric, nearly inviscid circulations in non-condensing radiative-convective atmospheres, Caballero, Pierrehumbert and Mitchell, Q. J. R. Meteorol. Soc. (2008)?
You think no one is interested but I think you don’t know where to look. You find this in textbooks and in papers.
Well, if you want to uphold your vague claim I would like you to state what specifically you mean and what evidence would falsify your claim.
[…] « Clouds & Water Vapor – Part Five – Back of the envelope calcs from Pierrehumber… […]
[…] on the important tropical circulation is from solar heating over the warmest oceans (see Clouds & Water Vapor – Part Five – Back of the envelope calcs from Pierrehumbert). Radiative transfer is just one piece of the […]
Scienceofdoom: I have some questions please. In figure 5, I think I’ve found close to what I am looking for. In the figure I am seeing latent heat starting its journey and heading either North or South. I see it arriving in a dryer and colder area of the Earth and losing its heat, I see OLR going up there. So the latent heat is released and then if it doesn’t see anything to block it, or reaborb it, it leaves. But does some of it head in the direction of Earth’s surface as Longwave radiation too? Figure 5 is similar to a negative feedback situation such as a cars water cooling system, and you could say, I am looking for the negative feedbacks, so I might be seeing what I want to see. It’s my understanding that the water vapor here at issue is a greenhouse gas, the same one that makes Minnesota not a glacier at the current time. So my next question is, if we see more evaporation in the Tropics, more throughput in the diagram, what happens? Do this increase cause a buildup during the radiation (Earth losing heat energy) phase and then put the excess back near the surface? I’d imagine more water vapor in transit is a positive feedback bouncing Longwave Radiation back to Earth’s surface. I’d appreciate any time you have for this. I’ve being to picture what the Latent Heat is doing and where it’s Energy ends up for days now. I really liked the diagram. I guess I am a flowchart kind of learner.
[…] Part Five – Back of the envelope calcs from Pierrehumbert – focusing on a 1995 paper by Pierrehumbert to show some basics about circulation within the tropics and how the drier subsiding regions of the circulation contribute to cooling the tropics […]
[…] more realistic example is given by in Clouds & Water Vapor – Part Five – Back of the envelope calcs from Pierrehumbert which looks at regions of low humidity and high […]
“Large shallow-cloud decks, 1000s of km in extent, form over the eastern and central subtropical oceans, reflecting back to space a significant fraction of the incoming solar radiation (10 s of W m−2), much of which would have otherwise been absorbed by the ocean.
To a first approximation these cloud system dynamics can be considered as an atmospheric analogue to Rayleigh-Bénard (R-B) convection1. Heat from the lower, warmer plate (the ocean) is transferred by convection to the colder one (top of the marine atmospheric boundary layer – MBL). The R-B analogy is far from complete, e.g., because of the non-uniformity of the MBL2,3, cloud and rain formation, feedbacks related to phase transitions and radiative effects. Nevertheless it offers interesting physical intuition into the problem of state selection in marine cellular convection3.” https://www.nature.com/articles/srep02507
Bistable and nonlinear transitions between closed and open cells cause large variability in the global energy budget. Closed cells persist for longer over cool ocean surfaces before drizzling out to leave open cloud cells. Because these are low level clouds SW changes dominate in a positive feedback to SST. Pacific Ocean Hurst-Kolmogorov dynamics modulate global energy content over decades to millennium.
“Global mean (a) shortwave (SW) and longwave (LW) and (b) net top-of-atmosphere (TOA) flux anomalies for March 2000–September 2017 from CERES Energy Balanced and Filled (EBAF) Ed4.0. Thin lines denote monthly anomalies, thick lines are 12-month running means. Vertical black bars show the Multivariate ENSO Index (MEI). Anomalies are calculated relative to climatology over the entire period. SW and LW TOA flux anomalies are defined as positive upwards and net TOA flux anomalies are positive downwards.” https://www.mdpi.com/2225-1154/6/3/62/htm
See Koren 2017 – https://aip.scitation.org/doi/10.1063/1.4973593
This may be the subsystem most vulnerable to tipping point cascades in the Earth system.
e.g. https://www.nature.com/articles/s41561-019-0310-1