In a number of earlier articles we looked at onshore wind because it is currently the lowest cost method of generating renewable electricity.
The installed onshore wind capacity (nameplate) in Europe at the start of 2015 was 121 GW. By comparison the offshore wind capacity (nameplate) by comparison was 8 GW. (Both figures from EWEA).
For recap – “nameplate” means what a wind turbine will produce at full capacity. A typical onshore wind farm in Europe will produce something like 16-30% actual output over the course of the year. If you pick some great locations in Oklahoma, you might get over 40%. It all depends on the consistency and speed of the wind. The actual output as a percentage of the nameplate capacity is usually given the term “capacity factor”. This isn’t some big disadvantage of wind – ‘it “only” produces 30% of its supposed capacity‘ – on the contrary, it’s just terminology. But it is important to check what value you are seeing in press releases and articles – so when you see that Europe has 121 GW of onshore wind installed, it usually means “nameplate”. And so the actual production of electricity, depending on location, will be something like 25-50 GW averaged over the year. End of recap..
There are three big advantages of offshore wind. And these are the reasons why a lot of money is being poured into offshore wind in Europe:
- the intermittancy is lower – the wind blows more consistently
- the capacity factor is higher – you get more out of your turbine, because the offshore wind speed is higher
- they aren’t parked 300m from the houses of voters
In the last article XIV – Minimized Cost of 99.9% Renewable Study we saw an interesting point from one study – when storage costs were high (actually quite low, but higher than a “possible” super-low rental cost of storage from future owners of electric cars) the lowest cost method of building out the PJM network (eastern US) included a large portion of offshore wind.
This is the key to understanding the first major appeal of offshore. Intermittancy has a cost – something we will come back to again – that is a little difficult to quantify. You can smooth out the peaks and troughs by installing wind farms over a wide area, but you can’t eliminate the fact that at certain times in a given 10-year period there will be almost no wind for a week. Of course, it depends on the region, but so far even potential “super-grids” have a week’s down time (see XII – Windpower as Baseload and SuperGrids and also VIII – Transmission Costs And Outsourcing Renewable Generation)
Offshore gives you more consistent electricity production and less intermittancy.
The second point – more electricity on average from a given nameplate turbine – only helps when we consider the actual cost of different wind installations. Let’s say we put 1 GW of wind turbines onto land and these get a capacity factor of 25% – we get, on average, 250 MW. That is, across the year we get 2,190 GWh (0.25GW x 8760). Now we put 1 GW of nameplate offshore wind turbines into coastal water and we get a capacity factor of 40% on average – that is, 400 MW. So across the year we get 3,504 GWh (0.4 x 8760). This increased capacity factor only helps if the cost of installing the 1 GW of turbines offshore is less than 60% more expensive. Unfortunately, this is not the case (at the moment).
The third point is of great interest in Europe. Germany, Spain, the UK and Ireland have been installing a lot of onshore wind turbines. These are highly populated countries. For a later article, producing say 50% of each of these country’s electricity requires a lot of land area. Of course, the footprint on the actual land is quite small, but each turbine has to be some distance from every other turbine. This means that producing 15 GW of electricity from wind in the UK (about half of the average) would take up a lot of land area. The problem is more acute in Germany with a lower capacity factor.
So, those are the upsides. Now let’s look at the price tag. “If you have to ask, you can’t afford it..”
In an earlier article – IX – Onshore Wind Costs – we looked at the capex cost of onshore wind and (by the time we get into the comments) we find a current capital cost of about €1M per 1MW of (nameplate) capacity. There are lots of different numbers cited, but let’s use that for now. For people more familiar with the greenback, this is about US$1.2M per 1MW.
EWEA gives a current price tag for capex cost of offshore of €2.8 – €4.0M per 1MW of (nameplate) capacity. A larger proportion of the capital cost of offshore is the installation.
Remember that we have to factor in the “capacity factor”. So the capital cost of offshore is not 3-4x the onshore cost. If we calculate the cost based on the actual production of electricity then onshore costs (capex) something like €4M per 1MW of output and offshore costs (capex) something like €7-8M per 1MW – roughly double.
Now, we can be relatively sure of capital costs because there are enough datapoints and current installations. Governments publish figures when they are paying. Suppliers give out indicative pricing. Customers give out data on contracts.
But there are big questions about maintenance costs and, unlike onshore wind with a lot of data, this is still a little shrouded in mystery. I’ve consulted a lot of sources but it seems that, with only 9GW of offshore wind constructed in Europe – and much of this very recent – there is not enough public data to confirm any estimates.
One point only is clear (as you might expect) it is “quite a bit more” than the maintenance costs of onshore wind. The marine environment impacting on the equipment combined with the hazards of getting maintenance people out on the ocean.
So far it seems that offshore has some maintenance issues that are hard to cost up. It’s an industry still in its infancy.
Of course, to get more funding, many confident predictions are made: “Offshore wind will be cheaper than gas plants by 2020.”
Without confident predictions, maybe no one will fund the next 5 years of development. I don’t want to delve any deeper into spruiking. Let’s just accept that most of what passes for discussion in the general media, repeated on many blogs, is simply press releases from governments, lobby groups and big companies, mostly repeated without any fact checking.
It’s quite possible that offshore wind will be much lower in 2020 than it is today. There are a lot of installation issues that might be improved with the combination of volume of installations, time on the job and engineering improvements. It’s also quite possible that offshore wind won’t be a lot lower in 2020 than it is today. (See points made in Renewable Energy I).
Here is IRENA for just 2 years:
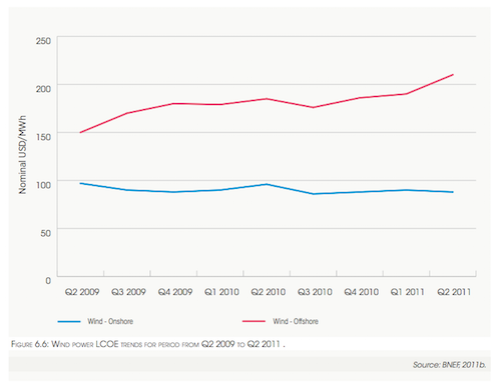
From IRENA 2012
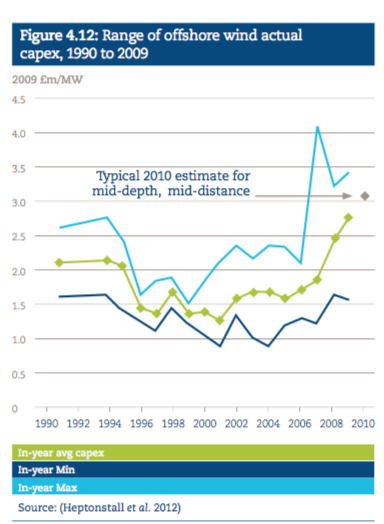
And UKERC Offshore costs from a 2012 document:
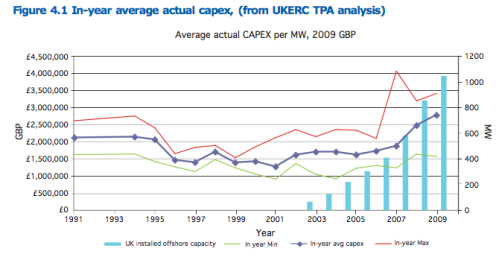
From UKERC 2012
And another from a different UKERC document, attempting to learn from experience, with reference to wind power cost projections vs how the world actually turned out:
In the short-term costs may rise before they can fall. Cost reductions from learning can be overwhelmed in the short-term by supply chain bottlenecks, build delays and ‘teething trouble’, for example lower than expected reliability at first. There is historical precedent for technologies deployed in the power sector to demonstrate cost increases during early commercialisation before supply chains and learning from experience are firmly established
From UKERC 2013
These graphs are only presented as a reminder that predictions don’t always come true. Engineering problems are hard and optimism is easy.
I’m sure offshore wind costs will come down in the long run, but as Keynes usefully reminded us, in the long run we are all dead. So “the long run” is not so useful. Whether offshore costs will come down to onshore costs in a reasonable time frame, and whether – in this time frame – they will further come down to the cost of gas turbine electricity production is open to question. Time will tell.
I’m generally an optimist. The glass is half full. Probably it’s almost full. And lots of people don’t have much, so my glass is anyway pretty amazing. It’s only the weight of blog world articles and media (lobby groups press releases) articles on this subject that compels me to remind readers that confident predictions of the future may not be correct.
Lots of sources quote LCOE (levelized cost of electricity) – this “adds” capital cost, factored by the cost of capital (interest rates), to maintenance costs and energy costs (when we consider conventional power stations with fuel costs). As explained in previous articles, this LCOE is not so useful (i.e., it’s misleading) when we consider intermittent renewables vs dispatchable conventional electricity.
As a rule of thumb consider offshore capex wind costs to be “about double” onshore wind costs, and offshore maintenance costs to be somewhat unknown, but definitely higher than onshore costs.
These rules of thumb are as much as I have been able to establish so far.
References
Wind in Power 2014 European Statistics, published February 2015 by European Wind Energy Association (EWEA)
Renewable Energy Technologies: Cost Analysis Series, Volume 1: Power Sector, Issue 5/5, Wind Power, IRENA (International Renewable Energy Agency), June 2012
Presenting the Future: An assessment of future costs estimation methodologies in the electricity generation sector, UKERC (2013)
UKERC Technology and Policy Assessment, Cost Methodologies Project: Offshore Wind Case Study, UKERC (2012)
Articles in this Series
Renewable Energy I – Introduction
Renewables II – Solar and Free Lunches – Solar power
Renewables III – US Grid Operators’ Opinions – The grid operators’ concerns
Renewables IV – Wind, Forecast Horizon & Backups – Some more detail about wind power – what do we do when the wind goes on vacation
Renewables V – Grid Stability As Wind Power Penetration Increases
Renewables VI – Report says.. 100% Renewables by 2030 or 2050
Renewables VII – Feasibility and Reality – Geothermal example
Renewables VIII – Transmission Costs And Outsourcing Renewable Generation
Renewables IX – Onshore Wind Costs
Renewables X – Nationalism vs Inter-Nationalism
Renewables XI – Cost of Gas Plants vs Wind Farms
Renewables XII – Windpower as Baseload and SuperGrids
Renewables XIII – One of Wind’s Hidden Costs
Renewables XIV – Minimized Cost of 99.9% Renewable Study
Renewables XV – Offshore Wind Costs
Renewables XVI – JP Morgan advises
Renewables XVII – Demand Management 1
Renewables XVIII – Demand Management & Levelized Cost
Renewables XIX – Behind the Executive Summary and Reality vs Dreams


Thanks for another informative post. If you are not already familiar with it, you might find the history of Cape Wind (a proposed offshore wind farm on Cape Cod in Massachusetts, USA). After securing permits, and waging a long legal struggle against local opposition (more than a decade!) the project was finally abandoned when the company could not show investment banks that they had secured the agreed upon minimum capital investment; the banks abandoned ship and that was that. My guess is investors looked at the cost and realized the project was dot viable, even with heavy subsidies. This wind farm would have spoiled the ocean view from the Kennedy compound in Hyannis….. and lots of other people’s views as well. Unless the turbines are so far off shore the turbines are not visible, off shore wind is going to face a lot of NIMBY resistance… from rich people who own water front property.
SOD wrote: “Intermittancy has a cost – something we will come back to again – that is a little difficult to quantify. You can smooth out the peaks and troughs by installing wind farms over a wide area, but you can’t eliminate the fact that at certain times in a given 10-year period there will be almost no wind for a week. Of course, it depends on the region, but so far even potential “super-grids” have a week’s down time.”
I haven’t seen nformation needed to understand or calculate the cost of intermittency. For example, you say that even super-grids have a week’s down time. How does one define “down time”? Less than average output? Less than 30% of nameplate capacity? Based on the overbuilding of nameplate capacity recommended by Budischak et al, I might define downtime for wind as output below 10% or 12.5% of nameplate capacity or perhaps output averaged over 12 h less than 5% or 6% of nameplate capacity. These are the times when grids with a shortage of dispatchable power will be forced will rely on expensive stored power.
One could look at a history of power output from wind, pick any “required output” (say 10% of nameplate capacity) and calculate the cumulative deficient that builds up during all calm periods. Storage capacity equal to the size of the largest cumulative deficit would produce a reliable supply of power equal to 10% of nameplate capacity. One could also check the surplus generation above “desired output” immediately before periods of low output to demonstrate that a storage capacity equal to the deficit would be completely filled when the deficit began. Eventually one could create a plot of “required output” vs storage required for reliability. The cost of reliably delivering the “required output” would be the expenses associated all of the wind farms connecting to the grid plus the cost of storage.
Have you or anyone else seen wind output analyzed in this manner? If not, where can one find data from wind farms spread over a wide area.
Frank,
My “downtime” comment didn’t have any technical aspects to it – it was to paint a picture. It’s important to note that this “downtime” is not zero and this “not zero but pretty low” output for many days is important.
One common way of looking at the output of a generating unit is like this (shown in XII – Windpower as Baseload and SuperGrids):
– where the output is plotted from the highest to the lowest, rather than as a time series.
This gives one perspective.
The other way of considering it is the capacity credit (not capacity factor) that it is assigned, as a result of its ability to contribute to the reliability of the network – in the period of most demand, for the given Loss of Load Probability that is desired. This was explained a little in Part I.
Then finally we have the time-series which demonstrates the capacity credit “problem” in a clearer way (clearer to me anyway).
It’s out there, but I haven’t looked. I have seen multiple posts from different people giving the output of various wind farms, using data taken from various grid operators in Europe.
SOD: Thanks for the links to information in your earlier posts. It seems to me that the Generation Duration Plots and Capacity Credit are useful for grids that have enough dispatchable power to meet demand almost all of the time. However, there are stories going around that retirement of coal plants in Great Britain is about too or already has made it impossible to meet peak demand during calm periods in the winter. In that case, reliable renewable power requires storage. Budischak’s 30% renewable option included keeping fossil fuel plants online capable of meeting about 50% of demand AND adding storage. Generation Duration Plots don’t tell one how much storage is needed.
The plots that show how capacity credit in Part I don’t make a lot of sense to me. The top one has 0.5 GW of wind – negligible. So we have a gird where fossil fuel plants can’t always meet demand; they are about 2 GW short in the worst case scenario. With an addition of 25 GW of wind and a loss of 4 GW of fossil fuel, I’m supposed to believe the probability of a shortage is remaining the same, but the maximum shortfall is now 5 GW – a much worse shortage than before.
SoD,
“This is the key to understanding the first major appeal of offshore. Intermittancy has a cost – something we will come back to again – that is a little difficult to quantify.”
I have a suggestion as to how this can be done.
As wind penetration increases, its capacity factor decreases due to the fact that there will be times when there is no where to send the power. In the limit of trying to get all power from wind, the capacity factor becomes equal to the capacity credit. This is essentially Budishak’s result that you discussed in Part XIV. Overbuilding by a factor of 3 with a nominal capacity factor of 33% gives an actual capacity factor of 11%; that is consistent with other estimates that I have seen for capacity credit.
I suggest that a sensible way to account for intermittancy is to do the LCOE calculation using the capacity credit in place of the capacity factor. If the objective is to substantially replace fossil fuels, rather than nibbling at the edges, then we should evaluate cost based on the objective, not the first step. Even for small amounts of wind, doing the calculation this way allows for the “hidden cost” that results from the reduction of conventional power capacity factors when wind is introduced. Or, if you prefer, the need to maintain unused conventional capacity as “backup” for wind.
SoD,
As further evidence in favor of using capacity credit in LCOE calculations, consider the case of combustion turbine peaking plants. If you do the LCOE calculation using a realistic capacity factor (often less than 10%, I think) the cost is extremely high. Even with the often used, but inflated, capacity factor of 30% the LCOE is quite high. But such plants are an essential part of the grid. Their value is not the actually power they produce but the power they *could* produce when the grid needs it. So a better representation of the value would be given by using the capacity credit instead of the capacity factor in the LCOE calculation. I suspect that the nominal 30% often used is some sort of a compromise value.
“…and whether – in this time frame – they will further come down to the cost of gas turbine electricity production is open to question. Time will tell.”
I wonder how long it will be an interesting question. Does it really matter if RE is more ‘expensive’ than FF energy? The cost of gas turbines doesn’t include the cost of more [CO2].
Estimates of business-as usual adaptation by year 2100 alone are between $500 trillion and $1240 trillion dollars – and nobody uses those figures to calculate carbon taxes, not even close. $750 trillion pays for the marginal cost of all the RE we could ever need.
If you believe those estimates, I have this bridge in New York for sale.
How about some citations for those numbers? Whatever the source, you owe people the chance to critically evaluate the source. Unsourced, unexplained claims are without value.
$1240 trillion:
http://thinkprogress.org/climate/2013/03/10/1696521/flashback-scientists-find-1240-trillion-in-climate-impacts-on-current-co2-path-so-we-must-mitigate-to-under-450-ppm/
$500 trillion: (actually not the study I am think of, but can not find)
http://www.ibtimes.com/climate-change-could-cost-world-over-half-trillion-dollars-year-2050-un-report-1737524
Those are guesses based on worst case scenarios that are extremely unlikely to happen. A “2050 mock weather” report? You can’t be serious. Climate models can’t do that. They have zero regional skill. So that isn’t science, it’s propaganda.
The one thing I guarantee you won’t come out of Paris is a binding commitment to a transfer of $100 billion/year to the developing and less developed world for adaptation to climate change.
Well, DeWitt
I guess we can take your word for it, or look at the published study led by the former co-chair of the IPCC. Hmmm… decisions, decisions.
I would be interested in your analysis of aweo.org, in particular, aweo.org/windconsumption.html
It would be quite interesting to compare the cumulated energy and CO2 costs (for engineering, installation, fuel costs, maintenance, dismantling, recycling) of an offshore grid (able to compete in production) with e.g. a gas plant assumed to have a life duration of say 50 years.
In Germany we have some raw data concerning offshore’s average output (for example, the prototype Alpha Ventus produces nearly constantly 250 GWh/yr out of 60 MW since 2011, i.e. with an output near 46%). Thus assuming an average of 40% for a bigger installation wouldn’t be bad.
Assuming at the gas side a plant with 1 GWel, and an output factor of say 80%, means that we would need
– a grid of at least 360 offshore units to compete with the gas plant’s energy production of about 7 TWh/yr;
– a storage facility to bypass longer intermittance phases (evaluated cost: about 1 € / kWh, see e.g. http://www.heindl-energy.com/).
That’s the simpler part of the job. The rest: to compare the energy and emission balances over the two installations’ full life cycles, is actually a rather hazardous calculation, as we do not have yet exact data concerning the duration of the different offshore components.
It’s time to have such data, as by the end of 2015 we will have in Germany 3 GW of installed offshore, and about 44 are planned to be by the end of 2020.
I would like to suggest a variation on offshore wind. There appears to be a lot of work being done on making diesel and jet fuel from sea water. Make and collect this fuel near the off shore wind turbines. This might offer a number of advantages.
1.) Gas turbines in power plants are basically jet engines and could probably also run on jet fuel. I have read about ones that can use both. This solves wind’s intermittency problem.
2.) It should be carbon neutral. CO2 put into the environment (the air) is taken out of the environment (the sea, where it can then absorb more from the air).
3.) It would not require transmission lines.
4.) 3 above means they could be put in more remote locations.
5.) 4 above means they don’t have to be where people see them. Perhaps it would be cheaper to make them with ugly trusses and guy wires, rather than sleek tubes.
6.) It would not have to be synced with the grid. It could be optimized for the fuel making apparatus.
7.) The ships that collect this fuel might be able to supply concentrated CO2 that has been captured.
I’ll confess that I’m too lazy and probably not competent to make a decent quantitative analysis, but I think this is something that might be worth considering.
Canman,
“There appears to be a lot of work being done on making diesel and jet fuel from sea water.”
Do you have a source for this? I’d be very interested in the proposed approach, if only because it is likely to involve some cool chemistry.
Offhand, I see two likely problems. One is that it is probable that none of the approaches is close to being practical, so that such schemes are at the research stage and can not be used for planning. The second is that the plant will require a large capital investment. That means that the owners would need it to run as near to 100% capacity as possible, thus bringing us right back to the intermittency problem.
Mike M.
See this: http://www.smithsonianmag.com/innovation/fuel-seawater-whats-catch-180953623/?no-ist
Canman,
The process you refer to is endothermic. It requires energy and lots of it. Generating hydrogen electrolytically is inefficient. Converting CO2 and hydrogen to fuel is inefficient. The efficiency of using wind turbines to generate the needed power, make the fuel, transport it back to land and use it to run an electric power plant is going to be very low compared to transmitting the electricity directly. And that’s not to mention the extra cost of building and maintaining an offshore gas to liquid plant.
My experience working both offshore and onshore projects tells me the wind turbine opex will be very large and will lead to excessive “mechanical” downtime (this is over and beyond intermittency) due to the difficulty involved in accessing equipment in bad weather.
I theorize costs would drop if designs are modified to account for offshore conditions, and the maintenance vessel fleet is built specifically to service wind turbines. But this effort could take 10 to 20 years. Right now, rather than betting on offshore wind Europe should embark on a crash program to pilot new nuclear reactor designs so they can be built in large numbers in say 15 years. The U.K. can develop an intermediate cross over step importing LNG from the USA and electricity from the continent to avoid an energy crisis.
[…] electricity prices annual range was between 2.1 cents per kW-hr and 12.1 cents per kW-hr. Another analysis of offshore wind concluded as a rule of thumb “offshore wind capex wind costs to be about double onshore wind […]
[…] the cost to procure land-based renewables in the State.” The Science of Doom blog evaluated the costs of offshore wind and concluded that “As a rule of thumb consider offshore capex wind costs to be “about […]
In today’s (11/18/2018) Wall Street Journal there was a piece on Dominion Energy’s plan to build a demonstration project consisting of two (count them, two) offshore wind turbines with a total capacity, presumably nameplate, of 12MW. The planned cost is $300 million. The ratepayers will bear all the costs and risks. The plan was approved by the Virginia State Corporation Commission somewhat under protest. They issued a scathing report, but decided they had to approve the project because of a state law creating an objective of 5,000MW of solar and wind power by 2028. It isn’t just California.
https://www.wsj.com/articles/a-green-logrolling-classic-1542579487?mod=searchresults&page=1&pos=1