With the big growth, or planned growth, in wind and solar in many countries you need to connect up new windfarms and solar arrays with people. This requires power transmission lines.
Electricity grids also have to match supply and demand on a second by second basis. This presents a problem, especially with renewables like wind or solar which may produce 1 GW during a sunny windy day and 0.01 GW during a calm night.
One solution put forward is “affordable storage capacity”. Let’s say for now, along with everyone (serious) writing reports, papers and feasibility studies, that there is no “affordable storage capacity”, except for hydroelectric storage, which is mostly “tapped out” in developed countries. There might be – via some as yet unknown technology breakthrough – but until then storage isn’t an option. If this happens – problem solved – and the world has a major breakthrough.
So we need baseload supply for times when intermittent renewable supply is not available (at the moment this requires a conventional power plant, as we saw in earlier sections, e.g. Part IV)
Or maybe not.
Perhaps instead we can put massive solar arrays in Arizona, massive windfarms in South Dakota, more massive solar arrays in Libya and connect up the supply to Germany, or any country that wants to transform its electricity supply into renewable energy.
Kind of a massive outsourcing exercise. After all, why put solar arrays in Germany when there is so little sun? Why put windfarms in Germany when it really doesn’t have that much wind? Why not put up windfarms in places with lots and lots of wind and not many people, and solar into places with the highest solar insolation and not many people?
All you need is to connect them up with transmission lines. Not very difficult. Not a technical challenge at all. As one commenter said in an earlier article “An Atlantic interconnector may sound fanciful, but a UK Norway link is a live project, and an Iceland project is under feasibility.”
So, it’s clear, we can get power from A (source) to B (population). It’s just a piece of wire.
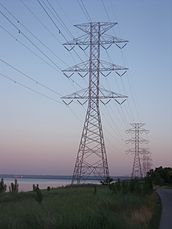
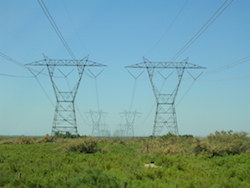
But what does it cost? That’s the real question. Generally the answer is “pricey”. Because it’s very substantial pieces of heavy wire with large support structures to get it from A to B, and massive transformers or large banks of thyristors.
In one paper (Osmani et al 2013) I read the costs of building new transmission were quoted as $/kWh. Yes, a paper with a sense of humor..
Think of building a railroad. Your cost depends on the terrain, cost of material, and cost of contractors. And very important: the length – whether you are running from Washington DC to Richmond, Virginia or from Portland, Oregon to Fort Lauderdale, Florida. At the end you’ve built the railroad. If one person a day or 10,000 a day travels the railroad the cost invested will still be the same. So quoting $/passenger isn’t exactly useful for an overall idea of what it costs to build a railroad. Better to quote $/mile for construction across a few different terrains and let everyone else do the maths for different passenger numbers.
Quoting $/kWh for power transmission is about as useful as saying the average cost of a journey = $7.46, when averaging domestic & international plane flights, train & bus journeys, dinner with friends, and all those trips to the local 7-11.
Transmission Basics
There are two options with transmitting lots of power – a.c. (alternating current) or d.c. (direct current). AC is what you have in your homes, it is what is supplied by the grid, and it is how most power is moved around.
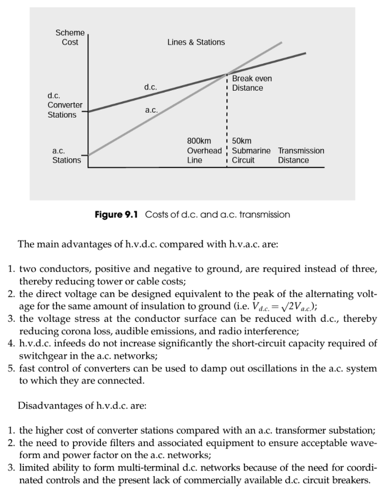
Once you get past a certain distance, DC is a lower cost option. The “break-even point” is always changing but in essence the actual transmission costs are always less with DC, but the conversion costs (from AC to DC and back to AC at the other end) are significant.
The crossover point is around 800km for overhead lines, and 50km for subseas lines (Electric Power Systems, Weedy et al, 2012 – and see extract for more details in note 1).
There is another important point – if you just want to get power from say Innamincka in central Australia to Melbourne, Australia (see Part VII where we looked at the failure, so far, to obtain power from 4km deep geothermal sources) then HVDC is a good choice. But if you want to add in the power from lots of wind farms or solar arrays on the way, then all those conversion stations will start to cost and using AC transmission would be better:
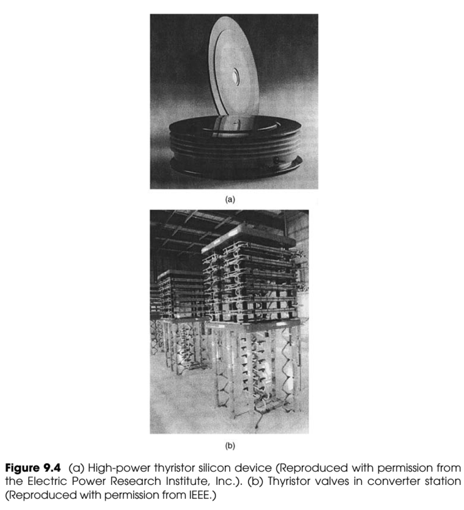
Figure 1 – Thyristor (top) and Thyristor Bank for AC-HVDC conversion (bottom) – these babies ain’t cheap
Cost Data
Finding quality data on transmission costs is not so easy. The people who really know are in companies that provide these construction services and their data is confidential, like any business.
For example, if you want to find out what an LNG plant costs you might be able to dig through some annual reports of a few customers of LNG plants and see their capex costs revealed in expenses lines or in notes/discussion, but then you wonder why one plant of the same capacity was 20% more than the other. Maybe one of them negotiated a better deal with Bechtel. Maybe one customer provided some of the key services themselves and that reduced the price. Maybe another customer insisted on a given subcontractor or technology because of their view on the long term O&M costs and that increased the price. Maybe Bechtel was stretched on the last plant and gave a higher price and the customer didn’t have a better EPC to build it.
Onto power transmission costs which has similar challenges for the outside observer.
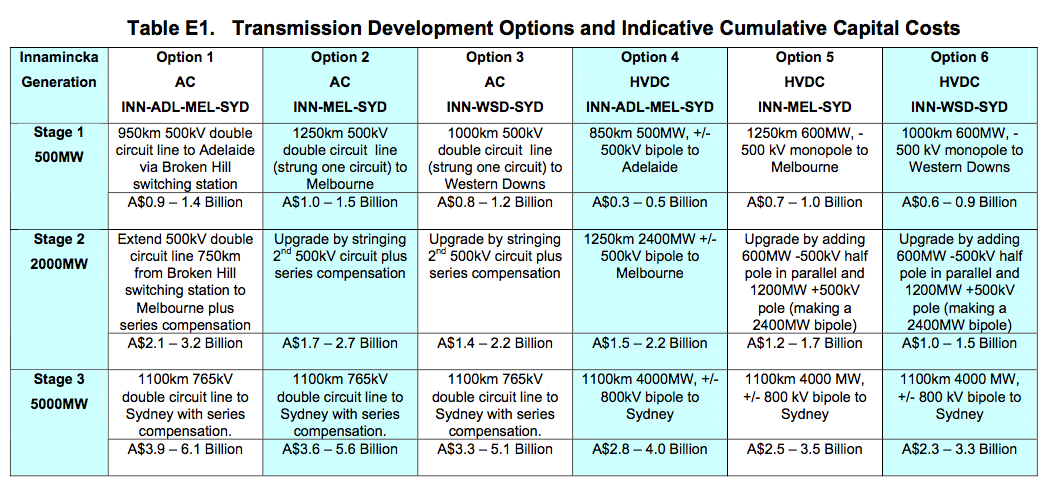
In reviewing the AEMO report for Renewables VI – Report says.. 100% Renewables by 2030 or 2050 – I found a link to a transmission costing report – Network Extensions to Remote Areas Part 2 – Innamincka Case Study – which was very useful (I have lost the link where I downloaded this report, I can email the pdf report to anyone interested). This looked at the cost of power transmission from a possible geothermal source in central Australia to a few population centers.
The costs are given in Australian Dollars, but the report was 2009 and the conversion from the greenback was at US$1 = A$1.20 so the costs are basically similar in US$, given the lack of hard data, changes in costs of various materials, and so on.
My summary of their table, followed by the table itself:
- AC transmission of 5GW – 1000 km (620 miles), 765kV double circuit line with series compensation – $3.3 BN to $5.1 BN
- as above but with two cities as stop off points – $3.9 BN to $6.1 BN
- DC transmission of 4GW – 1100km (680 miles), +/- 800 kV bipole – $2.5 BN to $3.5 BN
Click to expand
The report states:
Note that this study has not taken into account the following routing considerations which could add to the cost of the transmission options :
- a) Excessive wind and ice loading (the study assumed moderate winds with no allowance for cyclonic conditions and no ice loading)
- b) Minimization of visual impact
- c) Complexity of terrain
The indicative costs in this report exclude :
- a) Allowance for difficult terrain such as forested, hilly ,or mountainous
- b) Costs for access roads
- c) Statutory compliance costs
- d) Consenting costs
- e) Allowance for project scope accuracy
- f) Price contingency for exchange rate variation, manufacturing market pressures, and price of materials
- g) Interest During Construction
- h) Operating and maintenance costs
- i) Cost of losses
For example, if this was Europe or most parts of the US you would need to add “a lot” (maybe 25%) for additional costs to support the ice loading. If you have to consider very high wind conditions – that’s more cash. If you need to go through cities or over mountains, add “a lot more”.
So from this report, as a rule of thumb, think $1BN per 1GW per 1000km as the likely minimum. From the scaling in their calculations increasing the power by a factor of 10 increases the HVDC costs by a factor of around 4, but I can’t say whether that holds true if you want to increase by another factor of 10 (they weren’t trying to design for 10x the power).
If you live in a country which has an environmental lobby with political power then you can add “even more” due to costs of ensuring the lesser-spotted green frog is not at risk when putting up the necessary support structures:
If you want to ensure that a tower coming down doesn’t bring down the power transmission then you need two of the above for the whole journey, adding “a lot” to costs:
The cost of land access can be high, depending on the country and the right of easements given to utilities.
In future articles we will try to find other pricing points to see how this compares.
These costs also worked on the basis of keeping the losses below 10% for the 1000km distance. If you want to reduce losses then you need to spend more – bigger conductors (more cash), stronger support structures to support these heavier conductors (more cash).
Route 66 and Relocation Relocation
The US used 4,500,000 GWh of electricity in 2011 (Osmani et al 2013). This equates to an average (but not a peak) of just over 500 GW.
So if we wanted to bring 50GW of solar power from Arizona to the North East then we are looking at a distance of something like 3,500km and a cost (assuming the scaling holds from the report) of $100 BN, plus all the exclusions listed above. Maybe with economies of scale this might be $50BN, on the other hand it might be $300BN.
I’m just trying to some perspective on the order of magnitude of the costs.
And for this distance, at the efficiencies noted, this would include a loss of at least 35% of the source energy. So multiply the cost of 50GW of solar in Arizona x 1.5 to cover the losses. And don’t forget to increase the AC-HVDC conversion costs at the source end by 1.5 – and so on. (Depending on the relative costs, it might be more cost-effective to spend less on solar arrays and more on transmission).
If we have distributed wind farms through the midwest and solar arrays in the southwest and we want to take that power around the country it’s clearly going to be a lot more. It all depends on the amount of power, the number of feed-in points, the number of extraction points, the distance, the terrain.. To do this we would probably have a mix of DC and AC lines. If the whole network was AC the cost might double.
We can see that locally-produced power has a large benefit over long-distance power. Moving, or outsourcing, power production has a significant price tag and a significant power loss.
Still, it’s a price point. When we have some approximate costs and efficiencies of local wind and solar production we can see whether the transmission costs justify the relocation.
Maybe someone has already done a detailed cost analysis of a “massive inter-state power transmission” project.
Articles in this Series
Renewable Energy I – Introduction
Renewables II – Solar and Free Lunches – Solar power
Renewables III – US Grid Operators’ Opinions – The grid operators’ concerns
Renewables IV – Wind, Forecast Horizon & Backups – Some more detail about wind power – what do we do when the wind goes on vacation
Renewables V – Grid Stability As Wind Power Penetration Increases
Renewables VI – Report says.. 100% Renewables by 2030 or 2050
Renewables VII – Feasibility and Reality – Geothermal example
Renewables VIII – Transmission Costs And Outsourcing Renewable Generation
Renewables IX – Onshore Wind Costs
Renewables X – Nationalism vs Inter-Nationalism
Renewables XI – Cost of Gas Plants vs Wind Farms
Renewables XII – Windpower as Baseload and SuperGrids
Renewables XIII – One of Wind’s Hidden Costs
Renewables XIV – Minimized Cost of 99.9% Renewable Study
Renewables XV – Offshore Wind Costs
Renewables XVI – JP Morgan advises
Renewables XVII – Demand Management 1
Renewables XVIII – Demand Management & Levelized Cost
Renewables XIX – Behind the Executive Summary and Reality vs Dreams
References
Electricity generation from renewables in the United States: Resource potential, current usage, technical status, challenges, strategies, policies, and future directions, Atif Osmani et al, Renewable and Sustainable Energy Reviews (2013) – paywall paper
Electric Power Systems, John Wiley & Sons Ltd, Weedy et al, 5th edition (2012) – textbook
Network Extensions to Remote Areas Part 2 – Innamincka Case Study, by Power Systems Consultants Australia Pty Ltd, for Australian Energy Market Operator Ltd, 2009
Notes
Note 1: Electric Power Systems, 5th edition (2012) has a good summary on AC vs DC:


For keeeerist’s sake, talk to an engineer and look at the numbers. you’d have to cover every square inch of desert in the southwest just to power Phoenix and half of Los Angeles.
>
chuckwilk,
Let’s just consider “every square inch” of Arizona to get an order of magnitude estimate..
Area of Arizona = 114,000 miles2 = 295,000 km2 = 3×10¹¹m2.
Solar insolation in Arizona averages around 6 kWh/m2/day if you tilt at the best angle, or around 5 kWh/m2/day for a flat plate.
If you take current flat PV panels at 15% efficiency and “covering every square inch” (this obviously isn’t possible) then you get:
Annual average output = 3×10¹¹ (area) x 5 kWh x 365 days x 0.15 (efficiency) = 8.1×10¹³kWh per year.
Let’s convert to GWh per year because we know that US energy consumption per year = 4,500,000 GWh per year.
Annual output from 100% Arizona flat PV cells = 81,000,000 GWh per year (=8.1×10¹³kWh/106).
So assuming, for sake of argument, a crazy idea that I haven’t said is practical, and “looking at the numbers” we get Arizona able to produce 18x the US electrical consumption.
It’s easy to make mistakes with maths so can you “talk to an engineer” and redo the calculations for me?
Using more realistic footprints, Osmani et al (reference in article) say:
Their reference is United States Congressional Research Service (CRS). Annual energy review; 2009.
“Solar insolation in Arizona averages around 6 kWh/m2/day”
Are you sure that’s right? That comes to .07 watts per square meter. (6000Wh/24 hrs.)/3600 secs. = .07 W.
Carriba,
The maths is pretty simple.
1 kWh is a unit of energy, which could be 1 kW of power running for 1 hour, or 500W for 2 hours, or 2 kW of power for 1/2 hour.
Or any other combination of (power in kW) x (time in hours) = 1.
So 6 kWh in one day (over a unit area) averages to be 6 kWh / 24 hours = 6000/24 = 250 W average (over this unit area).
Your mistake was dividing by 3600. Your calculation would be correct if our unit of energy was in “kWs” – “kilowatt seconds”.
You can see this result is reasonable (250W per m2), because the surface solar radiation when the sun is directly overhead on a cloudless day is around 1000 W/m2. Half of the 24 hours is night so there is zero and obviously just after sunrise the value is pretty low, peaking at around 1000 and then going back to near zero in the late evening.
There are plenty of websites – like this NREL site – which give you the average over a long period from actual recorded values at given locations – because the actual value depends on clouds.
“we know that US energy consumption per year = 4,500,000 GWh per year.”
This number can’t be right. There are around 115,000,000 households. That’s .04 gwh per household per year or 40,000 kwh per household per year. Each household would be limited to a 1.25 W light bulb. 40,000 kwh/365 days/24 hrs./3600 secs.
Thanks! I was pulling my hear out trying to make sense of the numbers. I should not have divided by 3600.
Based on your estimates above, it looks like the cost of supplying solar energy to meet current U.S. consumption would be about 2.5 trillion. I’m basing that figure on a quote of $4000 per 800W of power. That seems like a good deal. Now all we have to do is get Arizona’s permission. lol.
Carriba,
If you take solar with storage for overnight consumption (CST) you might be 3x – 4x the price of PV solar (I haven’t checked your costs). If you don’t, then what to do at night? And not every single day is sunny in Arizona, so you might spend even more for storage.
Carriba,
“the cost of supplying solar energy to meet current U.S. consumption would be about 2.5 trillion. I’m basing that figure on a quote of $4000 per 800W of power”
I find $5/W hard to believe. I think $2 per peak watt is about right for a complete installation, so that would be $10 to $15 per average watt. Plus the cost of storage. Plus backup for when the sun don’t shine. Not a good deal.
So, just to be clear, I posted that as an interesting development in interconnected grids, not remotely intending it to be taken as an argument that it demonstrated that the problem was solved, and certainly not that an Atlantic interconnector was an economic proposition.
In general I have two frustrations with the debate over energy provision:
Firstly the assumption by advocates of fossil fuel exploitation that “sustainability” is an optional, nice to have. It isn’t; by definition any system not sustainable cannot be sustained and *will* change.
Secondly, the assumption by renewables advocates that warm words about sun and wind will keep the lights on.
Different people may define sustainability in different ways, of course.
Keep up the good work.
SoD,
Thanks for another informative post. I think at least some electric utility companies do break down costs so that transmission/distribution costs are visible. I don’t know if the cost structure is sufficiently detailed to get good estimates for transmission alone. I would guess that funding long distance transmission of “renewable” power would be impossible unless fossil fuel generation is heavily taxed to make the “renewable” power more competitive, or fossil fuel use is simply prohibited by law (the approach Mr. Obama has clearly taken). But those don’t solve the problem of intermittency/energy storage for solar and wind….. as the very tall guy alludes to.
Building a dedicated HVDC line for PV-solar alone is madness, either you have massive overcapacity most of the time or you need huge curtailment. No one in their right might is doing that. Something much smarter than that is needed, some form of storage (e.g. molten salt or pumped hydro in e.g. Hoover dam) or a combination solar with other generation methods (hydro/wind). This is how HVDC is employed in many places around the world, a few examples:
– The 580km 700 MW HVDC sub-sea NorNed cable between Norway and the Netherlands (operational in 2008) cost € 600 million and is built redundantly for about 50% of the total length. That’s € 1 million per km or, converted, €1.5 billion for 1 GW per 1000 km. The cable is operated commercially, it’s capacity rented to international traders, meaning that the exchange is based solely on price-differences between the Scandinavian market and the Dutch market and considered a huge commercial success. Usually it exports Norwegian hydro power during the day and exports Dutch power during the nighttime (coal/wind) with a ratio of about 10:1.
– The almost 1400 km Pacific Intertie 3100MW HVDC connection in California (2) operates similarly: sending mostly hydropower to Los Angeles and is said to lower the e-prices there, despite the obviously high cost of the transmission line.
– In 2010 a 2000 km UHVDC (800kV) line was commissioned in China (3), bringing hydro power from the mountainous west to Shanghai.
Just looking at the high construction cost of an HVDC connection alone is not enough to determine if it’s commercially viable or not. Apparently there are situations where even long connections (1000km+) are economically sound. At those longitudinal distances solar can even help negotiating morning or evening peaks simply because of the timezone difference.
Are those numbers for 400kV? According to ABB and Siemens, using the latest 800kV technology (4)(5), the cable-loss over 3000 km would be 8-10% (not 35%) and conversion losses would be <1% (not 50%).
1) https://en.wikipedia.org/wiki/NorNed
2) https://en.wikipedia.org/wiki/Pacific_DC_Intertie
3) https://en.wikipedia.org/wiki/Xiangjiaba%E2%80%93Shanghai_HVDC_system
4) https://www02.abb.com/global/abbzh/abbzh250.nsf/0/27c2fdbd96a879a4c12575ee00487a77/$file/HVDC+-+efficiency+and+reliability.pdf
5) http://www.energy.siemens.com/br/en/power-transmission/hvdc/hvdc-classic.htm#content=Benefits
ontspan
Let me explain.. the calculations in the AEMO report were aimed at keeping losses below 10%:
Basically the loss you experience in transmission is I2R. This is why higher and higher voltages are used as the power transmission requirements increase. Higher voltage means lower current and lower losses.
The other way to reduce loss is by reducing R. This means increasing the conductor sizes.
So for any given power transmission requirements (100MW, 1GW, 10GW) you can keep increasing the conductor size to reduce losses. There is no “right answer”. As you increase conductor size you reduce power loss but you increase the cost of the cables. And you need to support them, so you increase the cost of the structures.
What I was doing was not an optimization calculation – only someone with practical transmission line experience, current material costings and the right software could do that – I was just extrapolating from the 5GW result with losses limited to 10% over that 1000km distance.
I can’t see any reason why losses for 50GW & 3000km could not be limited to 10%, but this might double the cost – or maybe it only costs 10% more.
Last point, on the “50% increase” – to get 50GW output in the North East, with a 35% transmission loss, you need to boost output to 77GW. Then you have to ask, what is the cost of the AC to DC conversion for 77GW, not, what is the cost of AC to DC conversion for 50GW. Obviously there is an increase in cost to do this. It’s not about the conversion losses, it’s about the conversion costs.
I’m not trying in any way to produce “the right numbers” – I wish someone would come along and do that.
I’m just trying to estimate the order of magnitude costs – we can see that it’s unlikely to be “just a few billion” if we want to move substantial electricity from renewables around the country.
Agreed that line losses are variable based on how much copper/aluminum you want to use. Also note that prices partly depend on if you want to use a dedicated return line or simply a ground probe. The converter losses are more fixed and are less then 1%, as claimed by ABB/Siemens in the links I provided (these are the experts on this).
Obviously there is a high cost to building the infrastructure, but one point I tried to make is: there is a financial benefit too. In the case of solar this could be the time zone shift of PV-production and the expensive afternoon/evening peak. Take for instance New Mexico (which has excellent solar conditions) and Georgia with population 10 million (Atlanta alone is 5 million). The distance is roughly 3000 km and the sun-time difference at that distance is about 2 hours. With big solar PPA’s moving going towards $5ct/kWh there is some room for transmission cost.
http://www.austinmonitor.com/stories/2015/06/solar-prices-keep-dropping-says-austin-energy/
Click to access levelized_cost_of_energy_-_version_80.pdf
It would indeed be great if someone with inside information could provide options and ballpark prices on transmission.
It is interesting to note that we transport coal to fossil fuel power plants by train or ship and natural gas by pipeline or ship. The alternative is to build power plants near coal mines and natural gas fields and transport the electricity to customers via high voltage lines. Given the high cost of storing electrical power and transporting it long distances, could we convert renewable electricity that can’t be utilized locally into hydrogen gas (or methane or methanol using CO2 from the air?), transport it via pipeline to where it is needed, and convert it back to electricity near customers?
Fuel cells allow us to directly convert the chemical energy in some chemical bonds directly into electricity without combustion. Commercially available fuel cells convert methane to electricity with about the same efficiency (55%) as a combined cycle plant, but they operate at about 800 degC and are only commercially viable in locations like California where they are considered to be “renewable”. Fuel cells that rely on hydrogen may be more efficient. I wish I had a clearer understanding of the difference between energy stored in chemical bonds (made of electrons) and the electrical energy a flow of electrons that can be stored in a battery. Does a lithium battery store electrons around isolated lithium atoms or in Li-Li bonds? Do fuel cells make fossil fuels and hydrogen gas equivalent to a charged battery with oxygen gas as a sacrificial cathode and the fuel as a sacrificial anode?
Frank,
“could we convert renewable electricity that can’t be utilized locally into hydrogen gas (or methane or methanol using CO2 from the air?), transport it via pipeline to where it is needed, and convert it back to electricity near customers”
In principle. But electrolysis of water is expensive in both capital and energy costs (poor energy efficiency). Transporting H2 is difficult. Per unit energy, the volume of gas is more than three times that of methane, H2 is damaging to metals, and it is difficult to prevent leaks. Given a supply of CO2, H2 is easily converted to methanol, which opens up a lot of possibilities, but extracting CO2 from air is no easy feat. Given a source of carbon (coal, biomass, tar sands) and H2 one can make liquid fuels that contain much more energy per carbon atom than the starting material.
Lots of H2 is used in the petrochemical industry. It is made from methane since that is much cheaper than electrolysis.
I have not seen direct cost comparisons of fuel cells with other electricity sources, but I think that you are right about them not being economically competitive.
A breakthrough in making cheap, efficient electrodes for water hydrolysis would be really interesting. Use spare solar and wind power (or spare nuclear) to make H2 and use that to upgrade low grade fossil fuels. It would not be zero CO2 emission, but it would be a lot less than what we do now.
“Do fuel cells make fossil fuels and hydrogen gas equivalent to a charged battery with oxygen gas as a sacrificial cathode and the fuel as a sacrificial anode?”
That is an apt description. Pretty much any really energetic chemical reaction (and any electrochemical reaction) will be an oxidation-reduction reaction.
In a Li ion battery, lithium ions move between a graphite electrode and a metal oxide at the other electrode. When charged, electrons move into the graphite with Li ions entering the matrix to balance the charge; the metal ions in the oxide are in a high oxidation state with the positive charge balanced by the oxygen ions. When discharged, the electrons and Li ions leave the graphite and Li ions move into the oxide to replace the charge removed from the metal ions as they are reduced to a lower oxidation state. Neither the Li or oxygen ions change oxidation state.
A non-rechargeable Li battery uses metallic Li that is converted to ions as the battery discharges.
MikeM: Thanks for the reply, especially the info on Li batteries. (I thought lead and lithium batteries were both named for the species undergoing redox.)
Here is a link to Bloom Energy’s fuel cells that use natural gas to produce electricity. Their critics are easy to find.
https://en.wikipedia.org/wiki/Bloom_Energy_Server
It doesn’t help to make hydrogen from natural gas because CO2 is still released in the process of converting natural gas to useful energy. Fuel cells, however, liberate us from theoretical limits of heat engines and the problems associated with running such engines as hot as possible (including nitrogen oxides).
Frank and Mike M.,
That’s not quite correct about lithium ion batteries. Lithium is nominally reduced to Li(0) when the battery is charged, but not bulk metal. It’s intercalated into porous graphite, so some of the charge resides in the carbon substrate. The other electrode is a lithium salt of an oxidizable material, LiCoO2 for example The cobalt is oxidized from Co(III) to Co(IV) on charging. Since there is a change in charge, lithium ions diffuse out of the cobalt side on charging and into it on discharge. Lithium/sulfur batteries are currently the cutting edge of battery research but aren’t commercially available yet.
DeWitt Payne: “Lithium is nominally reduced to Li(0) when the battery is charged, but not bulk metal. It’s intercalated into porous graphite, so some of the charge resides in the carbon substrate.”
That sounds likely, although it is not the way I’ve seen it described. I suspect the difference is just one of terminology. With the negative charge partially on Li and partly on the graphite, it becomes a matter of convention as to whether one takes the nominal oxidation state of Li to be 0 or +1, so it might well be that different authors use different conventions.
I think you have to transfer an electron to the lithium ion before it can penetrate between the graphite layers and form an intercalation compound. In the compound itself, the lithium atom appears to have a positive charge. There is an isotope effect. 6Li is reduced preferentially to 7Li according to molecular orbital calculations. Or maybe it’s the other way around. So in theory anyway, you could use that reaction for isotope separation.
Losses in conversion are pricey. LNG plants typically consume 5-8% of natural gas for transportation. (A variety of losses/leaks, but the biggest is compressing the Natural Gas.)
I guess if you had an efficient conversion, a low mass to storage ratio, and an effective cost, it would work.
I would like to point out that fossil fuels have a very high energy to mass ratio. It is my understanding that renewable/storage is the opposite.
Most of the utility scale batteries that I’ve read up on are very heavy, and in Ambri’s case, explosive if shaken.
I’m also wondering whether subsea HVDC is a lot cheaper than over land.
Over land is very expensive because you need to build expensive towers and install them.
Subsea is easy. You just plonk it on the seabed and leave it there. No easement costs. No NIMBYs. No access roads. No towers. If so, the transmission costs of powering the UK from Libyan solar farms might be a lot lower than we see in the calculations in this study.
Another datapoint – from A 2020 GB transmission network study using dispersed wind farm power output, Gerber et al (2013), Renewable Energy (2012):
These distances aren’t so far and we are still looking at around $0.65 BN per GW.
Although it’s possible that much of the cost is in the conversion at each end.
Here is a technical feasibility study for an (mostly) sub-sea HVDC network on the east-coast of the UK from 2008, so a bit older. Many details and interesting stuff about the many parts of such a system including costs. It shows that not only renewables (wind/wave) would benefit from such a network, also e.g. nuclear power is easier transported around to where it’s needed most.
The costs in this study are estimated at on average £~0.3 MN per GW and £1.4 BN per GW per 1000km (from table 6). Unfortunately I could not find Appendix 1 that is supposed to show costs of individual components of the HVDC system…
Click to access east_coast_transmission_network_technical_feasibility_study.pdf
But the subsea cables are surely much more expensive, to deal with such a hostile environment (seawater, abrasion against the sea floor), and much more expensive to repair. And plonking the cable on the ocean floor is delicate work (you have to play out the cable at just the right rate) requiring a large specialized ship.
You don’t need to insulate the cable when it’s hung at the end of a long insulator from a transmission tower. You’ll need high quality insulation for an undersea cable. If they used insulated cable in the air, corona discharge wouldn’t be a problem. But the transmission towers would need to be stronger and closer together to deal with the increased weight.
One advantage of sub-sea vs overland is the lesser dependence on weather conditions (assuming you bury the cable deep enough in the seabed for it not to be damaged by anchors). This could be especially important in extreme weather prone areas like the US.
One of the most important reasons why the European grid is more reliable then the US grid, is the high percentage of subsurface cabling. Even some new HV lines are going underground here (despite the higher cost).
Here is an interesting paper: The limits of HVDC transmission, William F. Pickard, Energy Policy (2013).
Unfortunately it is behind a paywall. I might comment further or add into a future article.
Abstract:
Conclusion:
From the definitions:
d = end-to-end fractional voltage droop along a line: d = [I(RCL)]/Vgen (dimensionless)
7500 km at 2% loss, wow, that’s setting the bar high, but that’s what the paper is about. In comparison, the 2000km China HVDC connection transmits 6400 MW (rated) up to 7200 MW (temporary) over 800kV at 7% loss.
Click to access POW0056%20Rev%202.pdf
Click to access B4_102_2010%20The%20Xiangjiaba-Shanghai%20800kV%20UHVDC%20project.pdf
ontspan,
Do you know the cost of this 2000km 6.4GW China HVDC link? That would be a useful number.
Not likely. Accurate information about anything to do with the Chinese economy is difficult to come by. There appears to be a lot of deliberate misinformation as well.
SoD, I’ve searched long but could not find anything definitive. One report spoke of 1BN project cost be did not specify what was covered by that. It seems much too low for the entire project.
I learned something else though: the project was headed by two firms: ABB and Siemens while the construction, even the converter stations, was done by Chinese firms. So ABB and Siemens more or less only supplied their knowledge and tought the Chinese how to build the thing.
“such long lines can be constructed to have transmission lossesoe 2%”
But from the numbers in the conclusions, such lines would have hideous capital costs; the relatively low current could make the cost as much as an order of magnitude greater than SoD’s “as a rule of thumb, think $1BN per 1GW per 1000km as the likely minimum”. So 7500 km might be several 10’s of billions per GW. Once again, technically feasible but economically not even close to feasible (nuclear power plants are maybe $7 billion per GW).
Excuse me for a moment while I have a rant – and then attempt to tie it into the western climate dynamic.
The climate system is a globally spanning, complex mechanism. It is not a mechanism as the vast majority of people understand mechanism. The climate system is characterised by abrupt shifts in ice, cloud, dust, vegetation and ocean and atmospheric circulation. Small changes in conditions may push the system past a threshold – but we don’t know how significant this risk is or what the outcome is likely to be. To imagine you can predict climate change from theoretical forcings is delusional ideation of the highest order. The science of abrupt climate change is not merely huge but compelling as a way of the explaining climate data.
I have had endless discussions with dimwits about this. The world’s best climate scientists at realclimate for instance. The endless litany of simplistic messages – the refusal to discuss reasonably – endlessly keeping the – purely political – message pure. One guy insisted that there was no complexity science – one guy insisted that climate wasn’t chaotic because – unlike models – there were no slightly different starting points. Sou from Curmudgeon insisted that climate change on decadal scales just didn’t happen – and I was … The politics are different – self-proclaimed culture warriors on either side of the artificial divide – but the message is the same and overweeningly pompous, dogmatic and profoundly ill informed. Is this a global conspiracy? Naw – it is just stupidity.
‘The global climate system is composed of a number of subsystems — atmosphere, biosphere, cryosphere, hydrosphere and lithosphere — each of which has distinct characteristic times, from days and weeks to centuries and millennia. Each subsystem, moreover, has its own internal variability, all other things being constant, over a fairly broad range of time scales. These ranges overlap between one subsystem and another. The interactions between the subsystems thus give rise to climate variability on all time scales.’ Michael Ghil
So as far as I am concerned it is just endlessly idiotic. There is a conceptual threshold beyond which is a new way of looking at things. Without which it is all sound and fury signifying nothing – and with less veracity than a talking horse. In fact it is all a horse’s arse. A global delusional psychosis.
But presuming there is some risk involved in changing the composition of the atmosphere – what is the rational way forward?

Carbon dioxide from electricity generation is some 26% of the total greenhouse count. From fossil fuels some 57% – about the same climate forcing as black carbon. Carbon dioxide from electricity generation is a very small part – some 14% of the emissions problem. Yet we could be forgiven for thinking from the attention it receives that we can solve the emissions problem by transforming the electricity generation system. Not remotely true – but it serves an underlying political agenda. Nothing less than the overthrow of capitalism and democracy.
Some people would have us put huge resources into low carbon electricity generation – and little into anything else if this madness of crowds some call a climate debate is anything to go by. The real solution is in reconciling economic growth and the environment – incorporating a multiple gas strategy including aerosols and addressing population, agriculture, land use and the environment. Addressing emissions on a broad front promises rapid, comprehensive and effective action.
Low cost power is the engine of development – to maximise economic development requires cost-effective and efficient power generation infrastructure. Cost effective alternatives to coal and gas – landfill gas, hydro, geothermal, etc. – tend to be small scale and localised. Levelised cost of wind, solar or nuclear are vastly more expensive. To get to the lowest cost system requires using gas or coal at this stage. To imagine that you can get high cost – and intermittent – technology to work by expanding the grid simply adds costs with not the slightest proof that we can overcome the intermittency problem and avoid the need to provide backup gas or coal capacity is absurd by any analysis. I cite the NREL energy futures paper – http://www.nrel.gov/analysis/re_futures/ It can be done but it would cost a bucket load and drive the world deeper into poverty – without much to show for it. How does this sort of madness persist?
Frankly the technology that is likely to provide an answer is small, modular, current generation nuclear engines – http://watertechbyrie.com/2015/06/06/safe-cheap-and-abundant-energy-back-to-the-nuclear-energy-future/ – without the need for extensive distribution systems.
Chief Hydro, what a [deleted – pls read the Etiquette] you are. Many behaviors in climate are deterministic and as we learn more, the modeling gets better.
@whut,
Do you know what deterministic and chaotic mean? I wrote Natural Variability and Chaos to address some of the basics.
Many “apparently deterministic” processes are not. The fact that an equation exists does not mean the result is “deterministic”.
Take the double-pendulum as one of the simplest ideas of chaotic behavior.
Many processes in climate are chaotic. That is, we cannot predict their exact state vs time. However, some chaotic systems have statistics that are predictable even though their state vs time is not.
The period over which such statistics are predictable is not something that can be deduced from looking at the equations.
For example, take a look at Natural Variability and Chaos – Four – The Thirty Year Myth.
Please read the Etiquette.
Also in About this Blog, I wrote:
http://rsta.royalsocietypublishing.org/content/369/1956/4751
Models are chaotic – leading to the idea of irreducible imprecision.
http://www.pnas.org/content/104/21/8709.full
Climate shows ‘abrupt and seemingly random change’ at all scales – as Michael Ghil suggested in the quote above.
try – http://watertechbyrie.com/2014/06/23/the-unstable-math-of-michael-ghils-climate-sensitivity/
or – http://watertechbyrie.com/2015/06/06/climate-chaos-the-once-and-future-dragon-king/
http://www.ipcc.ch/ipccreports/tar/wg1/505.htm
http://www.pnas.org/content/106/38/16120.full
I started with this idea – which is a very poorly understood key to climate theory – for a reason. It suggests two things. One that ‘internal variability’ – the outcome of many and complex feedbacks – is not quantifiable at all easily and may lead to moderate – if any – warming over a decade or two more. Secondly that ‘internal variability’ can lead to extreme change in as little as a decade amplifying the risks of climate destabilisation. Nor can we presume that the next climate shift will be to yet warmer conditions. Both sides in this have ludicrously ill informed positions that object to one or other of these ideas. It all illustrates the axiom of Voltaire – doubt is uncomfortable but certainty is absurd.
So we presume there is a risk and ask the hard questions on optimal policy responses – which was the bulk of the comment I made earlier. Although the view on decadal predictability may be optimistic – nor do they address the issue of divergent solutions over periods more than a decade or so.
http://www.sciencedaily.com/releases/2013/08/130822105042.htm
The literature of complexity is immense – something that WHUT specifically denies exists at all for some immensely odd reason. It is the new climate paradigm providing a powerful conceptual framework for understanding climate process. But it is not for everyone – with most failing to cross the conceptual threshold to a broader understanding. You stick to the shallow end WHUT.
There are ways forward to reduce climate risk – and little of it involves this nonsensical idea of international power grids. Prima facie on the grounds that emissions of greenhouse gases from electricity generation is a small part of the total. Scientific certainty is not required for action – all that is needed is rational development and environment policy.
http://watertechbyrie.com/2015/06/06/economic-growth-and-environmental-management-in-a-global-iriai/
I would think that low-carbon electicity could make inroads into the carbon use of transport and industry, and so have a bigger impact than it has currently.
Talking of which, do you have a reference for that pie chart?
The Small Modular Reactor is an interesting concept, one which I hope gets a bit of wind behind it, metaphorically speaking.
US EPA greenhouse gas site – http://www.epa.gov/climatechange/ghgemissions/global.html
There is a lot that is at the edge of practical realisation.
e.g. http://driftelectric.com/
Power costs are critical.
http://watertechbyrie.com/2015/06/06/safe-cheap-and-abundant-energy-back-to-the-nuclear-energy-future/
Let me expand on that a little. The fossil fuel industry has a use by date.
see for instance – http://www.its.caltech.edu/~rutledge/DavidRutledgeCoalGeology.pdf
David Rutledge estimates 90% of total coal production by 2070 – with total consumption 3 times less than the IPCC estimates I might add. Oil is already going that way with alternative sources of liquid fuels becoming increasingly important over the next few decades. The corresponding increases in prices due to increasing scarcity leads naturally to ‘economic substitution’. The ‘market’ is easily capable of rapidly transitioning to new energy sources through what Joseph Schumpeter called ‘creative destruction’ – he considered it to be ‘the essential fact about capitalism’.
An example – EV’s are the future of individual transport. There are currently two major limitations.
Lithium ion batteries are expensive, short lived, heavy, toxic and are thermally unstable needing complex management systems.
This will change – there are a number of alternatives ready to make their mark. – http://www.pocket-lint.com/news/130380-future-batteries-coming-soon-charge-in-seconds-last-months-and-power-over-the-air – Some of these can be manufactured using existing battery facilities such as Tesla’s forthcoming plant.
Using ICE as range extenders means complex, heavy, inefficient, noisy expensive technology. Linear power systems are the way to go – efficient, cheaper, far simpler mechanics, low vibration, fuel flexible… . – http://www.linearpower.org/ –
You can easily put these together to make a cheap, efficient and versatile vehicle.
e.g. http://judithcurry.com/2015/01/29/towards-mass-marketed-electric-vehicles/
I very much like the motors on this. $1600 a piece – and could be swapped out in an hour and you are back on the road. Conceptually more like your laptop than a conventional vehicle. Plug and play.
This btw was the last semi-civil discussion I had at climate etc. The problem is giving free rein to a handful of people whose only purpose is to shut down as rudely as possible views they object to. WHUT is certainly of this ilk – and indeed follows me around repeating the same sort of gratuitously pejorative comments. It seems par for the course for the climate interweb. I have stopped commenting anywhere – except here obviously. I appreciate sincerely your moderation practices.
Chief Hydrologist,
The link on the Drift EV made interesting reading. But “The Drift is an idea whose time has come” seems a severe overstatement. I count three or four major subsystems that require unproven technology (batteries, engine, chassis, maybe the motors). And it seems to be a plug-in hybrid, not an EV. Very cool if it happens, but I am not holding my breath.
I agree that fossil fuels are a self-limiting technology. I think it unlikely that we will get away from them without nuclear, but most of the greenies want to block that.
The Drift EV was an exercise in combining technologies to produce an EV with mass appeal – as opposed to what there is at the moment. Dowdy, expensive and under-powered commuters or hugely expensive and impractical toys. Most of the technologies are available off the shelf.
430hp, 250km/hour top speed, immense torque, zero to 100 km/h (62 mph) in just 4.2 seconds. Supercar performance – actual dta from the Brabus Mercedes conversion.
Chassis and other components are discussed here. – http://driftelectric.com/ –
Note the chassis. The limitations are batteries and range – and her there are proven technological advances that are in commercial development. It is technically an EV – totally powered by electricity – with a range extender. It supplements mains supply with an on board linear generator.
The small, modular reactor is 50 year old technology – brought up to date with advanced fuel cycles and state of the art materials. There are literally dozens of designs in development. The EM2 is a technology evolution designed to a performance specification that included cost, safety, fabrication, installation and operations that give it outstanding potential to change the energy landscape. The fast-neutron reaction first converts fertile material – including uranium, plutonium and thorium – to fissile material which then splits under neutron bombardment to produce heat and lighter elements. Inert helium moving through and around the core is heated and drives a high efficiency Brayton cycle turbine. Helium is then cycled back through the reactor. Helium – rather than water – cooling enables siting flexibility in a footprint that is ten times less than conventional nuclear plants. The small modular design allows network grids to be developed in place of large and expensive grids shuffling energy across whole continents. A huge cost advantage in regions without existing electricity grids. High temperature operation enables efficient conversion of heat to electricity. It enables hydrogen production with what would otherwise be waste power and heat in low load periods. Liquid fuels compatible with existing infrastructure can be produced from hydrogen and captured carbon dioxide. High efficiency – 50% greater than conventional nuclear – cuts costs of power by 40%. Sufficient to make it cost competitive against natural gas generation in the USA at a gas price of $6-$7/MMBtu. Natural gas prices in the US are about half that at the moment – suggesting that a natural gas to advanced nuclear strategy is the optimal energy future.
CH,
Why is power cost critical? In most economic activities (electric) power is only a small portion of the product/service cost. This applies to households as well, electricity costs are mostly only a small portion of the budget. Moreover, many examples show that when costs go up efficiency goes up as well so the relation to changes in electricity cost and budget is not equal per-se.
scienceofdoom: I just wanted to say thanks. I’ve really enjoyed this series, and look forward to more of it. I think its important to take a sober look at all this.
[…] « Renewables VIII – Transmission Costs And Outsourcing Renewable Generation […]
[…] to our calculations in VIII – Transmission Costs And Outsourcing Renewable Generation this will cost around $2.5BN, give or take a little (or maybe a […]
[…] Renewables VIII – Transmission Costs And Outsourcing Renewable Generation […]
Let’s put costs into perspective.
In the U.S.A. alone, we spend ~$1.5 trillion every year on fossil fuels (2012 prices). We have also paid for all the infrastructure to support that system over the years- how much did that cost – tens of trillions?
In what units is the lifespan of HVDC above or below ground measured – years… decades… a century or two?
Even early generation PV panels appear to degrade quite slowly in use – lifespan looks to be ~ 80 years.
Spending a trillion or so for the luxury of siting energy farms where they are most efficient seems a bargain compared to the cost of fossil fuels and the cost of adaptation to AGW over the lifespan of a new system.
Accumulated adaptation costs for the U.S. by year 2100: somewhere between $75-300 trillion. Accumulated fossil fuel costs for the U.S. by year 2100 based on today’s costs – ~ $127 trillion
According to Jacobsen and Delucchi, the cost to build renewable energy infrastructure to take California carbon-free is ~$1.0 trillion. California is 1/6th of U.S. energy use.
Cost is NOT the issue.
Gingerbaker,
It isn’t going to be built below ground, the cost is too high.
For the cable and overhead towers, it depends on how well engineered it is. There are probably some lifetime calculations around for past overhead lines based on corrosion, wear and tear, occasional storm damage, etc. It’s in the order of decades.
For the converters at each end, and each “off take point” (not sure of the jargon here), you have expensive semiconductors with something of an unknown life. These conversion stations are expensive and might have a 20 years life, they might have a 10 year life. Failure of new generation power semiconductor devices is always uncertain. After they start failing you find out the lifetime.
Can you give me the approximate proportions of each energy type you believe will be used in this $1TR cost.
Paper is here:
web.stanford.edu/group/efmh/jacobson/Articles/I/CaliforniaWWS.pdf
Gingerbaker,
I hope to shortly cover Cost-minimized combinations of wind power, solar power and electrochemical storage, powering the grid up to 99.9% of the time, by Cory Budischak et al – which provides a better analysis than Jacobsen and Delucchi – although I can’t get their maths to add up at the moment.
Every region is different. Let’s suppose, for sake of argument, that California spent only $1TR and consequently could provide all electricity via renewables (I doubt it myself). This doesn’t imply that the N.E. USA can spend $1TR x electricity consumption of NE / elec consumption of California.
You can’t make those comparisons. You can with conventional power because you stick power stations just outside the city that needs power and you incur minimal transmission costs.
So just because region A can use renewable power to get 99.9% of its electricity doesn’t mean region B can or, if they can, that the costs scale accordingly.
I am also wondering why the analysis they (Jacobsen and Delucchi) point to only reviewed 2 years to calculate the probability of loss of load of 1 day per 10 years:
You can see in the comments of XII – Windpower as Baseload and SuperGrids that an attractive grid smoothing out “no wind conditions” can be great one year and bad another year. This one covers the east coast from Maine to The Keys:
Gingerbaker,
Thanks for the link to the Jacobsen and Delucchi paper. I’ll give it a look, but just from the abstract, I am skeptical of the cost estimate. They write: “$1.1 trillion installation cost of 603 GW of new power needed for a 100% all-purpose WWS system within ~7 (4-14) years”.
That is $1.8/W for the generators, transmission lines, and storage. Strikes me as overly optimistic.
But as SoD points out, for renewables every location is different. California is an exceptionally favorable place for solar. Peak electricity use is in the summer and much of California gets virtually 100% sunshine in summer. So with enough storage, you could surely get reliable summer power from a solar PV network (or solar plus wind), at a price. Solar is less reliable in winter but demand is less and winds are stronger, so the system could be likely made reliable in winter as well. But the situation is very different in the eastern and central time zones. In such places, I suspect that wind and solar are doomed to fail.
I see no point to seeking 100% renewables, unless the objective is religious purity. 95% would be MUCH easier, with the small remainder provided by occasional use of natural gas peaker plants. From the point of view of climate, there would be no real difference between 95% and 100%.
Gingerbaker,
I’ll comment more on these “100% renewables” papers in future articles. I’ve already commented on an Australian study (AEMO) in VI – Report says.. 100% Renewables by 2030 or 2050.
Jacobsen and Delucchi say:
One of the first references is The first step towards a 100% renewable energy-system for Ireland, Connolly D, Lund H, Mathiesen B, Leahy M., Appl Energy (2011):
Spot the main energy source for a country that has more wind resources than most countries in the world.
I’ll comment more in future articles.
Given the softness of adaptation cost estimates, I would say the range should start from $0.00
I don’t know whether to laugh or cry over that. The technology to take California carbon-free at any price doesn’t exist today, so estimating a cost is a guess and will depend entirely on the bias of the authors. If you just mean carbon free electricity, then the technology exists, but it’s unacceptable to the greens because it means lots of nuclear power plants. But electricity accounts for only 32% of carbon emissions nationwide. Electric vehicles are currently impractical, and are highly likely to remain that way, in a state as large as California with the population as dispersed as it is. When I see an electric long haul tractor-trailer rig, maybe I’ll change my mind.
Air travel will also be a thing of the past in a carbon-free world, but that’s only a few percent of total carbon emissions.
scienceofdoom,
I would just like to say that I am happy to have stumbled upon your blog today. I have found it difficult to find a blog, or indeed, commenters on other blogs who are interested in exploring what should be our baseline understanding of what it will take to actually build the new energy system we will need. It seems that there are many smart, educated people who would rather argue about facts, or stick to their narrow discipline within the field.
After billions of words on hundreds of climate blogs – finally! – someone happily and politely doing the hard work of evaluating the nuts and bolts of the new technology which will determine if our civilization will survive. Thank you for your efforts. 🙂
Gingerbaker, thanks for your kind comments.
[…] Renewables VIII – Transmission Costs And Outsourcing Renewable Generation […]
SoD,
“Maybe someone has already done a detailed cost analysis of a “massive inter-state power transmission” project.”
There is a project claimed to be going forward to build a 700 mile (1200 km) 4 GW transmission line from Oklahoma to Tennesee:
http://fuelfix.com/blog/2015/11/06/clean-line-energys-2-5-billion-wind-power-project-poised-for-approval/
Projected cost is $2.5 billion, so about half your estimate. Presumably they have done a detailed cost analysis. Of course, the final cost might well be higher, if it gets built.
Mike,
It’s another data point. Some of the data in this article was from projections which in turn were based on their analysis of recent projects.
Since writing this article I found another couple of data points, indicating that the cost per 1000 km per GW of a transmission line was about 65% of the total cost I put forward, but the cost of the DC-AC conversion at each end was about 35% – indicating that longer transmission lines with only conversion at each end would be a fair bit lower than the over-simplified “ready-reckoner” that I put forward.
However, this project is “only” 1200 km and still has quite a low cost. There isn’t any breakdown in the press release so we don’t have a lot to go on. One of the big variables is the cost of land. Another variable is the wind and ice loading.
The other big variable is the energy loss you are prepared to take. That is, the conductor weight depends on the total resistance. And the towers to support the conductors depend on the weight of the conductors. So it’s easy to see that if you double your losses (double your resistance = halve your conductor weight) you get some big benefits.
Once you have enough variables to play with the tradeoffs can be significant.