Onshore wind seems to be the lowest cost renewable energy source (perhaps excluding hydro – I haven’t looked into the costs of hydro because it is mostly “tapped out” in developed countries).
Wind power (onshore) is a mature technology – when you buy a wind turbine and install it, you know it’s going to work, and you can have some expectation, at least across a wind farm of many turbines, of your O&M costs. You can have a reasonable expectation that it will run for perhaps 20 years. (Of course, you can’t have certainty on any item like lifetime or O&M costs, but this is true of any piece of equipment).
You also know – based on meterological data for the location – roughly how much energy it will produce. This is the capacity factor – the percentage of energy produced vs the “nameplate” value (the nameplate tells you the output if the wind is blowing at the maximum value).
So if you install a 2MW turbine in some parts of the UK or Ireland, or coastal regions of Europe, you might get 30% of that as annual output – 2000kW x 8760 hours x 30% = 5.3M kWh (written another way – 5.3 GWh annually). If you install the same turbine in some parts of Europe, or other parts of the UK, you might get a little over half that – 3M kWh (3GWh).
You can have some confidence in the annual energy production in advance.
Depending on the regulatory structure in the country/state in question you can have a reasonable idea of how long the process of approvals will take, and the grid connection costs (we’ll come back to grid connection later).
If we compare this with building a gas plant, or a coal-fired or nuclear power station then wind is more “modular” and there is a lot less project risk – if you want to produce say 500 MW annually (4,380 GWh) from a given technology then you could build a 550 MW gas plant (expecting certain downtime each year). From design through to startup might take a few years and there are all kinds of “little” problems that can cause significant delays. All of these can be mitigated one way or another, but many plants are late. It’s just the reality of complex projects.
And by the time of startup, the gas price (your fuel) might have doubled in cost from when the design commenced (also it might have halved). Most “expert” predictions of future gas and oil price ranges are only accurate when the price doesn’t change much, so large fluctuations are difficult to deal with. It’s a bit like predicting the weather tomorrow will be same as today. You are mostly right but how useful is that prediction?
To get the same output of 4,400 GWh from wind farms you need to install around 1,000 2MW wind turbines, depending on location (this calculation assumes 25% average output – 2GW x 8,760 x 0.25). You don’t have to wait 5 years before your investment starts producing energy that you can charge for. You can install around 20 a month for 4 years and be producing energy from month 1.
So there are a lot of project benefits for wind. On the downside for wind, you have to stump up most of your cash at the start, so you are a little more dependent on interest rate risk than a gas plant builder.
There are three main downsides to wind:
- It’s not “dispatchable” so it doesn’t create baseload power – another way to say this is that wind power at significant grid penetrations gets very little “capacity credit” – something needs to provide power when the wind is not blowing, or not blowing much – we looked at this in IV – Wind, Forecast Horizon & Backups and in Renewable Energy I
- A lot of places where you might want to install wind farms there is no transmission grid, so there is a cost which is not usually factored in to wind power costs. Building transmission grids is expensive –VIII – Transmission Costs And Outsourcing Renewable Generation. Another way to look at it is you are constrained to put the wind farms where the wind blows best, rather than at a convenient point on the grid. The same is true of nuclear power, of course – for reasons that are unclear to me they are mostly get built a long way from big cities. Gas and coal power stations can have more flexibility. But the ideal place for a wind farm is often on top of an inaccessible hill with no transmission line for 100km.
- Wind has a very low energy density, so requires a lot of land. We will come back to this important point in a future article. This is why Europe has high projections for offshore wind despite major problems with offshore.. In places with high wind and low population density like, say, Oklahoma this is not so much of an issue.
Of course, many people don’t like wind farms cluttering up the countryside but I’m just going to ignore that. Many people don’t like roads or telegraph poles or coal-fired power stations or nuclear power stations or changing the color of phone boxes (what are they?) or the large quantity of birds killed each year by cats..
This series is about more practical energy considerations like how a grid works, how much power can be produced, what it costs, and so on.
Not hurting peoples’ feelings is for another series.
Costs
This numbers I’ve extracted come with quite a margin of error. If you buy one 2MW wind turbine you might pay $X. If you buy 10 you might get a 5% discount. If you buy 500 you might only pay 75% of $X per turbine. One year the prices will be lower because of exchange rate fluctuations and raw material costs. The next year they will be higher. If you negotiate better you might pay 15% less than the next guy for the same quantity in the same month. And so on. This is true for all purchasing. There is no “one price” in real life for most items.
Here I’m just trying to put a stake in the ground so we can get an idea what wind energy costs.
Onto numbers.
Blanco (2009): the capital cost of installing a 2MW (nameplate) wind turbine ≈ €2.4M, of which just over 70% was the ex-works cost of the turbine. (In 2009 this was about US$ 3.4M with the exchange rate quite high, at €1 = $1.4, vs today around €1 = 1.11).
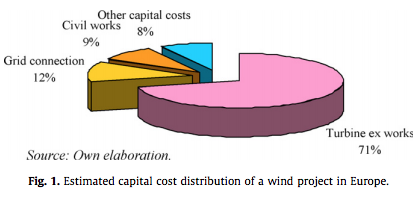
From Blanco 2009
Figure 1
As explained in the previous sub-section, wind energy is a capital-intensive technology, so most of the outgoings will be made at this stage. The capital cost can be as much as 80% of the total cost of the project over its entire lifetime, with variations between models, markets and locations. The wind turbine constitutes the single largest cost component, followed by grid connection.
After more than two decades of steady reductions, the capital costs of a wind energy project have risen by around 20% over the past 3 years. The results of our survey show that they are in the range of 1100–1400 €/kW for newly-established projects in Europe.
And The Economics of Wind Energy from 2009 has similar data:
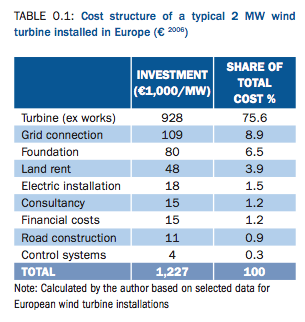
Figure 2
So again installing a 2MW turbine and connecting it to the grid costs around €2.4M.
If we look at the capex cost of this wind turbine over 20 years in a many parts of Europe with a capacity factor around 15%, we see that it produces 53M kWh (2000 x 8760 x .15 x 20), so ignoring the cost of capital, a capex cost of 4.5 c€ per kWh. In Ireland and many parts of the UK, with a capacity factor around 30%, we get 2.3 c€ per kWh. This kind of cost is also written as €23/MWh – €45/MWh.
Operations and maintenance cost vary of course. Current estimates seem to be around 1-1.5 c€/kWh or €10-15/MWh. Some of these costs are “fixed” in that they are legal or regulatory so cannot be tied to the energy output while others are clearly related to the energy output (replacing parts, etc). And there is a lot of variability in all of these costs.
So to put this in a different perspective, for our 2MW turbine, running at an attractive 30% capacity in a high wind location, the O&M cost is around €53,000 – €79,000, and over 20 years (again ignoring cost of capital which increases the cost of initial payments vs later maintenance costs) this equates to €1.1M – €1.6M, which is not insignificant in light of the capital cost.
Of course, the long term maintenance costs are quite unclear, as there isn’t a lot of 20-year data on wind turbines, and no long term data at all for current generation products.
The 20-year life is also a value that exists more for planning purposes than a real consideration of actual lifetime. Many conventional power plants were given something like a “30-year life” yet are still operating 50 years on. In those cases, the “lifetime” was more for planning and purposes of financial measurement, rather than the belief that after 30-years they would fall apart. And the “30-year” plants still operating after 50 years may have had a number of expensive refits during that period.
If we sum it up in a “proper financial metric” like Levelized Cost of Energy (LCOE), we need to include the cost of capital and take into account the capacity factor. And then take a view on the number of years the wind turbine will operate.
All this does is obscure the costs, as anyone used to trying to compare the cost of different types of power will attest. So we will stick with raw numbers for now. It makes it easier to compare other forms of energy generation that we will look at in subsequent articles.
The International Renewable Energy Agency (IRENA), 2012 had higher costs:
Installed costs in 2010 for onshore wind farms were as low as USD 1,300 [€1100] to USD 1,400/kW [€1200] in China and Denmark, but typically ranged between USD 1,800/kW and USD 2,200/kW [€1500-€1800] in most other major markets. Preliminary data for the United States in 2011 suggests that wind turbine costs have peaked and that total costs could have declined to USD 2,000/kW for the full year (i.e. a reduction of USD 150/kW compared to 2010). Wind turbines account for 64% to 84% of total installed costs onshore, with grid connection costs, construction costs, and other costs making up the balance..
At this time the exchange rate was around €1=$1.20, I added the € cost in [] brackets at that exchange rate.
The US NREL 2011 Cost of Wind Energy Review has $2,100 per kW installed cost. Converted to Euro at the prevailing rate we get about €1,500 per kW. So for our 2MW turbine (reviewed earlier) the US cost would be (in Euros) €3M instead of the €2.4M.
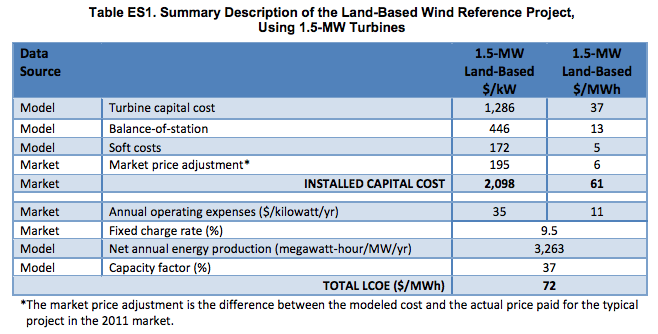
Figure 3
Their operating expenses are in a different format. Here a 2MW turbine would cost $70,000 per year to operate and maintain, or (in that year) about €50,000 – a similar number to the lower end of the range given in Blanco (2009).
They also provide a nice graphic showing (to me at least) why producing LCOE (levelized cost of energy) values is not particularly helpful:
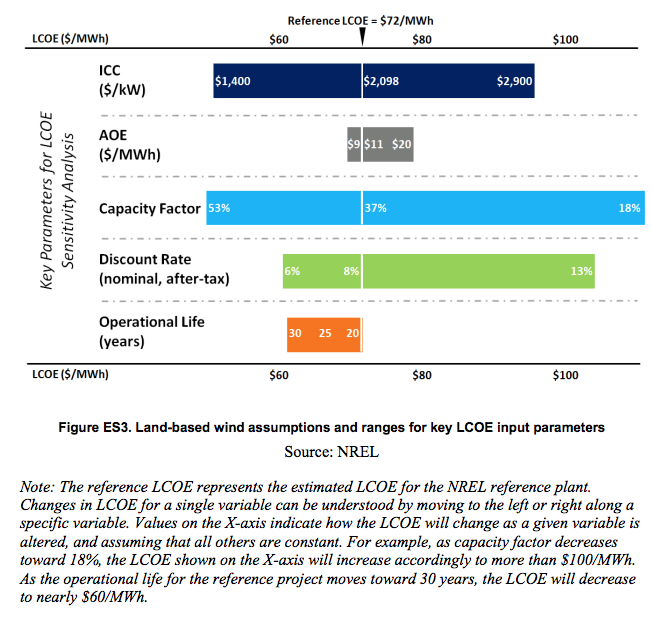
Figure 4 – Any value you like!
The report comments further:
Although the reference project LCOE for land-based installations was observed to be $72/MWh, the full range of land-based estimates covers $50–$148/MWh.
Exactly.
The largest factor, and the reason why a generic cost per MWh for wind and solar is a useless number, is it depends where it is located. High wind, lower LCOE. Low wind, higher LCOE. I doubt anyone would have come up with “LCOE” if energy generation had been dominated by wind and solar in the past. They would have come up with something like “LCOE per % capacity factor”. The “reference value” of $72/MWh was at a capacity factor of 37% (note 2), a value rarely seen in new European installations. I think the average for the UK (from memory, not checking) is around 30% currently, and it has gradually increased over the past few years. Many parts of continental Europe have capacity factors below 20%.
The NREL report also shows the formula for LCOE (for those interested). I’m assuming that the reason they have nearly $80/MWh for a 30% capacity factor (figure 4) – vs our figure of €23+€10/MWh = $46/MWh in that year – is due to the 25% higher capital cost along with introducing the cost of capital.
This illustrates an important point with renewables – from country to country and region to region there will be very large differences in their ability to convert to high penetrations of renewables.
One further point to be noted from these data points is that we can’t always assume the costs over the next few years will go down – as outlined in Renewable Energy I. Due to high demand, the capex cost of wind power increased for a few years.
As far as I can tell, the above costs are all free of subsidies.
Transmission Costs
The grid connection costs have been considered in the capex costs, but these pre-suppose that transmission is available, or paid for by “someone else”. In some countries like Spain, this (paid for by someone else) has been true. As wind power grows, moving the costs to the grid operator becomes more problematic. If you connect to an existing transmission line and add 10 MW this is probably fine. Once you add 500MW at peak wind periods you might overload that transmission line and a $500M upgrade may be needed. On the other hand, if you are lucky, you might be replacing conventional capacity on an existing transmission line and no upgrade will be needed.
So it should be clear that this is one of the wild cards. Each case is different, but in most cases there will be substantial cost to be incurred – once wind power becomes significant, which of course is the idea.
In the last article we looked at building long transmission costs and as a massive over-simplification suggested that a cost of $1BN per 1GW per 1000km was a handy guide. So, if we build a large series of wind farms to replace a 500MW gas-fired power station, it will be something like 2GW nameplate. If we want to add 2GW into our transmission line at peak times, and it’s 500km long we can expect to incur a cost of $1BN.
Note that there will be other complications – see V – Grid Stability As Wind Power Penetration Increases.
If we compare the transmission estimate of $1BN with building 2GW nameplate capacity of wind power – a capex cost around €2.4BN – we see it will be significant.
Conclusion
Wind power is a mature form of energy generation with fairly well-known costs, minimal risks, and the benefit of not being subject to fuel costs with large fluctuations. Any cost analysis is always out of date but at least here we can see approximate values for capital costs and for ongoing costs – and the basis for these values.
Depending on where you locate your wind turbine you can get a factor of 3 change in annual output so €/MWh and $/MWh are not useful metrics without a location guide.
A good estimate from a few fairly recent studies is:
- Capital cost = €1.2M per MW or $1.5M per MW of nameplate (including grid connection costs, but excluding bringing a transmission line to the area). So to convert that to cost per energy produced you divide that cost by the capacity factor (which depends on location and might be 15% in a poor location -40% in a prime location) / 8760 hours in the year / number of years you expect your turbine to operate – and you get € or $/MWh (excluding cost of capital)
- Ongoing O&M costs = €10-15/MWh
We will look at the costs of other forms of energy in subsequent articles.
Articles in this Series
Renewable Energy I – Introduction
Renewables II – Solar and Free Lunches – Solar power
Renewables III – US Grid Operators’ Opinions – The grid operators’ concerns
Renewables IV – Wind, Forecast Horizon & Backups – Some more detail about wind power – what do we do when the wind goes on vacation
Renewables V – Grid Stability As Wind Power Penetration Increases
Renewables VI – Report says.. 100% Renewables by 2030 or 2050
Renewables VII – Feasibility and Reality – Geothermal example
Renewables VIII – Transmission Costs And Outsourcing Renewable Generation
Renewables IX – Onshore Wind Costs
Renewables X – Nationalism vs Inter-Nationalism
Renewables XI – Cost of Gas Plants vs Wind Farms
Renewables XII – Windpower as Baseload and SuperGrids
Renewables XIII – One of Wind’s Hidden Costs
Renewables XIV – Minimized Cost of 99.9% Renewable Study
Renewables XV – Offshore Wind Costs
Renewables XVI – JP Morgan advises
Renewables XVII – Demand Management 1
Renewables XVIII – Demand Management & Levelized Cost
Renewables XIX – Behind the Executive Summary and Reality vs Dreams
References
The economics of wind energy, Isabel Blanco, Renewable and Sustainable Energy Reviews (2009)
The Economics of Wind Energy, European Wind Energy Association (2009)
RENEWABLE ENERGY TECHNOLOGIES: COST ANALYSIS SERIES – Wind Power, International Renewable Energy Agency (IRENA), 2012
2011 Cost of Wind Energy Review, S. Tegen, E. Lantz, M. Hand, B. Maples, A. Smith & P. Schwabe, National Renewable Energy Laboratory (2011)
Notes
Note 1: From Blanca 2009:
Note 2: NREL report says:
The annual average wind speed chosen for the reference project analysis is 7.25 meters per second (m/s) at a 50-m height above ground level (7.75 m/s at hub height). This wind speed is representative of a Class 4 wind resource (7−7.5 m/s) and is intended to be generally indicative of the wind regime for projects installed in moderate quality sites in the “heartland” (Minnesota to Oklahoma).


SoD,
“Depending on where you locate your wind turbine you can get a factor of 3 change in annual output so €/MWh and $/MWh are not useful metrics without a location guide.”
I think that is a bit overstated. Even a fairly wide range can be useful. And it seems to me that the ranges in Figure 4 are a bit exaggerated. For instance, is there any onshore wind farm that achieves a capacity factor even close to 53%? And I don’t think anyone is going to build at a location where the capacity factor will be as low as 18%, unless it is to satisfy a politically motivated mandate. What I would say is that a single number for $/MWh, as opposed to a range, is not a useful metric without a specification of what is assumed.
I think that a much bigger issue is what the LCOE is to be compared to. An expensive new conventional plant or a cheap existing plant that might be forced offline by the wind farm? Relatively cheap base load power or more expensive peaking power? The full cost of the power displaced (including capital costs that are not reduced by adding wind) or only the marginal cost of the displaced power? And then there are possible costs due to imposed shifts in the conventional power mix, such as increased use of expensive peaking plants to compensate for the variability of wind. A very tangled mess.
Mike,
Somewhat dated and I’m sure others can provide more up-to-date information – Capacity factor of wind power realized values vs. estimates,
Nicolas Boccard, Energy Policy (2009):
I will dig for some more recent data.
This 15 year old wind farm has an average capacity factor of 52% (1)
Capacity factors are a choice (up to a point).
It’s partly a result of the specific area ratio (Su, the ratio of swept area vs generator size in m2/kW). A turbine with a high Su ratio will reach full power at lower wind speeds.
Traditionally there was about one type of turbine, with low Su ratio, designed for sites with optimum wind speeds. Now that a lot of those ideal sites have been ‘used-up’ turbines are getting optimized for different wind classes. So for a low-speed site you can select a smaller generator with the rotor diameter that used to drive larger generators.
E.g. the Siemens SWT-3.6-120 V2 has a Su ratio of 3.14 m2/kW and the Areva M5000-116 has a Su ratio of 2.11. EWT has a (smaller) turbine with a ratio of 4.6.
Another factor in increasing the capacity factor is a higher hub height. At higher altitudes the wind blows stronger and steadier. Using e.g. lighter nacelles, the hub height can be increased using the same cost for the tower.
When penetration levels get high I think there becomes a need for regulators to demand higher capacity factors. The market is moving in that direction anyway. Some call this the ‘silent wind revolution’ (2).
1) http://www.reuk.co.uk/Burradale-Wind-Farm-Shetland-Islands.htm
2) http://www.renewablesinternational.net/a-silent-revolution-in-the-wind-sector/150/435/87652/
ontspan,
“The 3.68MW Burradale windfarm is located just a few miles outside Lerwick, the Shetland capital. Since opening in 2000, the turbines at this windfarm have had an average capacity factor of 52%, and in 2005 averaged an incredible world record 57.9%.”
I’m impressed.
SoD,
I should have said where the capacity factor is expected to be as low as 18%. I suspect that the low numbers in your table are a combination of poor siting decisions and political pressure. From what I have read, the former were a lot more common a decade ago. leading to increased capacity factors for more recent installations, at least in the U.S. On the other hand, the political pressure …
Thanks for a continued excellent series.
The capacity factor (based on SCADA data) in “all Ireland” (NI + ROI) was 30.6% in 2013.
Source: Annual Wind Constraint and Curtailment
Report 2013, from the operator, Eirgrid.
As one of the windiest places in Europe it gives an up to date value for the top end of what is realistic.
That was 5,872 GWh of wind electricity – looking at this as “average output across the year” it is 670 MW (=5,872,000/8760). [Just corrected this last sentence a minute or two after first posting it]
Source: U.S. Energy Information Administration, Annual Energy Outlook 2015, April 2015, DOE/EIA-0383(2015).
These figures are for the US. Globally there is a broader range of capacity factors – and other costs – that result in large differences in levelised costs. The costs below are in US$/MWh.
Costs of any particular technology – like any other infrastructure – are dependent on local factors to a very large extent. However – in principle there are technologies with sub $100/MWh costs and these are potentially cost competitive. This is a dozen or so technologies – including onshore wind. Optimal system costs result from taking advantage of lowest cost technologies where available. The system objective is to combine technologies to deliver target reliability at lowest cost. This is a matter of getting the system modelling right. In the US there is a standard model that includes wind and solar data. Penetration of non-dispatchable technologies has the potential to reduce reliability or increase costs for dispatchable backup power. The point where this becomes an issue depends on the local energy mix. Wind and hydro – for instance – are potentially complementary. There is every incentive to take advantage of whatever resources are available – geothermal, hydro or landfill gas for instance – in a rational system design.
The other factor that raises it’s ugly head is ‘external costs’. There are much better ways of reducing greenhouses gases and particulates quickly than building expensive and unreliable power systems.
e.g. http://watertechbyrie.com/2014/06/30/black-carbon-a-health-and-environment-issue/ – or – http://watertechbyrie.com/2014/06/26/food-for-people-conserving-and-restoring-soils/
It is a matter of taking a much broader view on energy research, population, land use, development, health, education, agriculture and the environment. This can be furthered by maximising the value of aid.
e.g. http://www.copenhagenconsensus.com/post-2015-consensus
But for the most part in fostering economic freedom.
e.g. http://watertechbyrie.com/2015/06/08/the-new-un-sustainable-development-goals-are-they-suffering-from-relevance-deprivation-2/
The focus on fossil fuels is at best symbolic – including transport fuels it is some 25% of climate forcing – and at worst serves the latest manifestations of the culture war on capitalism and democracy that killed hundreds of millions of people last century. The two approaches are starkly contrasted.
http://www.ecomodernism.org/
Chief Hydrologist,
This blog isn’t concerned with the debate over whether “CO2 causes global warming” and “green energy” is an attempt to take over the world by socialists and green anti-capitalists. Or whether “pro CO2” and “keep conventional energy” is an evil conspiracy funded by fossil fuel companies and the Koch brothers.
Please have a read of the Etiquette. There are much better blogs with much larger readerships for those ideas.
http://www.nap.edu/openbook.php?record_id=10136&page=1
One of the problems is not radiative forcing – something that seems fairly obvious and has been for decades. It is about how the climate system responds and the real risks and uncertainties involved in that. If you imagine that CO2 is the question – which was not in fact a part of this comment at all – which dealt entirely with energy costs – then you have missed that point.
The other point was that low carbon electricity generation does not remotely solve the emission problem – does not go anywhere to addressing multiple gases and aerosols, land use, ecosystem degradation, the loss of carbon from agricultural soils or population and development pressures. What I said passing was that the exclusive focus on CO2 – which you again perhaps unthinkingly endorse in this misguided rebuke – is at best symbolic and at worst informed by ideological baggage. .
Two bottom lines. With shifts in climate every 20 to 30 years – surprises are indeed much more likely than not. There is no way of predicting climate – the ‘most we can expect to achieve is the prediction of the probability distribution of the system’s future possible states by the generation of ensembles of model solutions.’ TAR 14.2.2.2
The other bottom line is encompassed in the quote from the ecomodernist manifesto. This contrasts starkly with the ‘economic degrowth’ strategy – and it’s ilk – widely advocated. The latter is not a conspiracy but a social movement the evidence for which is abundant. It is like saying that I am an economic growth and environmental conservation conspiracist. No. We believe ‘that both human prosperity and an ecologically vibrant planet are not only possible, but also inseparable.’ This debate is all values based – and we value low cost energy, a comprehensive policy response and a bright future for humanity. You may disagree.
Chief Hydrologist,
Agree or disagree, it’s not for discussion. That’s the point.
Politics is fascinating, although not politicians and most of what passes for political debate. But here we’re not debating politics, political movements, whether climate science has been hijacked or whether environmental policy has been hijacked.
Motivations – not for debate. See the Etiquette:
If we stick to assessing the science and in this series, also:
– the costs
– the technical realities & problems
– the feasibilities vs practical results
– also the economic policy that drives these changes
..then we can have a discussion on something useful. And learn something.
At least, I can learn something.
I have degrees in engineering and environmental science – and I have learned a little over the years.
Let me try once more. The levelised cost is the appropriate unit of comparison – and here both the US EIA 2015 Energy Outlook and the World Energy Council 2013 report agree – onshore wind and gas have broadly similar levelised costs. Beyond that it should be recognised that penetration by non-dispatchable sources beyond a relatively small contribution – depending on the regional energy mix – starts to incur cost penalties.
I said we value lowest cost generation. I might equally have said that the rational policy objective was low cost energy generation. Not least because of the relative ineffectiveness of transitioning generating systems in climate forcing – even if feasible technically. But primarily because of the link between between energy cost, economic productivity and desperately needed global development.
That said – ‘the science’ suggests that climate will shift abruptly with indeed the potential for extreme change in as little as 10 years. The rational policy response is to pursue a pragmatic strategy on multiple fronts. ‘This pragmatic strategy centers on efforts to accelerate energy innovation, build resilience to extreme weather, and pursue no regrets pollution reduction.’ http://thebreakthrough.org/archive/climate_pragmatism_innovation
Chief Hydrologist: The LCOE is only a starting point for calculating the value of energy. The efficient price for any item is the price where supply equals demand. In that type of marketplace with large swings in demand any existing infrastructure, non-dispatchable power is worth far less than dispatchable power!
Not perse, it depends.
The price of electricity is traditionally determined by demand and the marginal cost of power when it moves up or down the merit order. Dispatchable power (I assume this means coal, gas, nuclear) is worth less during the night and more during the day. It’s not valued because it’s dispatchable, it’s valued at the marginal cost in the merit order at the point of demand. Everyone gets the same price. Add more low-marginal capacity and the merit order shifts resulting in (on average) lower prices.
This graph shows this process nicely:

Say -without PV- the mid-day spot price is $80/MWh and then you add some GW’s of PV. Due to the low marginal cost of PV the merit order shifts to the right and the spot price drops to $60/MWh. Suddenly all generators earn $20/MWh less then they used to. Everyone is happy, except the utility that has his capital tied up in expensive but now idle generation. Is this non-dispatchable PV-power worth less then the replaced dispatchable power that used to deliver these MWh’s? I’d argue it’s not.
ontspan:
See:
https://energy-charts.de/price.htm
Remove “Solar” and “Wind” in the chart by clicking on the dots.
Often the correlation (by sight) of price and “Conventional” is pretty good.
However it changes by day, week and year.
Boels, yes, that confirms that prices move upwards when demand is moving up the merit order and more expensive conventional power is needed.
Another example is the graph below. On the left the price-curve for a day in March 2008, on the right a day in March in 2012. PV-capacity in Germany during that period soared from ~10 GW to ~35 GW.
Not sure how typical this selection of dates in the image above is, but I suspect they’re pretty typical.
Frank,
I think that it would be more correct to say that non-dispatchable *capacity* is worth far less than dispatchable *capacity*.
ontspan wrote: “Suddenly all generators earn $20/MWh less then they used to. Everyone is happy, except the utility that has his capital tied up in expensive but now idle generation.”
That may be true in the short run. But in the long run, the producer with the idle generation will decide to mothball it rather than maintain it. Result: rolling brownouts at times of peak demand, making almost everyone very unhappy.
“Is this non-dispatchable PV-power worth less then the replaced dispatchable power that used to deliver these MWh’s?”
Damn right it is.
Ontspan, you took issue with Frank’s comment:
It’s true that if you are buying energy you don’t care where it comes from. And you will pay the market price for it. So 1 MWh is 1 MWh.
But there is an important point for running a grid. You need to match demand with supply second by second. From that point of view, and it’s an important one, an intermittent source of energy is not as valuable as dispatchable energy. Perhaps if you don’t like grid operators, think of a hospital.
We’re not football supporters here. You can “argue” all you like, but it doesn’t change the basics of energy supply.
Mike N and SoD, people within the utility sector and I are acutely aware of the influence of lots of non-dispatchable low-marginal cost generation on the profitability of not just existing traditional generators but renewable generators as well. There are more thoughtful responses to this question than just “it’s worth less”: trying to find possible solutions, like e.g. establishing some form of flexibility market alongside the primary bulk market.
Such a market would ask for availability of guaranteed capacity without the need that this capacity is actually used, it just needs to be available when need arises and provide a comparatively small compensation for this service. This allows e.g. (efficient) gas generators, where fuel is a large part of the running costs, to remain profitable while at the same time their full-load hours dwindle. This doesn’t necessarily have to be more expensive for the system as a whole.
In a changing energy landscape we don’t need to stick to past market solutions. See e.g. this presentation (1), this slide-deck that appears to cover the presentation well (2) and the website (3).
On another note, the claim of non-dispatchable RE’s being worth less completely ignores the huge external cost of current dispatchable (fossil) generation in terms of health-, climate change-, agricultural and other costs (4).
1) https://www.youtube.com/watch?v=kp0tQl_FtaA
2) http://www.eq-cap.com/wp-content/uploads/forum-2013/Hal-Harvey_Equilibrium-Capital-Forum-2013.pdf
3) http://americaspowerplan.com/
4) http://www.eea.europa.eu/data-and-maps/indicators/en35-external-costs-of-electricity-production-1
There’s a reason for that. Those putative external costs are not quantifiable. At the moment, they’re just guesses. Also, we don’t have much of an idea of the external costs of wind and solar either. How much are bats and raptors worth? Is infra-sound pollution a real problem? Will large scale wind farms alter weather? And that’s just wind. Solar will have its own problems.
DeWitt, that’s a silly argument. There are several assessments of external costs of energy production, I linked one. Granted, they’re not exact but that doesn’t mean we should ignore them. Should we ignore CO2 emissions because the climate sensitivity (equilibrium or transient) is not exactly quantified?
DeWitt Payne wrote: “Those putative external costs are not quantifiable. At the moment, they’re just guesses.”
We can’t even be sure of the sign: the external cost of CO2 emissions might well be a net benefit. Longer growing seasons, faster plant growth, shrinking deserts (paleo data indicates that deserts expand when the global climate is cooler and shrink when it is warmer, satellite observations seem to confirm that), more freshwater availability (more active water cycle), fewer weather related deaths (deaths from cold far exceed deaths from heat), less danger of return to a little ice age (or worse).
We can surely protect our cities, at reasonable cost, from 20 to 30 cm of sea level rise. Might be more of a problem for folks with beach front property; boo-hoo. Coral atolls will adjust themselves to sea level changes, as they have in the past.
My guess is that double CO2 is likely a net benefit. At triple CO2 I would be getting very worried about ocean acidification. At worst, that is a long way off; more likely it will never happen due to fossil fuels getting scarcer and new energy technologies being developed.
ontspan,
You’re missing the point. We have (very poor) estimates of the external costs of fossil fuels. We have even worse estimates of the external costs of renewables. Therefore it makes sense to ignore external costs for both when comparing them.
Your climate sensitivity point is silly. We could know the climate sensitivity exactly and we would still have such a poor estimate of the costs versus benefits of a higher average global temperature that we, as Mike M. points out, don’t even know the sign of the net. Your apparent assumption that the costs far outweigh the benefits is not supported by what I consider credible evidence. As I said, it’s mostly guesswork by people with agendas.
According to EWEA Annual Statistics 2014:
I’m not sure where they got their estimates of cost. Perhaps from their own earlier report cited in this article, or perhaps from data from actual wind farm operators.. in any case it works out to €1,100 – €1,600 / kW nameplate.
This indicates that costs are not going down, if we compare it with the data from several years ago.
From 2007 – Impact of wind generation on the operation and development of the UK electricity systems, Strbac et al (2007):
Today £1 = €1.37 and in mid 2007 the rate was €1.47. This indicates that in 2007 the UK installation cost in Euros was around €950, 20% below our estimates generally for Europe.
However, it looks like the capital cost in 2014, a little more than halfway to 2020, are if anything a little higher than they were.
If Strbac et al prove to be correct, the cost per MW of installed capacity in Europe will drop by 40-50% in the next 5 years.
This seems unlikely and is just another example of the difficulty of predicting future costs. But also a caution for the enthusiast that future optimistic predictions of cost reductions (along with emergence of new technologies) are often wrong. At the very least, you can’t take them to the bank.
The EWEA number you cite is onshore + offshore EU-wide, while Strbac differentiates between onshore and offshore and is UK only.
E.g. if we look a bit further in the EWEA report we see 10308MW new onshore @ €8.9bn to €12.8bn which translates to €860 – €1240 per MW onshore. But the EWEA number is for the entire EU, which includes lots of low-wind speed area’s compared to the UK.
The 1483 MW offshore was installed @ €4.2bn to €5.9bn, which translates to €2830 – €3978. Eeek! 8| What’s happening here?
Before 2007 there was less then 1 GW total offshore capacity in the EU. By 2012 this increased to 5 GW and subsequently installations went up from ~100 MW/yr in 2006 to ~1100 MW/yr in 2012. I find it hard to believe that this did not result in increased supply chain efficiency. On the flip-side, some European offshore wind farms are moving further into the ocean which adds costs.
I wouldn’t be surprised if high subsidies are distorting the figures as well.
ontspan,
You are correct – offshore was such a small % of the installed MW I didn’t dig further, but its very high price has a big impact.
So, this does mean that new onshore installations in 2013 are in the range of €860 – €1240/ MW. Which is reassuring. This means a cost reduction of perhaps 20% from 2009 to 2014.
So from now on, I’ll use €1M per 1MW nameplate for capital cost of wind turbines (installed).
The values given are nameplate. So wind speed has zero impact on the installed cost per MW.
The capacity factor (due to wind speed) has a big impact on the €/MWh value that will be realized down the track. This is why I wanted to break out capex cost for nameplate so we can get a better understanding of the real costs of various types of energy.
SoD, you are also correct. Wind conditions on-site have only little to do with installed cost per MW capacity. Sorry for making things more difficult then necessary.
When looking further, towards the cost per MWh, wind conditions and the capacity factor do really start to play a big role. Given a certain site and assuming for sake of simplicity equal installed cost, a modern turbine with a capacity factor of 40% instead of 20% for older types produces at half the cost.
Political factors in many liberalised electricity markets are causing a focus on parameters other than LCOE. It may not be sensible but we regularly see our media being impressed by numbers such as “Denmark produces 140% of power generation from wind”. Rarely do we see the actual carbon abatement cost quoted.
From the 2015 edition of the IEA’s Projected Costs of Generating Electricity LCOE is calculated by summing all plant-level costs (investments, fuel, emissions, operation and maintenance, dismantling, etc.) and dividing them by the amount of electricity the plant will produce, after an appropriate discounting.
The LCOE represents the average lifetime cost for providing a unit of output (megawatt per hour, MWh) for a given capacity factor, often the average capacity factor achievable by the power plant or a common value typical of baseload plants.
In the rush to Variable Renewable Energy (VRE) we have lost sight of the aim of the game, namely to drastically reduce carbon emissions by around 2050 by circa 95% if we are to prevent dangerous climate change. If that’s not the aim then keep burning coal, gas and other hydrocarbons. We need to see the focus shift to the achieved carbon abatement cost and this needs to be compared with the system LCOE or supply cost.
Quoting the LCOE of wind is a nebulous exercise because wind does not represent a power generation system. It forms a part of a hybrid system that includes its hydro or fossil fuelled backup and should also include transmission costs. Quoting the LCOE of wind tells us nothing about why Germany has the second highest electricity prices in Europe or why South Australia has the highest electricity prices in Australia. Wind taken alone has a very low LCOE however it’s impact when its use is mandated in a liberalised market drives the electricity prices sky high.
Therefore we need to focus on:
1. LCOE of the system supply
2. Carbon abatement cost of the system
Robert,
I would guess (haven’t researched it) that the reason for high electricity prices in high wind markets is:
– additional transmission costs
– “feed-in tariffs”
being paid for by the general consumer via higher prices.
So, if you add a lot of wind energy and the wind farm operator only pays for land, installation, connection to the (nearby) grid – and gets some guaranteed “above market price” $/MWh – then the consumer electricity price must rise to pay for the cost of building lots of new transmission and the cost of paying the operators above market.
Boccard stated in 2009:
Capacity factor of wind power realized values vs. estimates, Nicolas Boccard, Energy Policy (2009)
Bond, T. C. et al, 2013, Bounding the role of black carbon in the climate system: A scientific assessment, JOURNAL OF GEOPHYSICAL RESEARCH: ATMOSPHERES, VOL. 118, 5380–5552, doi:10.1002/jgrd.50171
Global greenhouse gas emissions from electricity are 26% of the total – fossil fuels more generally are some 57% of the total – the latter about equal to the forcing from black carbon. Reducing emissions from electricity generation with high cost and unreliable technologies does practically nothing – and seems likely to exacerbate other pressures. It cannot rationally be anywhere near a comprehensive response.
Quite apart from the fact that all of the pontificating about ‘dangerous climate change’ is utter nonsense.
e.g. – https://scienceofdoom.com/2015/09/01/renewables-viii-transmission-costs-and-outsourcing-renewable-generation/#comment-106185
As far as I can see we have the perfect storm of incompetent science and insane policy.
.
To scienceofdoom
I suggest you look at the presentation by Professor Tony Owen shown in the following link. Its written using economists language and can some of the graphs take time to understand.
Click to access tony_owen_ea_27march2013.pdf
I like to think of the impact of wind in the following simple way. We have in Australia a liberalised national electricity market (NEM). We also have a mandatory renewable energy target (RET) which requires that a portion of all power purchased in the NEM comes from renewable sources.
The people generating wind know that where the RET is not fully subscribed or used up, their power will be purchased and so their initial prices will include all their annualised financing, overhead and profit. After they have sold that power and secured their business, the next unit of electricity they sell costs nothing BECAUSE their fuel is FREE. They can even bid at negative values to keep their power being accepted.
What is worse however is that while they keep generating, the gas plants keep operating to fill in between the peaks of wind energy and so we actually have very little carbon abatement. I doubt a wind/gas turbine hybrid can ever get under 400 gr CO2/kwh especially if we fully account for upstream fugitive emissions.
The coal power generators or anyone with high capital financing costs are then in a perilous position because wind and solar can price into the market at very low prices regardless of their LCOE. They have already covered their costs because of the existence of the RET.
And so, the consumers get to pay for:
1) Wind generation costs
2) Gas turbine generation costs with reduced efficiency and opportunistic pricing
3) Additional transmission costs
They are also sitting ducks for further increases due to the gas resource being exported.
Robert Parker,
That is correct. The wind power producers get guaranteed sales of all they produce while other producers get to sell less electricity with no reduction in capital costs. So the other producers need to raise their prices, in addition to your three items. I’ve seen those extra costs called “imposed costs”. Wind power looks almost competitive, but the customer and/or other producers are providing a large hidden subsidy, in addition to the explicit subsidies. There is a report on this titled “The hidden cost of wind electricity” at http://eelegal.org/; it can be found under the “policy” tab. I will look at the Tony Owen presentation with interest.
I wonder, if the the American Tradition Institute feels so strongly about taking into account the hidden costs of electricity production, why doesn’t it do so for traditional electricity sources?
It’s not like wind is the only form of generation that does not include all costs in the electricity production price:
http://wwws2.eea.europa.eu/data-and-maps/figures/estimated-average-eu-external-costs/Fig2/image_large
Source: http://www.eea.europa.eu/data-and-maps/indicators/en35-external-costs-of-electricity-production-1
Mike,
I started reading The hidden cost of wind electricity. It’s not clear that the author(s) understand the basics. When they talk about what type of plant backs up wind.. well, what kind of plant backs up nuclear plants when they go offline? The answer? That’s not how the grid operates. There aren’t “allocated power stations” or “allocated types” for outages of particular plants. There is reserve plant that the grid operator contracts with to ensure they match supply with demand – to cater for unexpected demand increases and for unexpected outages. The reserve could be steam plants, gas plants and/or coal plants – although there will be preferences based upon economic differentiators..
They do make the same points as in this article (and previous ones) – transmission costs and intermittency costs are important – and not factored into the base cost of major expansion of wind power as far as LCOE is concerned. (As already stated, I am not a fan of LCOE).
Then again, if we look at the AMEO report on 100% renewables in Australia we find they did try and factor all of that in and put a price on it. Obviously I have issues with some of it. But they didn’t ignore transmission, they allocated $25BN for it.
Anyway, the start is not promising – the hatchet job that needs to be done on superficial work, but possibly ignorant of standard work and large amounts of research.. I guess I am wondering if we are going to find gems in it?
SoD,
“The hidden cost of wind electricity … When they talk about what type of plant backs up wind”
Definitely not the best choice of wording. Their meaning is that when you introduce wind, you reduce the amount generated by conventional plants but not the capacity required of those plants. So the “type of plant that backs up wind” is the “type of plant that has its capacity factor reduced in order to accommodate wind”. They consider two cases: coal and gas.
The analysis is indeed superficial. I read it as a first cut at the problem to identify issues. I have not seen those issues addressed carefully anywhere (which does not prove such analyses are not available). For that reason I find it very useful. The simplifications sometimes are done in a way favorable to wind and sometimes not; so I it seems to me to be an attempt at a fair analysis, not a hatchet job. I would welcome direction to better analyses.
Mike,
Every paper and serious review I’ve read about wind energy seems very clear that there are “extra” costs arising from:
– intermittency (requiring less efficient generation from reserves)
– adding transmission (or increasing existing transmission)
– non-synchronous limitations leading to curtailment
Reading the first part of the E&E document was as if this writer was the first to point all this out.
Perhaps it’s my baggage. Many people write about climate science attacking simplistic ideas that are sometimes teaching models, and sometimes real people’s actual ideas but they are people who don’t understand the subject so well. It’s clear that the hatchet jobs have never read a complete textbook and never read relevant papers and believe they are “onto something” that actually everyone already knows. This latest E&E document seems to be “in the same genre”.
Hopefully, if they do have some gems, you can draw on their work and use it to add to the sum of knowledge discussed here.
Example within the genre of climate science: “Climate science ignores convection and teaches that the atmosphere radiates as a blackbody – these are not true” – citations to demonstrate the misunderstanding of climate science, if any, are a website with a nice simple teaching model, or a website where some well-meaning person with a limited understanding has explained a few basics badly or incorrectly.
Where do you start? It’s almost twice the work. The actual points explained are sometimes true, sometimes not quite right, sometimes completely wrong. But with reference to a flawed understanding of where the science really is. No reference to a standard textbook or a key paper. That is, said hatchet-wielder has not read basic textbooks or review literature.
Like I say, maybe it’s my baggage.
Mike,
Examples from “the literature”.
This was literally the first paper I opened after searching Google Scholar for papers on the topic of “cost of intermittency wind energy” for papers after 2010 (after consideration that all of the references in Gross et al 2006 were too long ago):
COMPARING THE COSTS OF INTERMITTENT AND DISPATCHABLE ELECTRICITY GENERATING TECHNOLOGIES, Paul L. Joskow, EUI Working Papers (2011)
This was the second:
Overview of wind power intermittency impacts on power systems, M.H. Albadi & E.F. El-Saadany, Electric Power Systems Research (2010)
Basically, after reading 30 or so papers on wind energy they all capture these essential points – assuming that they cover this general area of interest. (E.g., if the paper is “Turbulent Character of Wind Energy”, Milan et al, 2013 then it’s likely that the above issues are not so important).
Whether their analysis is good or bad is not so much the point, we will dive into those questions. But they aren’t ignored.
SoD,
You wrote: “Every paper and serious review I’ve read about wind energy seems very clear that there are “extra” costs arising from:
– intermittency (requiring less efficient generation from reserves)
– adding transmission (or increasing existing transmission)
– non-synchronous limitations leading to curtailment
Reading the first part of the E&E document was as if this writer was the first to point all this out.”
Fair enough. I have not been reading the primary literature on the subject, so the Taylor and Tanton paper was news to me. And I think it was written for people like me, not as a contribution to the primary literature. In reading the more popular literature, including somewhat more technically oriented sources like IEEE Spectrum, one routinely sees the LCOE numbers cited as evidence that wind power is now economically competitive. This can even be the case when the author criticizes that conclusion; for example Rud Istvan’s post at Climate Etc. arguing that the LCOE numbers are misleading made no mention of most of the extra costs.
Prior to reading Taylor and Tanton, I was only familiar with the Gross et al. report. I found that to be a biased attempt to minimize the issues.
In addition to the three extra costs you list, there is an increase in fixed cost per kWh imposed on conventional generation due to reduced capacity factor. There is also the fact that wind might displace the cheapest and/or most efficient conventional power rather than the source that is most expensive at the margin.
“Perhaps it’s my baggage. Many people write about climate science attacking simplistic ideas … ”
I have the same problem with respect to much of the nonsense spouted by climate “skeptics”. But so far as I can tell, the Taylor and Tanton paper is not at all analogous.
Mike,
Fair enough, I will take more of a look.
Robert,
I will take a look at the presentation.
This is an important point/question that needs some evidence. Not that some plants are operating – gas plants, if they are short-term reserves, will be operating – but the proposition that during high wind power output, gas plant output is hardly reduced.
Do you have any numbers?
I plan to go looking.
Various people have attempted to answer that question, although I’m not sure how much real quality data exists.
I apologise if you thought I stated “that during high wind power output, gas plant output is hardly reduced”. My intention was to state that gas fills in all the troughs when wind doesn’t generate.
I suggest you look at the relative pricing data for South Australia versus the other states in Australia at the following site:
http://www.aemo.com.au/Electricity/Data/Price-and-Demand/Average-Price-Tables/Monthly-Price-Tables?year=2015
Robert,
This may be news to the punters out on the street, I can’t say, but it is well-known to anyone involved in power generation, transmission and distribution.
I maybe got the wrong idea from your earlier comment:
..because I don’t see why this means we have “very little carbon abatement”. If wind produces 500GWh of energy in the year then that is almost 500GWh of energy not produced by burning gas or coal. Zero emissions from those GWh – almost.
The “almost” is important. I explained more in Part I and also in IV – Wind, Forecast Horizon & Backups, including this comment:
So I probably understood your comment to mean that the energy efficiency of the gas-power generation was so bad as a result of being “on standby” that there was little benefit from the production of energy via wind.
Maybe you can clarify – if wind produces 500GWh, and we turned off coal-fired power stations for this production what do you think is the CO2 reduction?
From what I can tell so far on this journey, the answer is something in the region of 90% of the CO2 that would have been produced from a coal-fired power station. The value depends on i) the % penetration of wind in the grid and ii) the efficiency reduction of the typical reserve plants.
Let’s have a look at the electricity generation make up in Australia.
Wind and solar are still fairly minor sources. It resulted in a 10% increase in my electricity bill – the calculation is right there on the back of the bill. The vast bulk of the price increase is a result of much delayed grid upgrades. A 10% increase for 2% penetration doesn’t sound like a great deal – but not something to moan too much about. The increase results from preferential feed in tariffs. These no longer apply – but fair rules for distributing grid costs are still lacking. If someone wants to go off grid on their own dime – as the Americans say – I have no problem.
At this level – there is little risk of reliability problems. It can be usefully supplemented with peaking gas power or hydro. It actually makes economic sense to use as much solar or wind as is available as – without subsidies – this reduces the average cost of power. No fuel costs as you said. But there are very severe limits to practical penetration of these non-dispatchable sources.
Ironically we get all of our carbon mitigation – to 108% of 1990 emissions – from land use changes. Especially clearing laws – which in Queensland results in displacement of vast swathes of open forest with dense stands of woody weeds – with immense ecological risks. Not to mention the frenzy of clearing that occurred prior to the laws.
The Productivity Commission reported on regulatory regimes in respect of vegetation but the findings apply equally well to other environmental legislation. The Commission found that there are “several key underlying factors limiting their efficiency and effectiveness in promoting the delivery of the community’s native vegetation and biodiversity goals on private land.
1. Regulation of native vegetation clearing prescribes the means of achieving a range of environmental goals across different regions. However:
(a) there are likely to be other means of achieving at least some desired environmental outcomes at less cost (for example, well-managed pastures may also reduce soil erosion). Moreover, because the costs of regulation are largely borne by landholders, the cost benefit trade-off is obscured.
(b) environmental problems are complex, dynamic and geographically heterogeneous and will require innovative and adaptive solutions drawing on local as well as scientific knowledge. Across-the-board requirements for retention of native vegetation are rigid and preclude innovation. Indeed, retention of native vegetation in some areas perversely appears to be exacerbating some environmental problems; and
(c) ongoing management of native vegetation is essential to ensure its health and regeneration, but regulation of clearing focuses only on preventing its deliberate removal.” In addition to point (a) above, there are likely to be ways of producing better environmental outcomes in more flexible and cooperative regimes.
e.g. http://watertechbyrie.com/2015/06/06/economic-growth-and-environmental-management-in-a-global-iriai/
Why do you assume that? Just looking at the EU, I recently came across this article (1) about a proposal to use Loch Morar in Schotland as pumped storage which could contain up to 1800 GWh, 60x the current UK hydro storage capacity.
And considering the conservative option of two scenario’s, this EC study (2) sees potential for up to 3.5x the current capacity within the EU.
1) https://daryanenergyblog.wordpress.com/2015/06/27/loch-ness-monsters-of-energy-storage-2/
2) https://ec.europa.eu/jrc/sites/default/files/jrc_20130503_assessment_european_phs_potential.pdf
I guess, “tapped out” is not a question of topology but one of policy.
ontspan,
There is hydro capacity in many locations in developed countries available for energy storage.
This is different from hydroelectric power generation.
It is important to differentiate between the two. The first one can store energy produced elsewhere. The second can actually generate energy (and therefore can also store energy).
I’m sure also that there is some potential for more hydroelectric power generation. It is not completely tapped out, it is mostly tapped out. But while moving a few hundred thousand people to develop a hydroelectric resource might be an option in China, it’s not an option in most of Europe.
Voters, and all that.
ontspan,
To put the potential storage number in context..
The UK typical electricity consumption is about 30GW, and peak winter is about 60GW.
So one day’s energy storage on average is just over 700 GWh and for the worst day is just over 1400 GWh.
So if that conversion was done you could store 1.5-3 days of the UK’s energy.
I don’t see a cost for that civil work, probably needs a little cash to build it – do you have a number?
And you would also need to build transmission to take something like 30-60GW down to the population centers. So about 1000km with some “stop off points” – let’s say $30BN – $60BN for the transmission. It could be over $100BN.
This kind of storage capability could make a massive difference to the design of a renewable electricity network.
In fact, not wanting to jump ahead too much, but I can’t see a mostly or completely renewable network without massive intercontinental transmission and/or massive pumped hydro storage. More on that by part 30 or so..
SoD, you have used a high capacity factor of 90% for natural gas, to compare to wind. In the US the average capacity factor of natural gas plants is 26% but 27% for wind.
http://www.eia.gov/todayinenergy/detail.cfm?id=22832
Also you have claimed “Wind has a very low energy density, so requires a lot of land.”
I disagree. Almost all energy sources have a lower energy density than wind, with the exception of solar and nuclear power.
Overall capacity factors are affected by lots of things, as pointed out in your link, but which you appear to ignore. The overall capacity factor of natural gas produced electricity in the US is low because gas is used for back up power plants which aren’t intended to be base load as well as for combined cycle base load plants. According to this link, also from the EIA, natural gas fired combined cycle generators in the US had capacity factors of 47.8% and 48.2% in 2014 and 2013 compared to coal 59.7% and 60.9% in 2013 and 2014. Natural gas combustion fired turbines, on the other hand had capacity factors of slightly less than 5% for those same years.
Your opinion on energy density needs to be supported by some data to be taken seriously.
Am aware of all this and I’m familiar with the EIA data. But a capacity factor of 90% is on average reached by nuclear power plants only. Your data for the different types of natural gas fired plants should be used instead.
Data for the energy density for renewable energy source can be found here:
http://www.withouthotair.com
For example on page
http://www.withouthotair.com/c18/page_112.shtml
Ok, tidal energy has also a slightly higher density then wind according to this source.
Keep in mind, that the energy density of fossil fuels is far below that of wind energy, if you consider sea level rise.
Uli,
You wrote: “you have used a high capacity factor of 90% for natural gas, to compare to wind. In the US the average capacity factor of natural gas plants is 26% but 27% for wind.”
Wind is baseload power in that it is used whenever available. As a result, it displaces other baseload generation. So a correct comparison is with gas used for baseload; 90% capacity factor is perfectly reasonable.
The low average capacity factor for gas is not a property of the gas generators, it is a property of demand. Gas plants with low capacity factors are ones used only as needed to match variable demand. That is a role that wind can not fill now and likely never will be able to fill. Comparing wind costs to such plants is entirely inappropriate.
“Almost all energy sources have a lower energy density than wind, with the exception of solar and nuclear power.”
Nonsense. If you are going to make such an outrageous statement, you must back it up.
Uli,
My kettle has a capacity factor of about 1%. Why anyone would use a device with such a low capacity factor I can’t figure out..
I was simply making an illustration in the article. I could have used nuclear or coal or anything. And I haven’t yet made any comparison of the costs of wind with any other technology.
Most conventional plants – if there is demand for their power – have planned and unplanned outages that give them 80-90% availability across a year.
Do you think that gas plants run at 26% because they are just very unreliable? Or gas is some kind of highly unpredictable commodity?
When you make this kind of comment I think you either don’t understand anything I’ve written in this series of articles or are confused about the purpose of this series.
The purpose of this series is to try and understand the subject – not to try and be like politicians in a debate.
I hope readers can join me in the novel approach of trying to get to the bottom of how power grids work and of what the real costs, benefits and technical problems are for different types of power generation.
.. And on energy density I will write more in another article. When I put forward my numbers and evidence then you can explain my mistakes.
To scienceofdoom
You asked the following question and made the following conclusion:
Maybe you can clarify – if wind produces 500GWh, and we turned off coal-fired power stations for this production what do you think is the CO2 reduction?
From what I can tell so far on this journey, the answer is something in the region of 90% of the CO2 that would have been produced from a coal-fired power station. The value depends on i) the % penetration of wind in the grid and ii) the efficiency reduction of the typical reserve plants.
My response is:
1) If the grid penetration of wind is very low its highly likely no backup would have been deployed and the Variable Renewable Energy (VRE) would have had the effect of marginally increasing the delivery voltage and frequency. In this case the whole exercise was a waste of time and no CO2 reductions will occur because the coal power would have continued to operate.
2) If a planned hybrid system is in place still with sub 15% penetration, the energy regulator would plan on the wind being about 10% of its name plate and would plan on accepting gas energy. In the case of Australia, our NEM generates at about 970gCO2/kwh. The hybrid will generate at something above 400gCO2/kWh. I say “something” because its hugely dependent on the fugitive emissions upstream of the gas burner. At 7% losses for example the gas burner will have nearly double the emissions intensity of the original coal plant and so the hybrid system will probably make no CO2 equivalent saving. At 3% fugitive losses the hybrid will generate at about 400gCO2.kWh and so there will be about a 60% improvement.
3) At higher penetrations of wind, more gas backup and powered “spinning reserve” will be required and so I doubt you will improve on values between 60% and nil in terms of CO2 reductions.
4) I do not see how you could obtain a 90% reduction in CO2 for the reasons I have outlined UNLESS all the backup came from hydro or nuclear.
Your question is of course very hypothetical because we don’t just turn off coal power stations to receive 500GWh of VRE.
As an aside I suggest you look at the paper by DUNCAN SEDDON & ASSOCIATES PTY. LTD.which found that for wind farms performing at less than 32% capacity factor, more CO2 could be abated by decommissioning them and converting the open cycle gas turbine backup to combined cycle units with their higher efficiency
I don’t know what axe Duncan Seddon has to grind as a hydrocarbon consultant, but no rational operator will balance wind using an inefficient open cycle gas turbines alone. It sounds like a straw man argument.
ontspan,
To some extent, operators have no choice to but to balance wind with open cycle gas turbines. So your statement does not really have any value unless you have specific criticisms of the assumptions made in the Duncan Seddon papers. I just found them and have yet to study them myself.
I suppose the papers in question are the one at: http://duncanseddon.com/publications/
Robert,
1. Obviously when you have low renewable penetration you have low CO2 saving. No country is planning on just having a few %. But you do actually have some CO2 saving.
If one year you produce 400 TWh from burning stuff and then a later year you produce 380 TWh from burning stuff (95%) and 20 TWh from spinning things with wind (5%) you will have reduced your CO2 emissions. Yet you say “no CO2 reductions will occur because the coal power would have continued to operate“.
In this and earlier comments I see there is something in your conceptual picture of a power system that isn’t right. But I don’t know what it is.
2.
Why would they plan on the wind being about 10% of nameplate? What do you mean “plan on accepting gas energy”?
The grid operator is the one who contracts with different suppliers. If there is 15% penetration of wind, this means 15% of energy supply (annual average) is from wind. This is quite a high penetration of wind by current standards. Germany is at around 10%. Ireland is at 16%.
The capacity factor in Germany is very low, under 20%, the capacity factor in Ireland is around the highest in Europe at 31%.
But you are mixing up nameplate and output. The nameplate x capacity factor = energy produced. Germany has energy produced by wind = about 10% of the total energy consumption in Germany.
So, going back to our example of let’s say Germany with 10%: the grid operator doesn’t plan on wind being 10% of 10% = 1%, or 20% (actual capacity factor for Germany) of 10% = 2% they plan on – the forecast of wind output for the given period after gate closure.
This forecast output might be almost zero, or it might be 50% of the grid’s requirement for the next hour (UK grid operator uses 1 hour after gate closure, Germany may be 12 hours, it’s not relevant to the picture).
Armed with their forecast of wind power, and their contracts with baseload operators, and notices of any shutdowns, they also contract with other “standby” reserves to ensure they have sufficient to meet demand. Some of those plants will be “off”, but can start up quickly. Some of those plants will be running at some % of their maximum, with the capacity to quickly respond to increases or reductions in demand and that power produced will be used in energy supply.
..
Basically, your comments don’t make much sense so I’ll stop there.
But, as you pointed out elsewhere, you probably haven’t reduced CO2 emissions by all of that 5%. And it’s conceivable that the reduction could be a lot less than 5% if the reduction in burning stuff to generate electricity caused a significant decrease in the efficiency of burning stuff to generate electricity. At 5% penetration, it’s unlikely that any fossil fueled plants will be decommissioned.
That should be if the reduction in electricity generation from burning stuff caused a reduction in the efficiency of generation by burning stuff. So, in fact, nearly the same amount of stuff is burned.
I think the problem in communication may lay in how I see wind power operating. I see wind ALWAYS being a part of a hybrid system. At present it is the impact of the life cycle analysis of gas power that brings wind undone.
So I return to the points I made:
1) Generating wind at say 500TWh per year at say 1 or 2% penetration without gas backup will likely result in a whole spectrum of small packets of energy hitting the grid at sub-optimal times – often determine by a Renewable Energy Target policy. When they hit the grid, the system of baseload generation may be meeting demand quite stably and so the additional packet may result in an over supply manifesting itself as increased grid frequency and voltage. This is effectively a waste of energy and so there is no nett CO2 benefit – in effect the excess electrons are being dumped. At other times, say on a rising demand curve, the power may properly meet demand.
2) Regarding the issue of the regulator planning for wind energy. I refer you to the AEMO 2013 South Australian Electricity Report, Table 3-1 tells us that in SA wind makes up 23% of the generating capacity and delivers 27% of the energy by source. In Table 4-1 however the regulator recognises that in summer they have 711 MW available generating capacity but only assign 70 MW capacity reliability or 9.9%. This is where I got the figure of 10%. In winter the equivalent numbers are 941/75MW or 8.1%. That’s all they can reliably plan for with wind supply. Therefore in South Australia as Table 4-1 shows, they plan on gas supplying the rest.
3) The CO2 savings of generation of wind power at higher penetration levels are dependent on the life cycle analysis of the backup systems. If 100TWh of wind power requires the generation of 300 TWh of gas power for despatch reliability then its this 300TWh that will determine the CO2 output of the wind hybrid system. That’s why I say the hybrid will have more than 400 gr CO2/kWh. If the backup is hydro or nuclear operating in load following mode then clearly you have about a 95% CO2 saving.
4) You suggest I am mixing up nameplate with output but I think I clearly understand the difference.
5) The rest of your description of operating with grid management I fully agree with.
I’m not sure we disagree on anything – just the way we express it.
Robert,
This is “capacity credit”, as outlined in IV – Wind, Forecast Horizon & Backups.
Reliability of output, aka capacity credit, is a completely different parameter from saving CO2 emissions when wind power is actually displacing gas/coal power stations.
What you have to have “ready to start” or “running at 50%” or “ready to shut down if the wind kicks in” depends on
– the contract period after gate closure
– the forecast horizon (how good the wind forecast is over the contract period which in turn depends on the geographical spread of wind turbines and the statistics of wind),
– the kind of generating resource at your disposal
– the actual demand load at the time
Regardless of what you need to have available if no wind is blowing, when the wind is blowing you burn less stuff.
It’s kind of bizarre to think that if you shut down 1GW of gas plants for 24 hrs because the wind farms are all highly producing that instead of saving 24GWh of fuel burning somehow the “loss of efficiency” results in close to 24GWh loss via efficiency, or even 12GWh loss via efficiency.
There are plenty of papers referenced in Gross et al 2006, which is basically a literature review, that cover the cost impact of the lost efficiency. I haven’t reviewed them yet, maybe they are all rubbish, but they come up with figures (that depend on the penetration of wind into the network) in the range of £1-5/MWh = €1.4-€8/MWh or 0.14c€-0.08c€:
Basically the results are that for 1MWh of wind power generated you don’t save 1MWh of gas power generation, you save maybe 0.9 or 0.8MWh (I have to reread to get the actual values), depending on lots of these factors.
But I might make a review of this data our next article.
Baseload coal plants take days to ramp up and down – peaking gas plants take hours. Take the humble residential solar hot water system and compare it to my off-peak system. The latter is cheap, utterly reliable and uses baseload energy that would otherwise be wasted. The former uses back up heating by electricity – even if it is offpeak it uses less of the energy that would otherwise be load shed and more is wasted. So we have a complex and expensive system that doesn’t result in less base load generation. The same with wind power at night. If you are reliant on baseload coal – it keeps chugging away.
The perfect partner for wind is hydro. Hydro can spin up and down quickly and wind power can enable the water resource to be conserved and used
when needed.
see – http://www.hydroquebec.com/learning/eolienne/couplage-hydro-eolien.html
This is not about efficiency but matching load and generation.
http://www.eia.gov/forecasts/aeo/electricity_generation.cfm
LCOE provides a convenient measure of the competitiveness of generating technology. High penetration – as in the 80% scenario of the NREL – of non-dispatchable sources requires additional storage, grid extensions and backup power. Modelled using something like the Regional Energy
Deployment System (ReEDS). It would result in substantial increases in retail price.
http://www.nrel.gov/analysis/re_futures/
Extracts from papers in support of:
a) LCOE is not very useful once we consider intermittent renewables (briefly suggested in the article)
b) Papers on renewables don’t ignore the transmission costs and intermittent costs of renewables (discussed in the comments following the article)
c) There is a cost consideration for intermittent vs dispatchable energy (” “)
The Private and Public Economics of Renewable Electricity Generation, Severin Borenstein (2013):
—–
Large-scale wind power in European electricity markets : time for revisiting support schemes and market designs? Céline Hiroux (2009):
—
Comparing the Costs of Intermittent and Dispatchable Electricity Generating Technologies, Paul Joskow (2011):
– I didn’t have to go far to find these papers. That is, they are not some small minority, they are just the mainstream.
The US EIA includes estimates of transmission costs in the lcoe.
LCOE of wind and gas are similar. So we might as well go 100% wind? That of course will not remotely work. Real costs of high penetration of non-dispatchable sources need to a modeled at a system level. As in the NREL energy futures study cited above.
But you can eliminate some technologies – if you are looking for low cost systems – on the basis of LCOE. Shall we have a gas or nuclear plant at this location? The answer to this question is fairly clear – and is reflected in current investment decisions in the US – such as in recent ERCOT planning documents.
But decisions are often driven politically. Can I mention politics? Such as the announcement of several hundred million to be invested in large scale solar in Australia. Perhaps justifiable on the basis of external costs or fostering infant industry. This decision was justified on the basis of bringing down component costs – brackets, supports, construction and fabrication costs – other than the panel themselves. While this reduces the LCOE – it doesn’t reduce the costs of high penetration of non-dispatchable generation.
[…] In IX – Onshore Wind Costs we looked at the capital and O&M costs of building onshore wind power. We stayed away from converting the numbers into “Levelized Cost of Energy”, or LCOE, because it obscures too much – instead we just tried to get a rough idea of the costs. […]
[…] Renewables IX – Onshore Wind Costs […]
[…] Renewables IX – Onshore Wind Costs […]
[…] Wind Costs – we looked at the capex cost of onshore wind and (by the time we get into the comments) we find a current capital cost of about €1M per 1MW of (nameplate) capacity. There are lots of […]
“There are three main downsides to wind:…”
Just those 3? How can any sort of environmentalist discuss wind power’s downsides without mentioning the huge cost of visual blight, noise and bird/bat mortality? Your analysis is completely detached from nature itself. Too much bean-counting without any soul.
Here’s what’s really going on out there: