I’ve been digging through some statistics for my own benefit.
When you read or hear a statistic that country X is generating Y% of electricity via renewables it can sound wonderful, but the headline number can conceal or overstate useful progress. A few tips for readers new to the subject:
- Energy is not electricity. So you need to know – were they quoting energy or electricity. For most developed nations, electricity accounts for something around 40% of total energy.
- “Renewables” includes two components that are important to separate out:
- hydroelectric – this is “tapped out” in most developed countries. If the “share of renewables” is say 30%, but hydro is 20% (i.e. 2/3 of the total renewables) then the expandable renewables are only 10%. This can help you see recent progress and extrapolate to possible future progress (different story in developing countries, but there is often a large human cost to creating hydroelectric projects)
- biomass – if you stop burning coal and you burn wood chip instead this tips the reporting scales from “the work of Satan” to “green and renewable”, even though burning wood chip generates more CO2 emissions per unit of electricity generated. Not all biomass is like this, but as a rule of thumb, put the biomass entry into the “more investigation needed” pile before declaring victory
- Nameplate is not actual – if you have a gas plant (designed to run all the time) the actual output will be about 90% or more of the nameplate (the maximum output under normal conditions), but if you have a wind farm the actual output across a year will be about 20% of the nameplate in Germany, 30% in Ireland and over 40% in Oklahoma. So if you read that “10GW of wind power” was added to Germany’s generating capacity you need to mentally convert that to about 2GW. Similar story for solar – there is a conversion factor.
If you mentally take account of these points when you hear an update, you will be with the 1% of journalists who could pass the literacy test on the progress of renewables. It’s an elite club.
Once again I’ll state that I’m not trying to knock renewables, I’m trying to promote “literacy”. Instead of hapless cheerleaders, think informed citizens..
So, onto recent data.
I’m using two stalwarts of energy reporting: IEA and BP.
IEA produce data to 2015 and quote useful units like electricity consumed in TWh. This is a unit of energy – a TWh is a billion kWh. You find kWh on your electricity bill.
BP produce data to 2016 – which is better – and breakdown renewables much better, but quote units of Mtoe – millions tons of oil equivalent. If you delve into energy industry reports, you often find mixed together in one report: kWh/TWh (energy), GJ (energy), GW (power), tcf (volume of gas), barrels of oil, mmBtu (energy in obscure British units)..
In the case of the BP report it’s not clear to me how to convert from Mtoe to GWh – they do provide a footnote but when I do the conversion I can’t reconcile the numbers using their footnote. No doubt one of our readers has gone down this rabbit hole and can illuminate us all (?). In the meantime, I took the BP numbers in Mtoe and looked up IEA % values for 2016 in TWh and worked out a conversion factor – multiply Mtoe by 0.0045. Then cross-checked with Fraunhofer ISE for Germany. This allows us to see the BP 2016 renewables breakdown in real electricity units rather than in mythical barrels of oil.
Another note – I’m not trying to generate exact figures. Every source has different values. Reconciling them is a big undertaking and very uninteresting work. I’m simply trying to get some perspective on actual renewables progress.
I don’t quote nuclear energy statistics in this article. It’s very low carbon emission, but not exactly “renewable”. The real reason for not including the numbers is that most developed countries are not significantly expanding their nuclear generation, and in Germany’s case are shutting it down. China is a different story, with a big nuclear expansion ongoing.
Germany v US
You would think that Germany, one of the leading lights in renewable energy, would be greatly outperforming the US on CO2 emissions reduction.
- 2005 – 2015 German CO2 reduction = 0.9% p.a
- 2005 – 2015 US CO2 reduction = 1.1% p.a
Over that time period the German population has stayed the same, while the US population has grown by about 9%, so we can adjust the US reduction to about 2% p.a on a per capita basis.
Now the US emissions peaked in 2005. You actually don’t need to read a report to find that out because when the US commitment to reducing CO2 emissions was announced in Paris in 2015 the commitment was a reduction “from 2005”. Being cynical about politicians never loses, and sure enough (when checking data in a report) the peak was 2005 – and the reduction from 2005 to 2015 was already about 12%.
Germany’s emission peaked in 1990 so I believe their commitment is always referenced to 1990. The story I haven’t verified is that after the collapse of the Soviet Union and the re-unification of Germany, lots of dirty heavy industry shut down and this was a big help in emissions reductions.
The US reduction looks to be – in part – due to the embrace of natural gas due to its recent very low cost (gas produces about half the CO2 of coal for the same electricity production). This is a result of the current revolution in “unconventional gas”.
When we look at CO2 emissions per kWh in 2016 the story is also surprising:
- Germany – 1.3g CO2/kWh
- US – 1.2g CO2/kWh
So this tells us that the GHG efficiency of electricity generation is effectively the same in both countries, slightly better in the US.
When we look at total usage (across all electricity generation, including industry) the story is what we might expect:
- Germany – 19 kWh per person per day
- US – 35 kWh per person per day
This tells us that the US uses almost double the electricity per person.
Changes in Renewables
I looked up a few other countries – Denmark, the UK and Spain because they have a big push into renewables; and China to contrast a rapidly developing country. The last column in the table, Total Produced, is total electricity produced from all sources, including fossil fuels and nuclear.
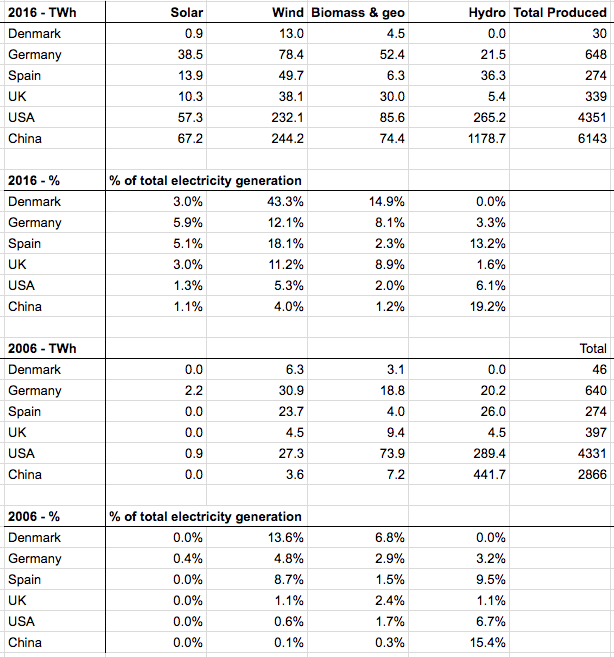
From BP data
The IEA values (not shown) give lower total electricity for each country. The BP figures are electricity produced and IEA figures are electricity consumed. The solar + wind value for Germany in 2016 moves from 18% to 20% of total if I use the lower IEA total.
I also looked up electricity prices in the IEA report and while I have values for 2016, I don’t have comparable values for 2006. I couldn’t find the 2006 or 2007 version of the report. Based on a variety of websites all using different methods, quoting in different currencies and from unverified sources (so not reliable) the average consumer price in Germany has gone from about 19c/kWh to 33c/kWh from 2006-2016 (US$). The US looks almost flat, perhaps from 12 to 12.5c/kWh. UK from 14 to 21c/kWh. The IEA report didn’t give a figure for Denmark.
So Germany produces about 18% of electricity from solar + wind. Its total renewables are 30% if we include biomass, and about 21% if don’t include them. As I mentioned at the start, biomass sometimes includes burning “renewable” wood chip instead of fossil fuels. Biomass is a (big) subject for another day with numerous problems and I haven’t looked at the breakdown.
The Denmark figure for total electricity is probably quite misleading – see the huge reduction in electricity production from 46 TWh to 30 TWh over 10 years. On wikipedia someone has provided a better breakdown, showing consumption as well and the consumption has dropped by just 4% over that time. Also 2006 appears to be a big outlier in electricity production. Denmark is a country connected to neighboring grids and generating lots of wind energy. So Denmark’s 2006 real figure for wind was about 20% of total consumed (not 14%) and has gone up to 43% over 10 years. On this basis Denmark could be at 80% of electricity generation by wind in 2035.
Confusion
When looking for electricity price changes, here was a random site I came across, Economists at Large:
By June 16 this year electricity generated from solar and wind power accounted for a record 61% of total electricity generated in Germany.
The actual figure for 2016 is about 18%.
If I went looking I’m sure I could find lots of sites, including “reputable” media outlets, with wide ranges of inflated figures. It’s very easy to generate confusion – quote a peak daytime value like this “Germany’s renewable output was …%… on May 28th at 1:15pm” and wait for the recyclers of mush (this includes “reputable” media outlets) to propogate it in a new way. Or quote growth figures – as in how much has been added this year. Or quote capacity added, and rely on the fact that no one understands that 10GW of wind farm only generates about 2GW on average of output in Germany. And so on.
I realize young people may expect media outlets to “fact check” but that is not their job. Their job is to generate headlines and have their stories quoted more widely.
Also, if you pay zero for your electricity because you have solar power you might think that you are generating all of your own electricity. Most of the time you would be wrong. Various governments have guaranteed feed-in tariffs for rooftop solar at well above market price.
Basic energy literacy means understanding the difference between these items.
Conclusion
I was just trying to find the core statistics for my own understanding and was especially interested in Germany.
For Germany, we could look at the 3.5x increase in solar + wind in a decade and say “amazing”. Alternatively, we could look at going from 5% to 18% of total electricity generation in 10 years and say that to get to 80% of electricity production will take another 40-50 years at the same rate and say “disappointing”.
Remember that electricity is only about 40% of energy use in most developed countries. Therefore, if you want to decarbonize the whole economy you also have to boost your electricity supply by 2.5x and switch over heating, transport, etc to electric supply.
At the moment, there are currently issues with increasing “non-synchronous” generation beyond a certain point (see V – Grid Stability As Wind Power Penetration Increases). If you read spruiking websites you will find two common suggestions, first “people said we couldn’t get past 10% and now we’re already at 20%” and second “look at Denmark”. If you like happy stories probably skip the rest of this section..
The most helpful textbook I found on the topic was Renewable Electricity and the Grid : The Challenge of Variability written by people who are trying to do it. Long story short, integrating wind energy is very easy at the start, and up to about 20% of total supply on average it doesn’t seem to present a problem. Above 20% there are questions and uncertainties. These are electricity generation and grid experts contributing to the various chapters.
The key point is that grid stability can come from who you are connected to and how.
Denmark, while a country, is really just the size of a large city (population 6M) connected to the rest of Europe and this connection provides their grid stability. Denmark produced 43% of their electricity from wind in 2016 but this is a much lower % of the grid that it is connected to. The question is not “can one small country connected to nearby large countries produce 80% of electricity from wind?” but instead “can the interconnected grid produce 80% from wind?” The answer to the first question is of course yes. The other countries provide grid stability to Denmark. When all the surrounding countries are producing wind energy at 80% of the total inter-connected grid it will be a different story.
However, this is not some fundamental physics problem, it’s an engineering problem that I’m sure can be solved. I haven’t dug in much beyond the references in Part V (referenced above) so I don’t know what issues and costs are involved.
Other Articles in this Series
Renewable Energy I – Introduction
Renewables II – Solar and Free Lunches – Solar power
Renewables III – US Grid Operators’ Opinions – The grid operators’ concerns
Renewables IV – Wind, Forecast Horizon & Backups – Some more detail about wind power – what do we do when the wind goes on vacation
Renewables V – Grid Stability As Wind Power Penetration Increases
Renewables VI – Report says.. 100% Renewables by 2030 or 2050
Renewables VII – Feasibility and Reality – Geothermal example
Renewables VIII – Transmission Costs And Outsourcing Renewable Generation
Renewables IX – Onshore Wind Costs
Renewables X – Nationalism vs Inter-Nationalism
Renewables XI – Cost of Gas Plants vs Wind Farms
Renewables XII – Windpower as Baseload and SuperGrids
Renewables XIII – One of Wind’s Hidden Costs
Renewables XIV – Minimized Cost of 99.9% Renewable Study
Renewables XV – Offshore Wind Costs
Renewables XVI – JP Morgan advises
Renewables XVII – Demand Management 1
Renewables XVIII – Demand Management & Levelized Cost
Renewables XIX – Behind the Executive Summary and Reality vs Dreams
References
BP Statistical Review of World Energy June 2017
BP Statistical Review of World Energy June 2017 – Renewables Appendices (this is a separate pdf)
IEA Key world energy statistics 2017
Renewable Electricity and the Grid : The Challenge of Variability, Godfrey Boyle, Earthscan (2007)


“For most developed nations, electricity accounts for something around 40% of total energy”. No. It’s somewhere between 20% and 25%. See for instance wikipedia.
According to the US IEA, in 2016 the energy sector was responsible for 39% of the total primary energy consumption.
https://www.eia.gov/energyexplained/?page=us_energy_home
When you refer to a source, you should include a link to the source you used.
DeWitt ,
I think we both found the same page at the same time (and you meant the electric power sector):
In their graph they helpfully give the amount of total energy as 97 quadrillion BTUs. Not x TWh or GJ.
When I calculate that it out it comes to 28,400 TWh and the total electricity is 15% of that. Of course, now we need to consider the overall efficiency of electricity generation (i.e. energy into the electricity sector rather than electricity out) and so that is probably how the number ends up as 39%.
Jos,
On this site, rather than “see for instance, the internet” we do look for commenters to do some work and find + verify some data.
Jos Hendriks,
With respect to the 40% vs. 20%, it depends on how the accounting is done. Let’s say you burn 12 MJ worth of gas to heat homes and 8 MJ of gas to make 4 MJ of electricity. 40% of the gas burned went to make electricity. But 25% of the energy used (4 MJ out of 16 MJ total) was in the form of electricity. So is electricity 40% or 25% of the total? Some sources do it the first way (usually labelled ‘primary production’) and some do it the second way (‘end use’, I think).
It gets worse when you consider different sources for electricity. Let’s say you replace the 4MJ from your gas plant with 4MJ from nuclear. End use does not change. But is primary production still 20 MJ or is it now 16 MJ (12 MJ gas + 4 MJ nuclear)? Some do it one way, some the other. Confusing.
It’s certainly hard to find a consistent answer. Perhaps the different percentages are partly explained by using *supply* vs *consumption*, which are very different numbers. The US may be a bit of an anomaly in this matter (they love their juice).
In 2014, world primary energy *supply* amounted to 155,481 terawatt-hour (13699.13 Mtoe). About 23,816 terawatt-hour (2483.47 Mtoe) of this number was in the form of electricity. This represents 15% in 2014.
World primary energy *consumption* was 109,613 TWh in 2014, about 29.5% less than the total *supply*. That because much of the energy that is acquired by humans is lost as other forms of energy during the process of its refinement into usable forms of energy and its transport from its initial place of supply to consumers (i.e. losses to refining & transport). This represents 22% in 2014.
Source: “Key World Energy Statistics” (PDF). IEA. 2017-05-28. p. 38.
Click to access KeyWorld2016.pdf
Also, I’m confused by “multiply Mtoe by 0.0045”. It says nearly everywhere that:
1 Mtoe = 11.63 TWh or 1 TWh = 0.0859 Mtoe
1 Quad BTU = 293.07 TWh
https://en.wikipedia.org/wiki/World_energy_consumption
cloudpoint ,
I found the same conversion factor for Mtoe to TWh at the end of the report. But when they quote solar consumption (and other renewables) in Mtoe they have this footnote:
This generates kWh numbers that don’t match the published figures.
I found the following quite interesting:
Buffering Volatility: A Study on the Limits of Germany’s Energy Revolution
http://www.hanswernersinn.de/de/2017_EER_Buffering_Volatility
pdf: http://www.hanswernersinn.de/dcs/2017%20Buffering%20Volatility%20EER%2099%202017.pdf
I don`t know how realistic these storing ideas for Germany are.
” Germany would need most of the stored energy from November through March, because this is when the stores empty quickly, but this happens to be when Norwegian dams are rather full, as most of the rain in Norway falls from September to December.34 Conversely, there would be German excess energy available for filling the dams from April to August. Thus, the problem of insufficient free storage space does not seem to be serious.”
Dams are often quickly empted throughout the winter, and rely on snow melting in the spring, often to empty again in dry summers. So I don`t think the stored energy would be enough for both Norway and Germany in the winter. And the filling during the summer might not be enough.
Prices are set according to the amount of water in dams in november, the precipitation in the winter, and the snow amount in mountans. So there could also be some economical complications.
I noticed that there is no mention of the Jacobson, et.al. (2015) favored energy storage system, CSP-PCM (Concentrated Solar Power – Phase Change Material), for achieving 100% renewable electricity in the continental US. Maybe Germany is too far north for that to work. Or maybe Clack, et. al.’s critique of Jacobson is correct. Unless no judge will accept Jacobson’s libel suit, it will be decided in court.
https://www.washingtonpost.com/news/energy-environment/wp/2017/11/01/stanford-professor-files-libel-suit-against-leading-scientific-journal-over-clean-energy-claims/
krmmtoday,
A very interesting paper, thanks.
Just a note that my comment on limits at the end of the article were about the grid stability. I didn’t comment on how to backup the volatility – I’ve discussed that in many previous articles. I just made the assumption that Germany (and any other country seeking a high % of renewables) can buffer the volatility of wind farms with gas plants. These burn fossil fuels to generate power, but only when needed.
Whether or not there is a more economic solution in pumped hydro is a practical question, based on cost (and perhaps some ideology as well).
In the previous article – XIX – Behind the Executive Summary and Reality vs Dreams – we looked at a UK report and there was the hint there (in the report) that reaching 80% from renewables by using gas plant backups was problematic. But they didn’t show any calculations.
There is also the option to ‘overbuild”. This was discussed in XIV – Minimized Cost of 99.9% Renewable Study.
… and on that subject, Denmark & Germany are getting backup for their wind power volatility from their European grid connections.
Some European power sites:
BRD power:
https://energy-charts.de/exchange.htm
DK power:
https://www.energidataservice.dk/en/
FR power:
http://www.rte-france.com/en
GB power:
http://www.gridwatch.templar.co.uk/
http://gridwatch.co.uk/
I want to highlight this paper, suggested by krmmtoday – Buffering volatility: A study on the limits of Germany’s energy revolution, Hans-Werner Sinn, European Economic Review (2017).
Well worth reading for everyone interested in the challenge of expanding Germany’s renewables to a much larger fraction of their electricity supply.
Worth an article by itself, although most of his general points have already been covered in this series.
One of the interesting comparisons was the feed-in tariff’s role in increasing the overall cost of electricity. Here is his comment:
Now going somewhat off topic, this is why economists mostly favor a “Pigovian tax” instead of a complex network of subsidies. That is, if you are going to promote renewables, then a long-term carbon tax makes the most sense. This is more likely to result in the most cost-effective solutions to the problem being promoted. It gets entrepreneurs putting their own/their investors’ money into solutions that will solve the problem – vs the government effectively picking what they believe is the right technical solution. This gives much more incentive to entrepreneurs to make nuclear fusion work, to invent a new battery technology and so on.
Then there’s this point:
The Alternative for Germany party (AfD), one of whose goals is to end the Energiewende immediately, received 13% of the vote in the last German election. A new study from the RWI Leibniz Institute for Economic research finds that 61% of Germans wouldn’t want to pay even €0.01 more per kWh to fund more renewables. (Lead editorial, Germany’s Green Energy Meltdown, Wall Street Journal 11/18-9/2017 (pay walled) On top of that, Germany isn’t going to meet its carbon emission reduction goals either.
For the record:
https://en.wikipedia.org/wiki/World_energy_consumption
first table (world)
For an impression of the USA:
https://yearbook.enerdata.net/total-energy/world-consumption-statistics.html
Click on USA and look at the ring in the picture, certainly no more then 20% of the energy used in USA is in the form of electricity.
For me it looks like your story is about energy consumption.
quote:
“Remember that electricity is only about 40% of energy use in most developed countries. Therefore, if you want to decarbonize the whole economy you also have to boost your electricity supply by 2.5x and switch over heating, transport, etc to electric supply.”
The 40% should be 20% and 2.5x should be 5x
By the way it means also that electricity production efficiency is about 50%
Correct, the article is about energy consumption, not electricity consumption. The total energy input is important.
Nope.
I forgot: ” It is always worse then you think”
@De Witte Payne
Thanks for the correction. And my compliments for all the good work you are doing!
Sure there is always a “catch”. For instance if you compare a diesel car with an electric one the efficiency might be better for the electric car even including the energy used for transforming ” something” to electricity. But for heating purposes not so.
SOD, Thanks for this post. I’ve been seeing a lot recently various statements such as “solar is already much cheaper than fossil fuels.” Just wondering if you have a post analyzing these cost issues. Thanks
I haven’t looked at solar cost yet.
I did compare wind farms with gas plants and showed the working out – XI – Cost of Gas Plants vs Wind Farms. I was reminded that an update would be useful when I saw the cost of gas had come down so much in Germany (this is from the 2017 BP report):
For the German price of around $5/GJ, the operating cost of gas over wind will be about $20/MWhr.
The capital cost (based on a capacity factor of 25% which is higher than the German average of below 20%) works out to be $48/MWh lower for gas vs wind. The value was based on a 20 year life and an 8% capital cost. It’s easy to see that gas plants last a lot longer than that, but not sure about wind, so to me this is a little pessimistic for gas.
So overall wind power costs $28/MWh more than gas – this is with a more favorable assumption about wind’s capacity factor than is actually achieved in Germany.
Wind, as with solar, very much depends on where it is located – you can see in the linked article that wind power in Oklahoma, at an average of 41% capacity factor, reduces the capex cost from $58/MWh to $35/MWh.
This reduction of $23/MWh would put wind in Oklahoma at about the same cost as gas power in Germany (gas power in the US is cheaper than Germany due to the $3/GJ in US vs $5/GJ).
It also depends on whether you have to build new transmission lines, and whether the wind or solar is a small fraction of the grid output, or a large fraction.
When it is a large fraction other costs are incurred – you need to keep backup generating capacity on standby and ramp it up and down, which reduces its life.
You can read that wind is cheaper than fossil fuels and that solar is cheaper than fossil fuels. People repeat other people’s claims, no evidence needed.
I see claims that the cost of generating solar electricity, based on bids in Mexico, are on the order of $20/MWh. But something looks fishy with the money. The bids include renewable energy credits, but it’s not at all clear to me who gets them. REC’s are worth money, I think. So if the bid is $20/MWh in cash plus REC’s, then the cost of the electricity is probably more than $20/MWh, I think, depending on how much can be realized from the sale of the REC’s. I’m not sure, though. The internet pages read like press releases, not analysis.
For example: https://www.zmescience.com/science/dubai-solar-cheap-55116/
In comparing Germany to USA, it would also be useful to look at the contribution that nuclear makes to the electricity sector. My understanding is that Germany is trying to reduce FF generation and at the same time reduce nuclear generation, making the task somewhat more difficult.
Phil,
I calculated the figures for nuclear:
2006 – Germany 27% USA 19%
2016 – Germany 13% USA 20%
In the meantime, Germany has increased solar+wind by 13% of total generation so their huge effort has been cancelled out by the nuclear drop so far.
Fast forward to 2026 and they might still be in the exact same position on CO2 emissions – another 13% drop in nuclear (to nothing) and maybe a 13% increase in wind + solar. Actually getting an additional 13% will be tougher..
As far as German household energy use, it makes very little difference if all the electricity is from renewable sources or not. In terms of megajoules, only 13% of household energy use is electricity, 12,600 MJ/yr (0.0067€/MJ), but 30.6% of the cost. The majority is heating oil, 1400L/year, equivalent to 53,600MJ/yr (0.00166 €/MJ), or over 4 times as much energy but the about the same share of the annual cost, 31.8%. The rest is gasoline (0.0037€/MJ). Even if using a heat pump instead of resistive heating would improve the efficiency of electric heating, the cost would still be much higher than heating oil, not including the capital expense of installing a heat pump. It would also require a large expansion of generating capacity.
https://www.cleanenergywire.org/factsheets/what-german-households-pay-power
I haven’t been able to find equivalent statistic for the US. My suspicion, though, is that at least part of the reason that more electricity is used per person in the US is because the US uses more electric powered HVAC.
Anyone reading this post should check out the new article by Michael Shellenberger that tells how even though wind and solar prices are dropping, they still cause electricity prices to rise. Here it is posted at WUWT:
Willis Eschenbach wrote a similar post a few years ago:
He did a scatterplot of electricty cost vs. installed renewable capacity:
Reblogged this on uwerolandgross.