At least 99.9% of physicists believe the theory of gravity, and the heliocentric model of the solar system. The debate is over. There is no doubt that we can send a manned (and woman-ed) mission to Mars.
Some “skeptics” say it can’t be done. They are denying basic science! Gravity is plainly true. So is the heliocentric model. Everyone agrees. There is an overwhelming consensus. So the time for discussion is over. There is no doubt about the Mars mission.
I create this analogy (note 1) for people who don’t understand the relationship between five completely different ideas:
- the “greenhouse” effect
- burning fossil fuels adds CO2 to the atmosphere, increasing the “greehouse” effect
- climate models
- crop models
- economic models
The first two items on the list are fundamental physics and chemistry, and while advanced to prove (see The “Greenhouse” Effect Explained in Simple Terms for the first one) to people who want to work through a proof, they are indisputable. Together they create the theory of AGW (anthropogenic global warming). This says that humans are contributing to global warming by burning fossil fuels.
99.9% of people who understand atmospheric physics believe this unassailable idea (note 2).
This means that if we continue with “business as usual” (note 3) and keep using fossil fuels to generate energy, then by 2100 the world will be warmer than today.
How much warmer?
For that we need climate models.
Climate Models
These are models which break the earth’s surface, ocean and atmosphere into a big grid so that we can use physics equations (momentum, heat transfer and others) to calculate future climate (this class of model is called finite element analysis). These models include giant fudge-factors that can’t be validated (by giant fudge factors I mean “sub-grid parameterizations” and unknown parameters, but I’m writing this article for a non-technical audience).
One way to validate models is to model the temperature over the last 100 years. Another way is to produce a current climatology that matches observations. Generally temperature is the parameter with most attention (note 4).
Some climate models predict that if we double CO2 in the atmosphere (from pre-industrial periods) then surface temperature will be around 4.5ºC warmer. Others that the temperature will be 1.5ºC warmer. And everything in between.
Surely we can just look at which models reproduced the last 100 years temperature anomaly the best and work with those?

From Mauritsen et al 2012
If the model that predicts 1.5ºC in 2100 is close to the past, while the one that predicts 4.5ºC has a big overshoot, we will know that 1.5ºC is a more likely future. Conversely, if the model that predicts 4.5ºC in 2100 is close to the past but the 1.5ºC model woefully under-predicts the last 100 years of warming then we can expect more like 4.5ºC in 2100.
You would think so, but you would be wrong.
All the models get the last 100 years of temperature changes approximately correct. Jeffrey Kiehl produced a paper 10 years ago which analyzed the then current class of models and gently pointed out the reason. Models with large future warming included a high negative effect from aerosols over the last 100 years. Models with small future warming included a small negative effect from aerosols over the last 100 years. So both reproduced the past but with a completely different value of aerosol cooling. You might think we can just find out the actual cooling effect of aerosols around 1950 and then we will know which climate model to believe – but we can’t. We didn’t have satellites to measure the cooling effect of aerosols back then.
This is the challenge of models with many parameters that we don’t know. When a modeler is trying to reproduce the past, or the present, they pick the values of parameters which make the model match reality as best as they can. This is a necessary first step (note 5).
So how warm will it be in 2100 if we double CO2 in the atmosphere?
Somewhat warmer
Models also predict rainfall, drought and storms. But they aren’t as good as they are at temperature. Bray and von Storch survey climate scientists periodically on a number of topics. Here is their response to:
How would you rate the ability of regional climate models to make 50 year projections of convective rain storms/thunder storms? (1 = very poor to 7 = very good)
Similar ratings are obtained for rainfall predictions. The last 50 years has seen no apparent global worsening of storms, droughts and floods, at least according to the IPCC consensus (see Impacts – V – Climate change is already causing worsening storms, floods and droughts).
Sea level is expected to rise between around 0.3m to 0.6m (see Impacts – VI – Sea Level Rise 1 and IX – Sea Level 4 – Sinking Megacities) – this is from AR5 of the IPCC (under scenario RCP6). I mention this because the few people I’ve polled thought that sea level was expected to be 5-10m higher in 2100.
Actual reports with uneventful projections don’t generate headlines.
Crop Models
Crop models build on climate models. Once we know rainfall, drought and temperature we can work out how this impacts crops.
Will we starve to death? Or will there be plentiful food?
Past predictions of disaster haven’t been very accurate, although they are wildly popular with generating media headlines and book sales, as Paul Ehrlich found to his benefit. But that doesn’t mean future predictions of disaster are necessarily wrong.
There are a number of problems with trying to answer the question.
Even if climate models could predict the global temperature, when it comes to a region the size of, say, northern California their accuracy is much lower. Likewise for rainfall. Models which produce similar global temperature changes often have completely different regional precipitation changes. For example, from the IPCC Special Report on Extremes (SREX), p. 154:
At regional scales, there is little consensus in GCM projections regarding the sign of future change in monsoon characteristics, such as circulation and rainfall. For instance, while some models project an intense drying of the Sahel under a global warming scenario, others project an intensification of the rains, and some project more frequent extreme events..
In a warmer world with more CO2 (helps some plants) and maybe more rainfall, or maybe less what can we expect out of crop yields? It’s not clear. The IPCC AR5 wg II, ch 7, p 496:
For example, interactions among CO2 fertilization, temperature, soil nutrients, O3, pests, and weeds are not well understood (Soussana et al., 2010) and therefore most crop models do not include all of these effects.
Of course, as climate changes over the next 80 years agricultural scientists will grow different crops, and develop new ones. In 1900, almost half the US population worked in farming. Today the figure is 2-3%. Agriculture has changed unimaginably.
In the left half of this graph we can see global crop yield improvements over 50 years (the right side is projections to 2050):
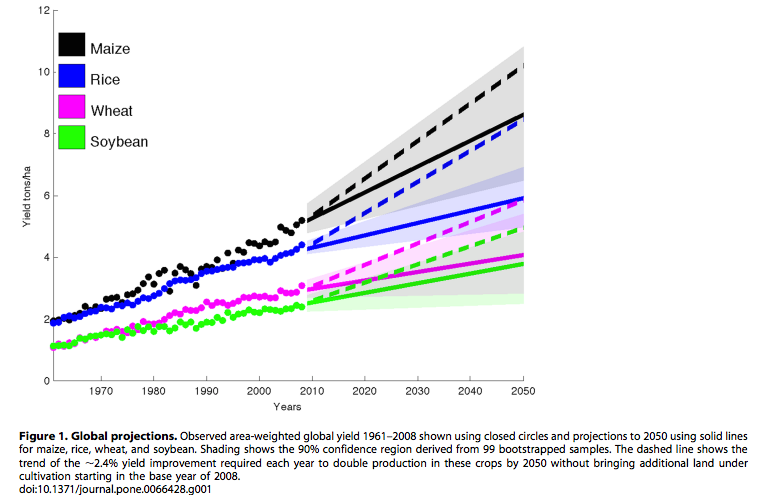
From Ray et al 2013
Economic Models
What will the oil price be in 2020? Economic models give you the answer. Well, they give you an answer. And if you consult lots of models they give you lots of different answers. When the oil price changes a lot, which it does from time to time, all of the models turn out to be wrong. Predicting future prices of commodities is very hard, even when it is of paramount concern for major economies, and even when a company could make vast profits from accurate prediction.
AR5 of the IPCC report, wg 2, ch 7, p.512, had this to say about crop prices in 2050:
Changes in temperature and precipitation, without considering effects of CO2, will contribute to increased global food prices by 2050, with estimated increases ranging from 3 to 84% (medium confidence). Projections that include the effects of CO2 changes, but ignore O3 and pest and disease impacts, indicate that global price increases are about as likely as not, with a range of projected impacts from –30% to +45% by 2050..
..One lesson from recent model intercomparison experiments (Nelson et al., 2014) is that the choice of economic model matters at least as much as the climate or crop model for determining price response to climate change, indicating the critical role of economic uncertainties for projecting the magnitude of price impacts.
In 2001, the 3rd report (often called TAR) said, ch 5, p.238, perhaps a little more clearly:
..it should be noted however that hunger estimates are based on the assumptions that food prices will rise with climate change, which is highly uncertain
Economic models are not very good at predicting anything. As Herbert Stein said, summarizing a lifetime in economics:
- Economists do not know very much
- Other people, including the politicians who make economic policy, know even less about economics than economists do
Conclusion
Recently a group, Cook et al 2013, reviewed over 10,000 abstracts of climate papers and concluded that 97% believed in the proposition of AGW – the proposition that humans are contributing to global warming by burning fossil fuels. I’m sure if the question were posed the right way directly to thousands of climate scientists, the number would be over 99%.
It’s not in dispute.
AGW is a necessary theory for Catastrophic Anthropogenic Global Warming (CAGW). But not sufficient by itself.
Likewise we know for sure that gravity is real and the planets orbit the sun. But it doesn’t follow that we can get humans safely to Mars and back. Maybe we can. Understanding gravity and the heliocentric theory is a necessary condition for the mission, but a lot more needs to be demonstrated.
The uncertainties in CAGW are huge.
Economic models that have no predictive skill are built on limited crop models which are built on climate models which have a wide range of possible global temperatures and no consensus on regional rainfall.
Human ingenuity somehow solved the problem of going from 2.5bn people in the middle of the 20th century to more than 7bn people today, and yet the proportion of the global population in abject poverty (note 6) has dropped from over 40% to maybe 15%. This was probably unimaginable 70 years ago.
Perhaps reasonable people can question if climate change is definitely the greatest threat facing humanity?
Perhaps questioning the predictive power of economic models is not denying science?
Perhaps it is ok to be unsure about the predictive power of climate models that contain sub-grid parameterizations (giant fudge factors) and that collectively provide a wide range of forecasts?
Perhaps people who question the predictions aren’t denying basic (or advanced) science, and haven’t lost their reason or their moral compass?
—-
[Note to commenters, added minutes after this post was written – this article is not intended to restart debate over the “greenhouse” effect, please post your comments in one of the 10s (100s?) of articles that have covered that subject, for example – The “Greenhouse” Effect Explained in Simple Terms – Comments on the reality of the “greenhouse” effect posted here will be deleted. Thanks for understanding.]
References
Twentieth century climate model response and climate sensitivity, Jeffrey Kiehl (2007)
Tuning the climate of a global model, Mauritsen et al (2012)
Yield Trends Are Insufficient to Double Global Crop Production by 2050, Deepak K. Ray et al (2013)
Quantifying the consensus on anthropogenic global warming in the scientific literature, Cook et al, Environmental Research Letters (2013)
The Great Escape, Angus Deaton, Princeton University Press (2013)
The various IPCC reports cited are all available at their website
Notes
1. An analogy doesn’t prove anything. It is for illumination.
2. How much we have contributed to the last century’s warming is not clear. The 5th IPCC report (AR5) said it was 95% certain that more than 50% of recent warming was caused by human activity. Well, another chapter in the same report suggested that this was a bogus statistic and I agree, but that doesn’t mean I think that the percentage of warming caused by human activity is lower than 50%. I have no idea. It is difficult to assess, likely impossible. See Natural Variability and Chaos – Three – Attribution & Fingerprints for more.
3. Reports on future climate often come with the statement “under a conservative business as usual scenario” but refer to a speculative and hard to believe scenario called RCP8.5 – see Impacts – II – GHG Emissions Projections: SRES and RCP. I think RCP 6 is much closer to the world of 2100 if we do little about carbon emissions and the world continues on the kind of development pathways that we have seen over the last 60 years. RCP8.5 was a scenario created to match a possible amount of CO2 in the atmosphere and how we might get there. Calling it “a conservative business as usual case” is a value-judgement with no evidence.
4. More specifically the change in temperature gets the most attention. This is called the “temperature anomaly”. Many models that do “well” on temperature anomaly actually do quite badly on the actual surface temperature. See Models, On – and Off – the Catwalk – Part Four – Tuning & the Magic Behind the Scenes – you can see that many “fit for purpose” models have current climate halfway to the last ice age even though they reproduce the last 100 years of temperature changes pretty well. That is, they model temperature changes quite well, but not temperature itself.
5. This is a reasonable approach used in modeling (not just climate modeling) – the necessary next step is to try to constrain the unknown parameters and giant fudge factors (sub-grid parameterizations). Climate scientists work very hard on this problem. Many confused people writing blogs think that climate modelers just pick the values they like, produce the model results and go have coffee. This is not the case, and can easily be seen by just reviewing lots of papers. The problem is well-understood among climate modelers. But the world is a massive place, detailed past measurements with sufficient accuracy are mostly lacking, and sub-grid parameterizations of non-linear processes are a very difficult challenge (this is one of the reasons why turbulent flow is a mostly unsolved problem).
6. This is a very imprecise term. I refer readers to the 2015 Nobel Prize winner Angus Deaton and his excellent book, The Great Escape (2013) for more.


Very well done.
One point you made that causes me angst: “The 5th IPCC report (AR5) said it was 95% certain that more than 50% of recent warming was caused by human activity”. Very few proponents for CO2 mitigation concede the point that even if we were sure that was the percentage caused by human activity we don’t know how much is due to GHG forcing, land use change, aerosols and other human activities affecting climate. Consequently how much confidence can we possibly have that CO2 mitigation is going to work as advertised?
Yes gravity has very explicit equations including that light blue shifts , ie : gets hotter , descending in a gravitational well .
GHG has.. [moderator’s note – thanks Bob for reminding me to add the request that the debate about the greenhouse itself should be elsewhere. I have moved your comment to another article –
The “Greenhouse” Effect Explained in Simple Terms]
Ok .. [ moderator’s note – comment moved to relevant thread]
No evidence for the relationship between changes in atmos co2 and emissions.
https://papers.ssrn.com/sol3/papers.cfm?abstract_id=3000932
https://papers.ssrn.com/sol3/papers.cfm?abstract_id=2997420
I wonder how it is possible to hold on to climate models as predictive devices when there are so many systematic biases that is sheared among a great majority. Looks that it is some consensus bias among those who build the models. It is now confirmed that models get the aerosole effect wrong, and that some aerosole combined with soot can warm the atmosphere, that sulfur emission has very little effect, and that vapor and dust from plants can do some difference (the CLOUD experiment). Together with cloud biases, atmospheric ice biases, wind biases, rainfall biases and more. Shouldn`t a model get the Antarctica right to have a global relevance? So, if 20 parameters are sytematically biased, how can scientists themselves believe in their model predictions?
NK,
Why not ask central bankers why they cling to models that are far worse than climate models. We know beyond a reasonable doubt that those models are worse than useless. Actions based on those models, like negative interest rates, are doing far more damage than climate models.
Everyone questions models, especially those who build and work with them on a daily basis.
The problem with the non-expert people questioning them is that they often use the uncertainty to forward their own narrative (i.e. climate sensitivity is low, more CO2 is good for plants or we’re doomed). The late Stephen Schneider had something to say about that: “The end of the world or it’s good for you are the lowest probability outcomes.”
Models are the one way to calculate the climate sensitivity. The jokes, however, are the time charts. It is about the concentration of CO2, which should change over the years. What should be the abscissa instead of the CO2 concentration?
The trend can be prolonged in the correct representation (inter alia via the tropopause pressure) and provides e.g. With the measured values of Hohenpeissen a climate sensitivity of 3 K.
Perhaps denying science is not questioning the predictive power of economic models?
Perhaps people who are denying basic (or advanced) science should rather question the economical predictions than proving having lost their reason or their moral compass?
The subject of Cook et al 2013 is precisely the consensus about the human contribution to climate change. It refutes the claim that this consensus is a misrepresentation of the literature and the accusations that the scientists are having more doubts than what it is said, and other “final nail in the coffin” statements, suggesting that AGW theory is discredited. The paper does not claim that we should all go to Mars.
So, to resume, a blog post which is so ridiculously partisan that it should be read backwards to make sense.
And what is CAGW, by the way – except a meme of the skeptical blogosphere? Who is the proponent of CAGW in the peer-reviewed literature ? What does it claim exactly ?
Ort,
I think you got confused by my complicated plot. I used an analogy. I can see why you got confused and I will think about how to rewrite the article.
Part One
————
– I agree with AGW. It is fundamental physics and chemistry.
– I agree that AGW is the overwhelming consensus of climate science.
Part Two
———–
– Neither the Cook et al 2013 paper, nor the consensus of climate science suggest we should send a manned mission to Mars.
– Missions to Mars are completely irrelevant to climate science and now I think about it, I can’t see why I brought it up. Apologies to my readers.
Part Three
————–
– I introduced the term CAGW because I have seen it used and because AGW simply tells us the world will be warmer if we keep burning fossil fuels.
– AGW doesn’t tell us how much warmer, or how dangerous that will be.
– I could have called “CAGW” instead “Theory B”. But, perhaps mistakenly, I thought using a new term might be more confusing than a term that many other people use.
– At the moment most non-technical people are confused. I suspect this is because fundamental physics and chemistry of the atmosphere lead to the theory called AGW. At the same time, the less certain theory of a coming catastrophe is also called AGW. This gives more opportunity for confusion.
Part Four
————-
– It seems that believing AGW is necessary but not sufficient condition for believing that there will be catastrophic warming.
– Therefore (the confusing bit in my article), other things need to demonstrated along with AGW to demonstrate a catastrophe.
– It seems that these are more speculative than the highly convincing theory called AGW.
The reason why CAGW is relevant is because Cook & Co never talk about anything but CAGW. If you question them on it by citing, say: the IPCC, they will say your are wrong because the IPCC have been superseded by the latest model projection of catastrophe. Believers generally don’t refute the media reporting catastrophe. It’s an old trick:- let someone else tell lies for you.
You may want to revisit including the Cook paper as an example of anything other than motivated reasoning masquerading as “science”. http://www.joseduarte.com/blog/cooking-stove-use-housing-associations-white-males-and-the-97
Speed rating the abstracts of 10,000+ papers doesn’t seem like an awesome method, but at least it’s something. Maybe it motivates another group to attempt a better analysis.
I’ve read a lot of climate science papers myself. Maybe 1500. I haven’t done any kind of formal evaluation but if any of them questioned the existence of the “greenhouse” effect, or that burning fossil fuels added to the “greenhouse” effect I would have noticed.
Obviously, I’ve dissected a few of the “popular” papers that express contrary opinions in this blog and, of course, I have gone looking for all papers highlighted by people confused over AGW.
99%-100% seems like about the right range.
And, of course, Cook et al didn’t just look at abstracts, they asked the authors for a rating of their own work as well (the whole paper presumably, not just the abstract). Both results agree with each other, which strengthens the former method, something rarely mentioned in the discussion surrounding that paper.
https://skepticalscience.com/tcp.php?t=faq
Ontspan: From a scientific and policymaking point of view, Cook at al asked a totally meaningless question: Are humans causing (an unspecified amount of) warming? All the prominent skeptical scientists agree that humans are; there is no scientific controversy about it. This non-quantitative answer doesn’t provide policymakers any information useful for deciding whether to restrict GHG emissions.
The survey uncovered about 75 papers with abstracts discussing whether humans had caused at least 50% of recent warming and only 65 agreed. Two (in)famous papers by Lindzen and Choi were not among those 10. So there is no 97% consensus on this subject.
Even if 50% of warming were due to humans, what would that tell policymakers to do? Possibly nothing! Models assign at least 100% of recent warming to GHGs. If only half of that warming were due to man, then it would be sensible to assume that climate sensitivity of models is about 2X too big. In that case, projected warming of about 4 K would become 2 K. We might not need to do anything to stay under the 2 K target.
CO2 is not responsible.. [moderator’s note – I’ve moved this comment to The “Greenhouse” Effect Explained in Simple Terms for reasons explained in the article]
Doh. “land” –> should be “surface”
Few in the scientific community would talk about projections as ‘catastrophic’. The end of the world is just one extreme wing (low probability) on the the probability curve of all outcomes. But there is plenty of chance for ‘dangerous’, which is a word used much more in the scientific community.
The large uncertainty in economic or biological models do not relieve any of that, on the contrary I would say. Especially when we talk about ensuring life support on Earth I would rather err on the side of too much preventive action.
Every time I look at economic results (i.e. stock results) I’m told that the past is no precursor for the future, so I’m a bit puzzled by the suggestion in this article that we can solve any future challenges because we solved many challenges in the past. Let alone that there are many different forms of ‘solve’, including many that will cost a lot of us dear.
SoD, you end your article with a lot of questions but I’m not sure if you ask them rhetorically or in earnest. Can you elaborate on this? How does uncertainty in models allow a form of single-sided skepticism that suggests that we’ll end in the ‘it won’t be bad’ part of the probability curve? Do you suggest we can safely reduce climate mitigation because economic models are rubbish?
ontspan,
I’m asking the questions in earnest.
I didn’t say that at all. Why read that into my question?
Perhaps because of the problem of “the debate”, which turns everything into two polarized camps.
Why did I write this article?
Most people don’t understand the difference between fundamental physics proving the “greenhouse” effect (AGW), and climate catastrophe.
I didn’t say they don’t understand the difference between fundamental physics and a nuanced view of possible danger from AGW if the warming is on the high side, and other bad effects click in. Because 99.99% of the population doesn’t read the nuanced view in climate papers.
So, I’m talking about the difference between fundamental physics and catastrophe.
That’s why I wrote this article.
I didn’t, in the article, suggest there was no danger. Instead I asked a few questions, including: “Perhaps reasonable people can question if climate change is definitely the greatest threat facing humanity?”
In the polarized world of today, asking this question is conflated with “denying basic science that 97% of climate scientists believe”.
I hope you understand what I am trying to explain. In the world of Manichean viewpoints it seems difficult to explain.
I suggest that the certainty of danger is low. There is danger. The certainty is low.
When serious people write about predictions of food prices in 2050 in a serious vein I can’t take it seriously. What 30 year predictions of commodity prices have come true? What proportion of 30 year predictions have come true? How can we assess the predictive power?
If the IPCC report summarized Food Security with “we can see potentially serious problems but have no way to quantify the likelihood” I could take their executive summary more seriously.
Let me be clear, I do not believe we can safely reduce climate mitigation because economic models are rubbish. On the other hand, reasonable people can differ about how seriously to take future safety because economic models are rubbish.
At the moment, in one large chunk of the media, people who differ about how seriously to take future safety – because economic models are rubbish – are called “science d—ers” [note, this blog’s moderation policies don’t allow certain words, as explained in The Etiquette].
Thanks for your clarification SoD.
In light of future population projections (which seem likely to me) and the increasing demand for high-intensity food (meat/dairy products) combined with possible less predictable/stable weather patterns, I do wonder if past performance translate well into the future.
E.g. the crop yield graph suggests at least linear improvements into the coming decades, while I suspect that there are physical limits on the achievable crop improvements as well as climate constraints on increasing yields in the field. Can we really double real world crop production per hectare in ~40 years again? I wouldn’t assume that blindly.
Perhaps, regarding how serious to take future safety in light of poor economic model performance, a lot comes down to which risk error model you prefer. See e..g. http://journals.ametsoc.org/doi/pdf/10.1175/BAMS-D-13-00115.1
While the results of those models may be questionable and rightfully attract skepticism, that fact may not have much influence on the seriousness of the threat of AGW on future safety as a Type 2 error is preferred over a Type 1 error when we’re talking about our life support system. At least to me (and judging by the Paris accord, to most people). So, in summary, I propose to take economic models, flawed and all, seriously in a discussion about future safety.
I’m sorry, I meant: avoiding a Type 2 error is preferred…
The problem here ontspan is that there are numerous threats to humanity. The real issue here is the risks are often quite uncertain as SOD points out. The real problem here in the debate is that partisans try to scare people with what amount to quite unlikely outcomes. It seems this happens with all issues nowadays and the media have descended into partisan territory not seen since the 19th Century.
I would just add a simple conclusion from SOD’s explication of GCM’s predictions. It does appear that the latest research is yielding lower and lower estimates for aerosol forcing. This would tend to lend credence to those models with lower sensitivity. This is an area where some climate scientists.. [deleted – moderator’s note – please observe the blog Etiquette]. The very high uncertainty in GCM’s is just recently being surfaced by actual modelers (as opposed to scientist activists like Hansen). And then there is convection and the tropics where there is a rather bad mismatch between data and GCM predictions. That is important because it goes to the lapse rate theory, which is really a foundation of atmospheric sciences. Could it be that the lapse rate needs revision? Amongst all the nasty partisans in the debate, that important question has not been addressed by anyone. Perhaps SOD can weight in.
In short, there are lots of holes even in fundamental atmospheric science to address if we are really serious about this. If we just want to do “communications” I would say go to work for Al Gore.
ontspan
I don’t assume it blindly. I don’t assume it at all. I have no idea.
Let’s consider crop production and the growing world population which is expected to be around 9bn by mid-century (I didn’t check the expected number). Let’s consider it without climate change – can we feed the world the same or better per capita intake as now?
Perhaps this is the greatest threat facing humanity? A population bomb Paul Ehrlich Redux?
We don’t know whether rains will increase or decrease in any given region so it’s hard to say what will happen due to global warming. Likewise we have no idea even if there was no global warming. The variation in each region decade to decade is higher than any estimated trends.
Here are some drought estimates around the world since 1950 according to Sheffield and Wood 2008:
Here are drought estimates of China over 500 years from Dai 2010:
Without any anthropogenic warming we have large decadal and centennial variability. With anthropogenic warming we have large decadal warming with different trends in different regions.
Note that Dai 2010 found the opposite global trend for the last 50 years. And regionally I find it hard to match up their two reanalyses. (Both of these two papers were cited by the IPCC report which is why I highlight them).
So our knowledge on droughts is not great. We see lots of variation. Experts disagree even on the past.
Who can predict future crop yields without global warming?
dpy
I think you have important points. “The real problem here in the debate is that partisans try to scare people with what amount to quite unlikely outcomes.” Yes, we see it now with the release of the latest paper bye Hansen et. co. We have seen it before with many scientific papers. And the same stories keep coming up about sinking sities, dying species and all that. It seems like many scientists believe in an Eemian Hell that will break loose (as Hansen so dramatically put it), and that it is their mission to save the planet for the next generations.
As for the models, I think too that history haunts us. Something was defined by the earliest models. Hansen`s GISS II model (used up to year 2000) had a sensitivity of 4,4 deg C,after 140 years with doubling of CO2 (according to Clive Best). Then the whole drama soup could begin, with quite unrealistic volcano and aerosole effects. These effects could explain the not so dramatic observed temperatures. The anthropogenetic destruction has only been offset. Lag in the “pipeline”.
As for the lapse rate “theory”. I don`t know if the theory is wrong, but I think that perhaps the laps rate estimates are uncertain. How big will the laps rate feedbacks be with atmospheric warming? Will these feedbacks be linear? I have not seen so much discussion about this.
Alittle more on the climate sensitivities from GISS II, 1983.
“The benchmark for climate sensitivity comes from the Hansen et al 1988 paper on global warming. The climate sensitivity is quoted as 4.2°C (Hansen et al, 1988) for doubled CO2 for the GISS GCM Model II (Hansen et al, 1983); subsequent papers have been reluctant to push for a sensitivity greater than that. However it appears that the 4.2°C number may have been an artifact of limited computing resources and particular parameterizations. Recent experiments with the same model (Rind and Chandler, 2005) have gotten a sensitivity > 5°C, if the doubled CO2 simulations are run for 100 years instead of the 30 years done in 1983. Newer versions of the GISS GCM have lower sensitivities because of aerosols and extensive tuning, otherwise higher resolution versions Model II have a sensitivity of > 6°C.”
From University lectures 2005, programmer Michael Shopsin
And Michael Shopsin should have first hand knowledge: “I’m a programmer at Columbia University for GISS a climate institute located on 112th street.”
nobodysknowledge,
Thanks for the history of the GISS GCM. In the 1980’s the calculations would have been on incredibly coarse grids as you say. I think I remember seeing somewhere that the current GISS E version has an ECS of 2.3 or so. Hansen did a great disservice to climate science with his alarmism and activism. One can never be sure that his science isn’t being skewed toward alarmism.
Hanson’s reply about the high sensitivity of the 1988 model was”It does not matter much over 20 year. Buried in the 1988 paper is this gem
“Forecast temperature trends for time scales of a few decades or less are not very sensitive to the model’s equilibrium climate sensitivity (reference provided). Therefore climate sensitivity would have to be much smaller than 4.2 C, say 1.5 to 2 C, in order for us to modify our conclusions significantly.”
RTFR
Well yes Eli, Hansen did indeed get it wrong on decadal time scales, so his rationalization is not worth much. There is a big difference between an ECS of 4.7 and 2.3. It’s more than a factor of 2. Hansen just had it wrong according even to later GISS model revisions.
It continues to be the case that I have never seen a QUANTITATIVE , ie : computable , explanation of Hansen’s claim that Venus’s extreme surface temperature , 2.25 times the gray body temperature in its orbit ( energy density 25 times ) is due to an optical effect .
Until I do , I will be more than a skeptic .
Bob Armstrong wrote: It continues to be the case that I have never seen a QUANTITATIVE , ie : computable , explanation of Hansen’s claim that Venus’s extreme surface temperature , 2.25 times the gray body temperature in its orbit ( energy density 25 times ) is due to an optical effect. Until I do, I will be more than a skeptic .
Now you have seen such an explanation. There are far better reasons to be or not be a skeptic or an a1armist.
Sorry , I still don’t see any equation I can implement . I don’t even see any equation based on spectra rather than the crudest computation with a scalar absorptivity parameter . Can an equation be presented in terms of the Schwarzschild differential ? That I can implement .
Bob Armstrong,
I don’t think anyone here is going to hold your hand and lead you through the steps necessary to write your own line-by-line atmospheric radiative transfer program. Spectracalc.com has an online program, but it’s subscription based for anything really useful. If you want code, LBLRTM ( http://rtweb.aer.com/lblrtm.html ) is available for free. For the Venusian atmosphere, you need the HITEMP spectral database: https://www.cfa.harvard.edu/hitran/HITEMP.html
If you’re interested in learning about atmospheric radiative transfer, I suggest you purchase Grant Petty, A First Course in Atmospheric Radiation. It’s available from the publisher for $36. http://www.sundogpublishing.com/shop/a-first-course-in-atmospheric-radiation-2nd-ed/
You can also read SoD’s articles on calculating radiative transfer starting here:
Can’t you simply point me to one ? In an APL it could not possibly be more than a dozen lines .
I still see little evidence that the journeyman “climate scientist” even knows how to calculate the equilibrium temperature of a colored , ie : arbitrary absorptivity=emissivity spectrum , sphere illuminated by a disk with an arbitrary power spectrum . That should be standard textbook stuff in any modern undergraduate heat transfer course . Without that you literally don’t know how to calculate the temperature of a billiard ball under a sun lamp , much less the mean temperature of a planet’s surface .
I was quite disappointed that Incropera et al : Heat Transfer didn’t cover the coupling between arbitrary spectra . But I see there are now newer editions online than the paper edition I got . It certainly needs to be somewhere and in more traditional notations other than on CoSy .
I did point you to one, LBLRTM. The fact that you think you could code a reasonably accurate radiative transfer program in a dozen lines of assembly language demonstrates your complete lack of understanding of the complexity of the problem. That’s why I suggested you read Petty’s book.
There are on the order of one million different absorption lines for CO2 and water vapor in the spectral range of interest, ~2-2500cm-1. You have to calculate the shape of each line based on the local temperature and pressure from coefficients in the HITRAN database and then select the lines that matter for the incremental resolution step, something on the order of 0.01cm-1. You have to do this for at least ten layers of the atmosphere, preferably more.
A paper summarizing LBLRTM is here:
Click to access Mlawer_etal_2001_AERsum.pdf
A paper describing the Linepak program used at spectralcalc.com is, unfortunately, behind a paywall:
http://www.sciencedirect.com/science/article/pii/0022407394900256
Incropera is an introductory textbook. Dealing with complex emission and absorption spectra is beyond its scope.
APLs don’t care if you have one “line” or a million , it’s still just a couple of dot products — and in fact , notations like K , the “template” for CoSy , don’t care if you have a million dot products .
And that doesn’t include niceties like the water vapor continuum spectrum.
If you really believe that, then you should write your own program and sell it. But you need to do the homework yourself. As I said above, don’t expect anyone here to do the heavy lifting. And it is heavy.
Bye.
I’m interested in the language and working with others specifically interested in these issues , important as they are .
I still have not gotten anybody to either confirm or challenge the algorithms in the freely downloadable K for the “radiative balance” for arbitrary spectra presented at http://cosy.com/Science/warm.htm#EqTempEq . Translating those few expressions into traditional integrals is not that hard . ( But not executable . )
If you think there is commercial value in such , and there likely is , perhaps you or someone you know might be interested in working on it .
And the programming languages CoSy melds , APL and Forth , are not considered lightweight . See my intro playlist on CoSy’s YouTube channel : https://www.youtube.com/playlist?list=PLfIstXupgHXX_tqjdX02FLf8JgyK-brho .
Bob,
Having relocated your earlier questions to another post, I hadn’t realized that your incomprehension of radiative physics had arrived back here.
Please post your incomprehension back in that article, or an appropriate article, for example, the series Visualizing Atmospheric Radiation.
I’ll just delete further questions of yours on the fundamentals that appear here, (I won’t bother to relocate them).
Thanks. I try not to engage people like BA, but I was bored and he gave the false impression that he was seeking information. His obvious failure to follow the leads I gave him made that crystal clear.
ontspan,
You wrote: “Few in the scientific community would talk about projections as ‘catastrophic’.”
There is really no difference between “catastrophic” and “potentially catastrophic”. Most (all?) preventative actions that people take are to avoid potential catastrophes.
You wrote: “Especially when we talk about ensuring life support on Earth I would rather err on the side of too much preventive action.”
In other words, you are worried about catastrophic anthropogenic global warming.
It is perfectly reasonable to look for ways to prevent against possible catastrophes. But your concern is one sided since it ignores natural climate change. A real climate catastrophe, far more severe than anything that might come from anthropogenic warming, would be a return to glacial conditions (an “ice age”). There are good reasons to believe that ought to be happening now. No one knows why it is not happening, but one theory is that it id due to all the extra CO2 that people have put into the atmosphere. So maybe the correct application of the precautionary principle is that we should make sure we continue to emit CO2. I am not saying that we should do that, I am only saying that we don’t actually know.
You later wrote: “a Type 2 error is preferred over a Type 1 error when we’re talking about our life support system.”
Your jargon is meaningless. All you have to do to change a Type 1 error into a Type 2 error is to change your null hypothesis. You seem to incorrectly think there is only one null hypothesis subject to debate.
Ontspan wrote: “a lot comes down to which risk error model you prefer.”
However, professors at elite academic institutions weren’t elected to decide which error model to use. Long-range planning for any government is about a decade, occasionally two decades, not the half-century it will take to for climate change to have a big impact. (AR5 projected only 0.3-0.7 K of warming over the next two decades.) The US government has a clear understand of the coming bankruptcy of Social Security in one a little more than one decade, but is doing nothing to prevent it when the problem is most tractable. If they can’t deal with SS, who in their right mind expects them to treat climate change as anything but a political football.
Most importantly, the future of CO2 emissions is mostly under the control of developing and undeveloped countries. China now emits more per capita than the EU and twice the US. Before their emissions peak around 2030, 50% more than the EU and that could be triple the US. And every developing country’s top priority is to follow in China’s economic footsteps.
When economists determine an optimal strategy for mitigation, they select a discount rate based on a mathematical theorem. One key input in this calculation is an estimate of the future rate of economic growth. If your great-grandchildren are expected to be dramatically richer than you are today, it doesn’t make sense to spend precious capital on emissions reductions today, when their far richer descendants will have plenty of money to adapt. The higher the economic growth rate, the higher the discount rate you should using in calculating the SCC. Our elite academics live in a world they fear their great grandchildren might envy. They favor mitigation, because their descendants might not be able to adapt.
Our elite academics should keep their personal perspectives on risk assessment out of their scientific assessment of climate change.
I understand well the arguments you are making and basically agree with you. AGW is good science but does not necessarily imply disaster (CAGW). Advocates for immediate drastic action fall back on the precautionary principal, justified by ‘worst case’ scenarios that they themselves helped developed.
RCP8.5 is just one example of this because its name is based on 8.5 W/m2 TOA forcing, rather than on hypothetical future CO2 emissions. The only way to reach such huge values is to assume that the carbon cycle will very soon saturate so that the airborne fraction of emissions rises from 45% to 100%. So far there is zero evidence that this is actually happening. Economic modelling is notoriously biased.
The problem with drastic action too early is that we will most likely waste our one chance to get free of fossil fuels by investing in inefficient technology, which in the long term will do more harm than good.
Clive Best wrote: “The problem with drastic action too early is that we will most likely waste our one chance to get free of fossil fuels by investing in inefficient technology, which in the long term will do more harm than good.”
Great point. We are pumping huge amounts of money into silicon solar cells, probably at the cost of developing high efficiency solar cells that might actually contribute to a revolution in electricity production.
Clive wrote: “The problem with drastic action too early is that we will most likely waste our one chance to get free of fossil fuels by investing in inefficient technology, which in the long term will do more harm than good.”
Will waiting actually deliver significantly improved technology? For single layer Si-PV, the theoretical efficiency limit is 30%. In 2015, Solar City claimed they would be selling 22% efficient panels for the roof top market. Multiple layers can help, but probably won’t be cost effective if they aren’t based on silicon. About half the price of roof top solar is now installation. Miami has mandated roof top solar on all new single family homes constructed. Would home buyers there be better off with today’s panels for the next 30 to 50 years (1%/yr efficiency loss) or retrofitting with the improved technology available a decade from now?
Wind is an even more mature technology. The cost of installation (per MW) hasn’t dropped in more than a decade (though prices were higher around 2010).
All kWh of electricity are not equally valuable, so the LCOE doesn’t tell us how much more we will really be paying for low-carbon electricity now or in the future. I’m saying the difference in cost realized by waiting is unlikely to be worth the cost of waiting To put it differently, if the US or UK has a carbon budget of X to spend over the rest of the century, we would be better off starting reductions now. If ECS were 2 or less, we might benefit from waiting, because the needed reductions would be much less. The possibility of a peak in fossil fuel production and a large spike in price (due to inelastic demand) favors starting now.
Improvements in our ability to cheaply store energy from non-dispatchable renewable generators could make a huge difference as wind and solar gain market share. That would reduce the true cost of wind and solar (and of meeting peak demand).
Will improvements in nuclear technology help? TMI and Fukushima have demonstrated that a loss of coolant accident will result in water reacting with the zirconium cladding on fuel rods, release of hydrogen, and potentially explosions. With this technology providing only 10% of world demand and creating serious incidents every decade or two, we probably can’t rely on it to deliver 50% of demand to a nervous population. Even if a new design eliminate this problem and if high-level waste could be incorporated into fuel rods and burned for power, a crash program would take 2-3 decades to building and operate a dozen new plants long enough to demonstrate their improved safety. So it could take until 2050 before the US could confidently start building the roughly 300? plants that would be needed to supply all base load power through carbon-free nuclear. The same may be true of smaller modular reactors. Right now, regulatory burdens are currently making it financially uncompetitive to build any new design in many developed countries. Any transition to improved nuclear doesn’t appear to conflict with investing in wind or solar for the next decade or two unless the lifetime of turbines and panels improves.
dpy6629 asked, August 2, 2017 at 8:39 pm:
The question is addressed by 100s or 1000s in climate papers and of course in textbooks.
Just a side note that what passes for discussion in the media and most blogs doesn’t give a flavor of the actual discussion in climate science. There isn’t some monolithic block of opinion, there are a wide range of opinions and ideas.
This is completely contrary to what many people believe so I can only claim it, and from time to time demonstrate it by highlighting many different papers.
At the heart of the lapse rate question is the important observation that in the tropics where convection is strong the actual lapse rate is very close to the adiabatic lapse rate. This is easy to calculate from theory if you know the amount of humidity.
More about this at Temperature Profile in the Atmosphere – The Lapse Rate and Potential Temperature.
This topic is also covered in most atmospheric physics textbooks as a basic building block.
Of course, the question of the actual lapse rate under global warming is widely discussed and complicated by the lack of quality (and decadally stable) observations in the upper troposphere. I read a lot of papers on this a while back but there was too much statistics and probably a lot at stake for the many people writing so I wasn’t able to form a useful conclusion that I could write about.
The lapse rate outside the tropics is a different and very difficult question without that same constraint.
My summary from memory, what is expected from theory about the tropical tropospheric lapse rate isn’t well matched by observation, but the observations have lots of biases and errors that are hard to correct for. The last 10-15 years with CERES and AIRS may give a dataset that can resolve these problems.
The great Isaac Held had a comment in one of his papers that I’m sure I quoted not so long ago, but can’t now locate. Something to the effect that “assuming the current question about lapse rate gets resolved in favor of the prevailing viewpoint.. otherwise we will have to rethink some important questions”. Sorry for the lack of citation.
I guess I should read your earlier post on this. It does seem to me though that this is one aspect of the “fundamentals” that is not settled.
I does seem to me that consensus studies in climate science are really largely meaningless. You can “manufacture” a consensus by choosing a vague enough statement to poll. And those who tout them or author them have never seemed to me to be first stringers.
dpy6629,
I’m sure you know this point, but a preamble for the benefit of non-technical readers..
In physics we often say “all other things remaining equal”. That is, let’s change this one thing, nothing else, and see what happens. It has been a very successful reductionist approach in science over the last few hundred years.
Back to the question about the lapse rate. Let’s take pre-industrial levels of CO2, 280ppm, with current climatology – geographical distribution of temperature around the globe, cloud cover distribution, temperature profile up through the atmosphere, current distribution of specific humidity, and so on.
Let’s now calculate the outgoing long wave radiation (OLR), which we can easily do because we have the spectroscopic values of CO2 (and other GHGs) – i.e., the absorption of radiation at different wavelengths.
Now, without changing anything else (“all other things remaining equal”), let’s double CO2 overnight to 560ppm.
Now we recalculate the OLR and of course it has dropped (without looking up the number, memory says a little less than 4W/m2).
Now we increase the surface temperature to find at what increased surface temperature we get back to our old value of OLR.
What do we find – the surface temperature has to increase something like 1.2’C to restore the old OLR value with the new value of CO2. So, “all other things remaining equal”, doubling CO2 will increase the surface temperature by 1.2’C.
Notice we didn’t address any change in lapse rate. This is a feedback. If the lapse rate doesn’t change then it is a negative feedback because higher temperatures emit more radiation. If the lapse rate increases then it is a yet more negative feedback because temperatures higher up in the atmosphere will increase yet further. Likewise, we didn’t address any ice melting which changes the earth’s albedo (positive feedback) Or any change in clouds (unknown). Or humidity (expected to be a positive feedback). Or anything.
So at the fundamental level, because the “greenhouse” effect is a certainty and can be calculated from concentrations of CO2, water vapor and other radiatively-active gases, we can be certain of AGW. Increasing CO2, all other things being equal, reduces OLR, so the earth warms.
Perhaps the feedbacks somehow all perfectly cancel this out? It’s a remote possibility. Some feedbacks will reduce the effect of more CO2, some will increase the effect of more CO2.
How much? For that we need models (GCMs).
Hopefully you can see where the lapse rate fits in the whole picture. Saying that this is one aspect of the “fundamentals” that is not settled, is like saying that clouds represent one aspect of the “fundamentals” that is not settled. AGW does not depend on all the feedbacks. They are not settled. AGW says more CO2, more warming. How much? Answering that is currently done by solving climate models.
The lapse rate doesn`t behave exactly as the models tell it. The tropopause layer is warming when it is expected to cool. Or perhaps it is more like a constant temperature. This should give more OLR than expected, so the lapse rate feedback should be more negative.
“While anthropogenic GHG emissions have kept rising during the recent decades, the tropical TPTs did not decrease as expected from the GHG increase. Instead, since about the turn of the century, the tropical tropopause has significantly warmed, according to the Global Positioning System Radio Occultation (GPS-RO) measurements. The GPS-RO measurements provide an unprecedented accurate, global, and weather-independent data set of tropopause temperature with high vertical resolution. In fact, the tropical TPTs exhibit strong decadal to multidecadal variability, which could be related to internal variability of the climate system. At the same time, remarkable decadal variability has also been seen in the lower stratospheric water vapour.” TPT is tropopause temperature. From: Decadal variability of tropical tropopause temperature and its relationship to the Pacific Decadal Oscillation.
Wuke Wang et al, 2016.
NK,
Yes, the models don’t get the details right. Some or all of them predict a double ITCZ and the tropical upper troposphere hot spot hasn’t appeared. This isn’t exactly news.
Questions
From the concentration of CO2 and the pressure of the atmosphere one can calculate the mass of CO2 in the atmosphere – and this mass has increased over time.
From the amount of burned fossil fuels you can calculate the amount of CO2 that is blown into the atmosphere.
In the seas the CO2 concentration increases.
According to the skeptics, the more CO2 in the atmosphere comes not from the combustion, but from the outgassing of the seas.
Price question: How do the skeptics explain the increase in CO2 concentration and where does the CO2 disappear from the burning of fossil fuels?
In the troposphere the temperature gradient is largely determined by the convection. The temperature gradient in the troposphere hardly changes by through more greenhouse gases – at most somewhat indirectly due to more water vapor because of its condensation properties.
In the stratosphere there is largely radiation equilibrium. Thus, the temperature gradients in the stratosphere are largely determined by the concentration of the greenhouse gases.
The position of the tropopause is determined by the temperature gradient of the stratosphere becoming so great that the convection begins.
If all this is not the case, why did Ernest Gold (later President of the English Meteorological Society) already have the assumption that, in the case of greater CO2 concentration, the tropopause height increases?
What determines the surface temperature? The altitude and temperature of the tropopause is determined by the net energy flow through the stratosphere. More greenhouse gases in the stratosphere increase the tropopause height and the surface temperature increases because of the constant temperature gradient in the troposphere.
What else should be the effect of CO2?
David Crisp who heads the OCO-2 mission has the best slide I’ve seen on the amount of human emission versus the amount not reabsorbed , in particular by the greening of the planet it is causing : http://cosy.com/y17/CrispCO2absorption.jpg .
What natural processes absorb half the CO2 emitted?
Most of it is absorbed into the oceans. Some goes into increased biomass.
Why does the rate change from year to year?
Ocean surface temperature may have an effect on the rate of absorption. I would bet, however, that changes in the net rate of biomass accumulation is more likely. Seasonal variation of atmospheric CO2 is much higher at Barrow, AK than it is at Mauna Loa and there is almost no seasonal variation at the South Pole. Atmospheric CO2 went up more rapidly during the recent strong El Nino. Dead plants rot faster when it’s warmer.
Ebel: I believe that the warming in the stratosphere with altitude is cause by locally produced ozone, not well mixed GHGs. Without ozone, there would be no tropopause.
At the very top of the atmosphere (the thermosphere), high energy particles from the sun produce local warming as UV does in the stratosphere.
In theory, the height of the tropopause has been raised by GHG-mediated and by destruction of ozone by CFCs. Santer claimed a 100-200 m (1-2%) rise from both effects, complicated by large changes produced by volcanic aerosols.
Click to access santertext.pdf
The tropopause has something to do with the ozone layer, is unfortunately a widespread error. Although the ozone layer will, of course, have some influence on the level of the tropopause – because of the low mass (because of the low density at the high altitude) very little influence.
Another supplement: Santer et al. With pictures: https://www.math.nyu.edu/~gerber/pages/documents/santer_etal-science-2003.pdf
In the troposphere, large radiative changes are compensated by minimal changes in convection. This is why the stratosphere is decisive, since there is hardly any convection.
The increase in the height of the tropopause is twofold: the amount of CO2 in the stratosphere is constant or the amount increases according to the concentration change. The measurement shows a measure of about 2/3 of the concentration change.
Ebel,
Without the ozone layer there would be no tropopause and temperature would decrease with altitude up to wherever there is absorption of sunlight. See https://scienceofdoom.com/2012/08/12/temperature-profile-in-the-atmosphere-the-lapse-rate/, in particular Figure 7. However, there would be an altitude above which the temperature gradient is too small to drive convection, creating a “stratosphere” that is very different from the one we have.
Heat flows from high temperature to low temperature. So for there to be a temperature maximum, as there is at the stratopause, there most be a source of energy. That is provided by the absorption of UV by O2 and O3 in the ozone layer.
Although the existence of a tropopause is down to ozone, its location depends on other things that influence where the tropospheric and stratospheric gradients meet. By warming the troposphere and cooling the stratosphere, greenhouse gases raise that altitude. Greenhouse gases cool the stratosphere by making it easier to radiate the energy absorbed by O2 and O3.
Why did Gold already suspect the increase in tropopause with more CO2 in 1908, even though the ozone layer was only discovered in 1913? See also http://geosci.uchicago.edu/~rtp1/papers/PhysTodayRT2011.pdf
Santer et al. confuse cause and effect. The stratosphere is the thinner the greater the net flow through the stratosphere and the greater the greenhouse gas concentration. Above, the troposphere becomes colder and below warmer – because the temperature gradient is approximately constant and the thickness of the troposphere increases.
The whole also follows from the radiation transport equation, which is decisive in the stratosphere. At Schwarzschild 1906 can read.
Accordingly, the tropopause does not rise because the lower troposphere is warmer, but is reversed because the tropopause height increases, the lower troposphere becomes warmer.
I mention this because the few people I’ve polled thought that sea level was expected to be 5-10m higher in 2100.
Actual reports with uneventful projections don’t generate headlines.
I’m just a cowboy, so I’m just going to shoot from the hip. No googling.
An early IPCC report had a fairly high estimate, but far less than 1meter. Later, around 2007, it was reduced to around 13 cm. There was a caveat that models did not contain a component for nonlinear changes in the ice sheets. James Hansen criticized the IPCC for misleading people on potential SLR. Based on paleo, he theorized that a rise of around 5 meters could happen in the 21st century. My understanding of what he wrote is this was not a prediction of 5 meters. Currently there are scientists reporting progress on modeling nonlinear changes in the ice sheets. This sounds very similar to work my Uncle did during WW2 as a member George Irwin Rankin’s fracture mechanics group.
So I don’t know who you asked, but they are not following the issue at a meaningful level, and I have pretty low regard for your comment.
JCH wrote, “So I don’t know who you asked, but they are not following the issue at a meaningful level … ”
That was the point.
No, because it’s virtually impossible for anybody who follows the issue to commonly read anything authoritative that indicates SLR is going to be 5 to 10 meters by 2100. Rahmstorf, who is commonly described as screeching alarmist, does not say that. Jevrejeva does not say that. Mitrovica does not say that.
They may have read from an authoritative source that SLR will be 5 to 10 meters, or more, by ~2200 to 2400.
They may have read on right-wing sources that alarmist scientist screech that SLR will be 5 to 10 meters by 2100.
Richard Alley in his keynote at esrl.noaa.gov/gmd/annualconference/ compared the threat of sea level rise with Katrina .
Look out . It could happen any day now with little warning .
Thanks for making case in point. Europe by 2100 could see 2.0 to 2.5 feet. That is a little less than 5 to 10 meters. During storms there could severe flooding. Not controversial.If there were to be a large nonlinear collapse of an ice sheet sea level would exceed current predictions. Not controversial.
In the world of regulatory implementation policy the headline is always we have to plan for the high values e.g. in NY City the headline was 2m of sea level rise. SoD is exactly right “actual reports with uneventful projections don’t generate headlines”. The point is that uneventful projections don’t drive current policy either.
I have been greatly impressed by this blog. You showed me something I never thought possible. That it was somehow possible for a person to be respected by both sides of the debate.
But this post is a bad one. Your skill is that you stick to the science and you avoid tipping your hand in any one direction. So no one is able to really disagree with you or think you are one of “them” and thereby just stop listening to you.
But lately you have begun strongly tipping your hand in the direction of the skeptics. I am a skeptic myself. But by doing so you compromise your authority and status. I think you would be better off if you stayed away from topics like this and just stuck purely to science. As I said I was amazed when I encountered this blog. I don’t get why you would ruin it by writing articles like this where you basically indicate that skepticism is a reasonable position. Its very obvious how this will be interpreted by anyone on the AGW side.
You have something really incredible and quite rare here. I don’t think you get how rare or how special.
I think SoD has the courage to not let others define him and what he is trying to accomplish. Of couse you can get enemies by being just open minded. Activists will say that by using the “snarl word” CAGW, he places himself in the wrong camp (http://rationalwiki.org/wiki/Global_warming). And at WUWT his blog is placed under the heading Pro AGW Wiews (together with some more dubious blogs) and not under Sceptical Wiews. This falls back on their own black-or-white-thinking. As he has said himself, SoD try to show us true scepticism, and a true invitation to to think freely about climate change.
So, assman, I think you are wrong when you say. “I don’t get why you would ruin it by writing articles like this where you basically indicate that skepticism is a reasonable position. Its very obvious how this will be interpreted by anyone on the AGW side.” There are some reaonable people “on the AGW side” who are not misled by activism. At least I hope that many of them can think for themselves and not get stuck in an echo chamber.
assman,
Thanks for your kind comments, much appreciated. And nice moniker.
I’ve never tried to find some “median position” in the climate debate, or be popular. I don’t have any authority and status.
If people find this blog helpful in explaining climate that is wonderful. More importantly, I try to present ideas with evidence and arguments so they can be questioned and challenged.
Skepticism – in the classical sense – is always a reasonable position. Perhaps by “skepticism” you mean “choosing the side that doesn’t believe climate scientists”. Which seems to be often how it is used.
In a highly polarized world it’s hard to explain a viewpoint without being misunderstood.
In this article I’ve asked isn’t it reasonable to question the certainty of future catastrophe, seeing as it is not based on the certainty of AGW (that is probably subscribed to by 99-100% of climate scientists).
As I said at the start of this comment “I try to present ideas with evidence and arguments so they can be questioned and challenged.”
I hope that people will challenge this article with counter-arguments and evidence. That is, I look forward to people explaining that it is unreasonable to question whether climate change is the greatest threat to humanity.
“I’ve never tried to find some “median position” in the climate debate, or be popular. I don’t have any authority and status.”
I am not saying you did. But you did stick to numbers and fact and judgements that could be supported by evidence or numbers. You basically avoided “opinions” or rhetorical arguments. This post is essentially a rhetorical argument.
“Skepticism – in the classical sense – is always a reasonable position. Perhaps by “skepticism” you mean “choosing the side that doesn’t believe climate scientists”. Which seems to be often how it is used.”
Sure I know that. As I said I’m a skeptic. But there are tonnes of skeptic blogs. And to honest I have strongly questioned my approach to things based mostly on this blog. What I have begun to realize is that its pointless to engage in rhetorical discussions. Its rare that anyone is persuaded. Facts and evidence and what I would call “small” opinions, meaning opinions that don’t make very large or broad claims are what work. “Large” opinions are dangerous.
“I hope that people will challenge this article with counter-arguments and evidence.”
That’s a great hope. But it won’t happen. What people will do is that the will bucket you. You will enter the bucket of Skeptic for everyone in the AGW tribe. And once that happens they will dismiss you.
assman,
That is an assertion that you consistently fail to back up with evidence other than hand waving. Your post is the rhetorical argument.
“But lately you have begun strongly tipping your hand in the direction of the skeptics. “
You think? That’s been obvious for a long time. Plus his science is very poor and badly explained.
Thibeaux,
This blog is oriented towards backing up claims with evidence and arguments. Feel free to criticise, but with evidence. I look forward to your comments.
Your comment is extremely poor and not explained at all.
This comment illustrates beautifully what I am talking about. Your science is good and well-explained but Thibeaux tribal instincts have taken over and he has lost the ability to think clearly about this. I am saying I am any different…we are both Humans with programming designed to survive in tribes…not to reason thoughtfully and logically.
Assman: What makes a subject “scientific” and therefore allows the author to be respected by both sides for the quality of his evidence and the rationality of the discussion? What makes another subject non-scientific and subjects the author to charges of bias or politicization despite the same quality of evidence and rationality?
The problem is not that scholarship (which is what SOD practices) is invading the realm of politics and political advocacy. The problem is that politics and political advocacy have taken over realm of scholarship and science, particularly at our universities. For those focused on climate science, this problem is best illustrated by a recent book by Alice Dreger, whose title is unacceptable to WordPress. Her field is the intersection of the history of science, medical ethics, and gender. Her story passionately illustrates the problems of politicization of scholarship. She notes that science and democracy grew up together in the Enlightenment – the idea that freedom of inquiry, ideas, and speech began with Galileo and gave birth to democracy. “It is no wonder that so many of America’s founders were science geeks”.
I am personally sick of being told that truth and justice depend solely on one’s position in society and that there are no facts that can guide us in today’s world of fake news. Politics is about delegitimizing your opponents, not addressing the merits of their arguments.
Abstract
Probabilistic sea-level projections have not yet integrated insights from physical ice-sheet models representing mechanisms, such as ice-shelf hydrofracturing and ice-cliff collapse, that can rapidly increase ice-sheet discharge. … Under high greenhouse gas emissions (Repre- sentative Concentration Pathway [RCP] 8.5), these physical processes increase median pro- jected 21st century GMSL rise from ∼80 cm to ∼150 cm. Revised median RSL projections would, without protective measures, by 2100 submerge land currently home to > 79 million people, an increase of ∼25 million people. …
JCH: I glanced at your review article. Do any of these models hindcast changes that we should have observed in the last century of two? Or during the Holocene climate optimum, when the Arctic was warmer than today?
The scientific method involves testing hypotheses for how ice sheets should respond to warming – not merely projecting the consequences of hypotheses. Publicizing the projections of unvalidated hypothesis fits my definition of alarmism.
BS. An ice sheet is a structure. Structures are made of materials. Materials can suffer catastrophic failures. It would be abjectly irresponsible to not figure it out. On RC, a longtime ago, I wondered why fracture mechanics was not being applied to the ice-sheet problem. It actually already had been. So this effort started a long time ago and now they’re starting to get results.
An ice sheet is a structure. It’s CURRENT and PAST shape are the result of mechanismS by which it “flows” towards the sea under the force of gravity. When we can explain at least some key aspects of what we see today and the survival of the GIS in the HCO, then we have a validated theory.
For example, the GIS has a fairly pyramidal shape arising from gravitationally induced flow. In trivial engineering, a pile of sand has an angle of repose that depends on the properties of the sand. A slump test (the drop in height of a cone of wet concrete) is used to measure the properties of a batch of concrete. What angle of repose do these theories predict the GIS and WAIS should have today? Obviously they are predicting increasing warmth should produce a lower angle of repose in the coming century.
As a I scientist, I’d like to know what observations are explained by these HYPOTHESES about the internal properties of ice sheets. What range of parameters are consistent with what we observe and what constraints are placed by the HCO – two millennia that were warmer in summer than today.
JCH wrote: “On RC, a longtime ago, I wondered why fracture mechanics was not being applied to the ice-sheet problem. It actually already had been. So this effort started a long time ago and now they’re starting to get results.”
In science, results are experimental tests of hypotheses that may or may not convert them into established theories. Extrapolation of untested hypotheses is prophesy,
JCH,
RCP 8.5 is wildly unrealistic. Basing late century ice shelf behavior on that scenario is science fiction, not science.
Thanks for this very good paper . I feel less alone ….
A large part of the problem is depending on lumped global parameters to validate models. Patterns of change are much more interesting. GCMs used to be called global circulation models and the fact that they get the circulation pretty well right is a strong hint that they are on the right path
This comment might fit better in the previous article The Confirmation Bias – a Feature not a Bug, but I’ll put it here.
Many comments on this blog in various articles, and of course in other blogs, criticize James Hansen and paint him as someone who is an activist sounding the alarm and therefore his predictions – that are towards the dangerous end of the “distribution of possible outcomes” – are rendered worthless. Therefore, they can be dismissed.
Likewise I read comments, more on other blogs, that Nic Lewis believes climate sensitivity is low and clearly he is a motivated “skeptic” (see note) that’s why he comes up with these low numbers. Therefore, they can be dismissed.
How about James Hansen is sounding the alarm and trying to get government action because of what he found (i.e., he sees that the danger is more real than others do).
How about Nic Lewis is presenting low climate sensitivity because that is what he found.
Assuming motives or blindness first is easily done. As explained in the linked earlier article, I don’t believe in the “rationalist delusion” but that doesn’t mean we can discard views of people based on their presumed motivations or apparently selective blindness.
In a complex field it’s possible that a range of hypotheses have sufficient support from the evidence.
It’s also possible in a complex field with lots at stake for humanity that some hypotheses with lots of adherents are completely unsupported by the evidence.
So as this blog started, that’s how it should continue – assumed motivations are irrelevant.
Instead, what is the evidence?
Note: using the moniker of “skeptic” as someone not accepting the climate consensus.
Here’s an example from The Economist on forecasting ability:
Of course, we have legislative changes here that impacted on the result.
When we consider food prices we will have legislative changes, plus crop yields, plus demand changes, plus supply changes from legislative changes, plus supply changes from changing climate, perceived future climate changes, perceived future demand..
I could go on.
DeWitt made an important point in an earlier comment considering catastrophic scenarios:
In an earlier article – Impacts – II – GHG Emissions Projections: SRES and RCP I went into some depth on the various scenarios. In a follow on article – Impacts – III – Population in 2100 I showed some data on population projections.
The world population 80 years from now is highly uncertain. Different experts provide different answers.
What is a little bizarre about the RCP8.5 scenario is that it combines enough economic growth to drive large industry in under-developed countries (mainly sub-Saharan Africa) with not enough economic growth to create the demographic transition or cleaner energy or better technology.
All kinds of future worlds are possibilities. But to use this scenario as the standard “conservative business as usual scenario” seems like a ..
Well, the correct phrase eludes me due to blog policy. Let’s say “strange”. Baffling, perhaps.
Another striking point when reviewing lots of papers is that it is common to find a comparison of only 3 scenarios:
– RCP2.6 – a massive decarbonization effort starting yesterday, completely unlikely, but obviously needed as a “look what happens if we do this” scenario
– RCP4.5 – a more possible future if most major emitters all decided to take strong action to decarbonize starting soon
– RCP8.5 – the world where everything combines in a perfect storm to create the highest concentration of CO2
Missing in action in many papers is RCP6. This is a world where CO2 about doubles (from 280ppm in pre-industrial times) to around 560ppm by 2100.
This RCP6 scenario should be described as:
and RCP8.5 should be described as:
And for that reason RCP6 should be the scenario to be compared with RCP4.5 and RCP2.6.
My own guess is that RCP6.5 is about the most reasonable value for 2100 based on current trajectories and no serious decarbonization in most of the world. (The values represent the radiative forcing, so 6.5 means a change of 6.5W/m2 rather than RCP6 with 6.0W/m2).
Anyway, the point is that finding a worst case climate model scenario on a worse case perfect storm population/energy/technology future is not a good basis for calling for “urgent action”.
And that is a large part of the point of this article. To me it is indisputable that we are warming the world with more emissions of CO2 by burning fossil fuel. The consequences that follow are very unclear, even to climate scientists.
And climate scientists express this uncertainty very clearly in their papers.
Following on from the difference between RCP6 and RCP8.5..
Simply providing enough natural gas to developing countries, instead of coal will move the trajectory much closer to RCP6.
That seems like an easy solution, quite cost-effective, and at worst will need pretty low incentives to make it happen.
A correction, reviewing my own notes, RCP6 corresponds to 720ppm of CO2, not a doubling of CO2.
RCP4.5 corresponds to 580ppm – just over doubling CO2 from pre-industrial times of 280ppm.
My past calculation is that a realistic scenario of a world which follows the last half century of trajectories (e.g., the demographic transition as countries become richer) with minimal decarbonization will end up being an RCP6 kind of world around 2100.
And so, given that I’ve never checked what the past few decades of CO2 increases imply, I thought it was worth reviewing.
Here is IPCC AR5, chapter 2, p.167:
There is an increase of about 2ppm per year (the bottom graph shows the change per year).
The current concentration as of 2016 looks to be about 404ppm (there is a seasonal variation in CO2 concentrations).
The data in the above link also shows 2ppm per year from 2008-2017.
So a naive expectation (e.g., not accounting for increases in China and India over the next 2 decades) would be 572 ppm in 2100.
This is about RCP4.5, or 4.5W/m2 of radiative forcing.
To get to RCP8.5 requires almost 1000ppm of CO2 (plus large increases in methane concentrations).
This requires about 7ppm per year increase in CO2 starting soon.
SoD wrote: “My past calculation is that a realistic scenario of a world which follows the last half century of trajectories (e.g., the demographic transition as countries become richer) with minimal decarbonization will end up being an RCP6 kind of world around 2100.”
and: “So a naive expectation (e.g., not accounting for increases in China and India over the next 2 decades) would be 572 ppm in 2100.
This is about RCP4.5, or 4.5W/m2 of radiative forcing.”
Anthropogenic forcing has been increasing roughly linearly since about the middle of the 20th century (1950 or mid-60’s, depending on how picky you are). That is consistent with exponential growth of CO2. Extrapolating that increase to 2100 gives a forcing between 5.0 and 5.5 W/m2.
van Vuuren etal. [2011] note that actual attempts to project emissions with energy use models give results in the range of RCP4.5 to RCP6.0.
It seems to me that the middle of that range is a likely estimate for business as usual. Major innovations in energy production (which I think are almost certain) would give something lower.
Look at it in terms of fossil fuel consumption. Going from 2 ppmv/year to 7 ppmv/year would require the burning of an additional 10.7GtC of fossil fuel, and that’s assuming that none of the additional CO2 is absorbed by the various global sinks. That’s about double the current rate of consumption. I don’t see any way that fossil fuels could be produced at that rate. IIRC, RCP8.5 assumes a consumption rate near 25GtC/year in 2100. That’s simply not going to happen. A really big rock falling from the sky is far more probable, IMO.
CO2 is increasing about 2ppmv/year now. However, the best fit to the seasonally adjusted data is with a function where the rate of increase of CO2 increases each year. You get a pretty good approximation of that rate by a linear fit to the rate of change data. That has a slope of about 0.028/year. Extending that to 2100 gives about 4ppmv/year. I don’t think that will happen either.
Looking at the data, the old A1B scenario atmospheric CO2 doesn’t diverge from A1F1 or RCP8.5 until about 2050. At that point, both are higher than the linear rate of increase fit, which, IMO, is a more realistic upper limit.
There is a good discussion of the same points in this article.
Also I hope to get the time to summarize some papers which miss out RCP6.
SOD,
Thanks for another well reasoned post.
I do wish people would keep in mind that CO2 is only 60-65% of total radiative forcing, and that mitigation efforts, if they are to be taken at all, should not focus only on CO2 and ignore all the other GHG contributions.
As I have watched the (glacial) evolution of climate science thinking over the past decade, I begin to perceive a growing realization among climate scientists that control of fossil fuel use, as would be needed to reach the lower RCP levels, is practically and politically out of reach. There is even now some (begrudged) acknowledgement that geo-engineering may be needed within a century if warming rates turn out to be much higher than at present. Most problems that have faced humanity have been resolved via technology; I see little reason why this will change.
[…] tu o notowanym wzroście w skali 100-lecia równym 0,7 zamiast 1,1 °C, czyli wolniejszym o 40%! W innym miejscu możemy poczytać notkę o tym, jak wysoką niepewnością cechuje się sztuka modelowania – […]
You say: “This means that if we continue with “business as usual” (note 3) and keep using fossil fuels to generate energy, then by 2100 the world will be warmer than today.”
I chose this quote because the first thing that came to mind was wishful thinking, closed mindedness and a need to justify the scientific community:
By “if we continue” I can only presume you mean all of us? You want us to stop driving our cars to work and heating our homes in winter? Why do you suppose that reasonable people do these things knowing full well that they are polluting the atmosphere and leaving a poisonous legacy for their children?
The answer is that they have no choice but to do such things. At a time when we have more scientists than ever before in the written history of the world, it appears that they find it impossible to imagine a clean, non-polluting energy supply. Not only that, but these same scientists have been active in suppressing any attempts to answer the problem. (see my website for examples)
The only answer that science seems to posses is to make us all feel guilty for their own failure. It’s like a version of original sin… the fall of mankind who did not listen to the god of science.
The truth of the matter is that about one hundred years ago an answer to the problem was in sight. A highly efficient energy source had been found and work was about to start on harnessing it. In answer to this the energy dictators, afraid of losing shed loads of money, threatened to withdraw funding to any scientist who persisted in the genuine study of electricity and its properties. This is well documented in the case of Nikola Tesla but it’s rarely mentioned with regard to the scientists who were working along similar lines. It’s all there, documented, if you care to do a little research.
cadxx
cadxx,
Reality is reality regardless of how uncomfortable or comfortable it makes you, me or anyone else feel.
Basically, the consequences that might flow from a proposition are irrelevant to proving the proposition.
This is a science blog, not a feel good blog. If you don’t like the proposition I don’t care. If you have a scientific argument against the inappropriately-named “greenhouse” effect, wander over to that article – The “Greenhouse” Effect Explained in Simple Terms – or any of the hundred other building blocks developed in this blog, and make your comments there.
[ Moderator’s note – comment moved to The “Greenhouse” Effect Explained in Simple Terms ]
[ Moderator’s note – comment moved to The “Greenhouse” Effect Explained in Simple Terms ]
[ Moderator’s note – comment moved to The “Greenhouse” Effect Explained in Simple Terms ]
[ Moderator’s note – comment moved to The “Greenhouse” Effect Explained in Simple Terms ]
[ Moderator’s note – comment moved to The “Greenhouse” Effect Explained in Simple Terms ]
Looks like I’m very late here.
I agree that it is, in your own words, that “Perhaps reasonable people can question if climate change is definitely the greatest threat facing humanity?”
I would propose, however that your question is a bit of a straw man. Arguing that climate change deserves strong action is not synonymous with asserting that it is “definitely the greatest threat facing humanity”. It’s perfectly possible to believe that, just for instance, nuclear war is a more significant threat but also that we should take urgent action on climate change.
Secondly, it’s rather revealing that many (most?) skeptics do question the basic and accepted science. The posts under your OP show exactly that, just for instance. I’d suggest that this is because their arguments against action are weak, given that science.
vtg,
The science suggesting urgent action is required now is weak. That’s covered mainly in the IPCC WG-2 reports on impacts, adaptation and vulnerability and the WG-3 reports on mitigation. Those reports are nowhere near as solid as the WG-1 report on the physics. There are a lot of citations from the gray literature rather than peer reviewed scientific journals. In other words, just because the temperature is rising doesn’t mean that we can or should do anything other than what we’re doing now. And that’s not to mention that we don’t, in fact, know how much the temperature is going to increase. The 2°C ‘limit’ is a number that was pulled out of the air or some darker place.
Urgent action is also simply not in the cards for decades. It would have to be global, not just in the EU and USA. China and India are not going to cut emissions by 6%/year like Hansen’s lawsuit demands the US do. If the US were somehow magically able to accomplish that feat, and I use the term magically advisedly, it would have little effect on the atmospheric CO2 trend. The US is no longer the number one carbon emitter and we’re likely to fall further down the list as time passes.
Atmospheric CO2 isn’t going back to 350ppmv any time in the next century or two. Anyone who thinks it can be done, absent the zombie apocalypse or other non-climate related catastrophe that drastically reduces the global human population, is living in a fantasy world and engaging in magical thinking.
Hi Payne,
Thanks for the response.
I’d respectfully disagree with your assertion that “The science suggesting urgent action is required now is weak”. I’m familiar with WG2, 3 and the history of the 2C figure, There are arguments both ways on whether that is a conservative number or not for dangerous climate change.
The rest of your post is about political pragmatism. I do think there is a pragmatic argument that mitigation action is impossible and therefore should not be attempted. However, that’s a political rather than technical argument about whether it is the best course of action from a cost/benefit perspective.
I’ll try and post something tomorrow about why I see the technical case for mitigation as overwhelming.
verytallguy, sorry your comment was stuck in moderation for a few hours for reasons unknown. The site is hosted by WordPress and they “take care of trapping suspect comments”, even though half the time I can’t see any reason why..
vtg,
Political pragmatism is exactly the point. Urgent action isn’t being taken because the majority of the people are not convinced it’s as important as other pressing problems like education and health care. The reason they aren’t convinced is that the case for urgent action is weak. Your opinion that it’s strong is a minority opinion. It also has nothing to do with the fringe that believes the greenhouse effect isn’t real.
When asked to rank needs, climate change action came out last of sixteen different areas of concern, behind phone and internet access. I would say that’s strong evidence that the case for urgent action is weak.
http://data.myworld2015.org/
Decarbonizing the economy is not going to be easy, fast and inexpensive, quite the opposite. It will take a lot of new technology that may turn out to be not feasible. It will take many decades of slow progress. Trying to do it faster will only waste money that could be better used for more immediate problems that most people think are more important.
I agree with DeWitt. It seems unlikely that we will ever get to 2 K of warming. At 2 K, the positive and negative effects of warming seem to be about equal. It is only past that point (especially past 2.5 K) that the negative effects really begin to dominate. The best way to deal with the negative effects is to let poor countries develop the wealth that allows for resilience in the face of challenges.
Mike:
That is not what DeWitt said above. I do not know would be amazed if he agreed with it, as it is flatly contradicted by the science, for instance
http://www.nature.com/nclimate/journal/v7/n9/full/nclimate3352.html?foxtrotcallback=true
Mike:
An assertion without citation. There are, in reality very few, if any studies showing this. For instance, here is Richard Tol (not noted as a supporter of consensus, to put it mildly):
Mike:
More assertion. Forgive me if at this point through your paragraph I’ve had enough of showing the evidence that you’re wrong. I’ll leave you with the challenge of providing evidence to back up this one.
verytallguy,
You have a nasty style of arguing. You made a vague assertion without support, then snidely accuse me of making assertions without support. I made those assertions because I wanted to get you to replace your vague claim with some specifics.
verytallguy: “That is not what DeWitt said above.”
DeWitt said that the science does not support drastic action. I agree. I suppose I could have worded that more clearly, but I don’t think it was hard to understand.
You wrote that my statement that “it is unlikely that we will ever get to 2 K of warming” is “flatly contradicted by the science”. The reference you gave focuses on emissions and appears to assume a high transient response of about 2.2 K. Observational data give a TCR of about 60% of that, which reduces the median to 1.9 °C. I’d call that pessimistic since it does not allow for technical breakthroughs that will surely occur this century, even if we can not predict what they will be.
My claim was based on work by Tol, such as https://www.aeaweb.org/articles?id=10.1257/jep.23.2.29. “The fitted line in Figure 1 suggests that the turning point in terms of economic benefits occurs at about 1.1°C warming (with a standard deviation of 0.7°C).” The caption to the figure makes it clear that is measured relative to today, so about 2.0 K warming as usually measured.
From the quote you give, it seems that Tol has significantly modified his numbers. I was unaware of that and will have to look into it.
I expressed the opinion that “The best way to deal with the negative effects is to let poor countries develop the wealth that allows for resilience in the face of challenges.”
You replied: “More assertion. Forgive me if at this point through your paragraph I’ve had enough of showing the evidence that you’re wrong.”
You have a nasty style.
I note that you don’t refute any points of substance.
As you feel that way on style, I’m very happy to promise not to trouble you by replying to any of your future comments.
VTG, It seems to me that there is a very consistent track record of activists and some climate scientists dramatically exaggerating the science to make consequences seem worse than they are. You see that most strongly recently on the severe weather front with Michael Mann for example. If you look you will see this is part of a conscious public relations strategy. Hansen and the Venus thing and the west side freeway being under water fit a pattern that contributes a lot to public opinion discounting climate change as a grave threat. The public have also been desensitized to panic and fear by 50 years of media hype about “grave threats” from AIDS to overpopulation to saturated fat to vitamin supplements. In a world where perhaps half of scientific results are wrong, skepticism is justified. This will not change unless denial ceases and needed actions for change are taken.
dpy,
it seems to me that Mike Mann gave a very measured and scientifically justified assessment of Harvey.
https://www.theguardian.com/commentisfree/2017/aug/28/climate-change-hurricane-harvey-more-deadly
Please provide a citation to show his claims are not justified.
verytallguy
Quoting from The Grauniad as we English liked to call it back in the day:
In Impacts – V – Climate change is already causing worsening storms, floods and droughts I cited the IPCC SREX (Special Report on Extremes) report from 2012 with their summary.
So Mann might be with some climate scientists but there isn’t a clear consensus. Here is my extract from p.159, but I as always I recommend reading the whole SREX chapter:
The Guardian isn’t going to give space to anti-science contrarians like the IPCC of course so you won’t find this perspective in their columns.
Mann also points out that there is 3-5% more moisture in the atmosphere in that region. That part I agree with. But the main problem is the hurricane/cyclone. It might be a few % worse due to the last 100 years of warming. It’s like with cyclones in Bangladesh – the sea level rise of 0.17m over the last 100 years doesn’t help when it comes to a 6m or 10m surge. But the main problem is still the actual event. A 5.8m surge is now as bad as a 6m surge. A 9.8m surge is now as bad as a 10m surge.
It might turn out that higher average SSTs in the Gulf cause more storms, or more extreme storms or an increase in overall total energy of storms, or even an increase in landfall of overall energy of storms. It might turn out that higher average SSTs are unimportant.
Right now, as far as I can tell, no one can say (confidently in a scientific sense). I haven’t read much about storm energy so I’m a bit of a novice, just the IPCC summaries and a few papers. Maybe the evidence is strong and the contrarian IPCC are just being difficult.
You can present your evidence (and here is hoping I get to a section in the Impacts series on Storms).
SoD,
Your quotation from the SREX I think is discussing whether trends can be detected from current data, which is inevitably sparse, not the physics so much. Inability to detect a trend does not prove absence of a trend.
Mann’s main claim seems to be that given the existence and trajectory of the storm, the hotter sea made it worse, and he explicitly acknowledges that other climate effects are “more tenuous”
As to consensus on this:
http://news.nationalgeographic.com/2017/08/hurricane-harvey-climate-change-global-warming-weather/
My very limited understanding is that there is strong evidence that storms will increase in intensity, but no current expectation of a rise in frequency.
I’m afraid I don’t have the time to back this up with citations so could well be proved wrong.
verytallguy
Like I said, I am a bit of a novice in this area as well. But it’s not just finding “no trend” or “not enough data to call a trend”.
It is also about the physics. Repeating one part of my extract:
That is, on theoretical grounds different people disagree.
The citation from the IPCC SREX is Nonlocality of Atlantic tropical cyclone intensities, Kyle L. Swanson (2008):
Perhaps Swanson is an outlier. Perhaps the science is still unclear. All for discussion.
Here’s Cliff Mass’s analysis of Hurricane Harvey. It looks quite detailed and vastly more credible than Mann’s hand waving.
http://cliffmass.blogspot.com/2017/08/global-warming-and-hurricane-harvey.html
Roy Spencer has posted an historical analysis of SSTs preceding hurricane strikes in the Gulf over the past century. There appears to be no convincing correlation.
At the very least, one would have to say that expert opinion is divided.
Ken Haapala’s https://wattsupwiththat.com/2017/09/04/weekly-climate-and-energy-news-roundup-282/ is the best overview of Harvey I’ve seen .
Over at WUWT they are saying Irma is looking like a real super storm .
dpy,
so. you can’t substantiate that Mann is “dramatically exaggerating”.
As to the Cliff Mass analysis, essentially it makes the same points that Mann does but with different rhetoric and louder fonts.
We can also note:
1) It is assumed that natural variation in temperature is only ever positive, although this is not explicitly stated or justified. (this is an assumption routinely made in contrarian analyses, I know not why)
2) It is stated that the Claudius Clapeyron relationship represents an upper bound for the rate of change of rainfall with temperature again without justification.
I could go on.
Hand waving is in the eye of the beholder, I guess.
VTG: I think you are wrong on the substance of the 2 pieces in question.
Mann: “In conclusion, while we cannot say climate change “caused” Hurricane Harvey (that is an ill-posed question), we can say is that it exacerbated several characteristics of the storm in a way that greatly increased the risk of damage and loss of life.”
Mass: “The bottom line in this analysis is that both observations of the past decades and models looking forward to the future do not suggest that one can explain the heavy rains of Harvey by global warming, and folks that are suggesting it are poorly informing the public and decision makers.”
Seems like a clear difference. Mass actually does the math and goes into technical detail. Mann just does hand waving with references to old white men’s equations without doing any math. Its clear Mann already knew the conclusion before he did any calculations. The decision has to go to the man with the actual facts and data.
So, why is it reasonable to take a position that urgent action on CO2 emission reductions is needed.
The case as I see it is:
1) Given basic physics, we expect a temperature rise of the order of 3 degrees above preindustrial by end of 21st century without action, though significantly larger or smaller rises cannot be excluded. It’s also important to note that the world will not end in 2100, and the trajectory of future warming at that point will be very different dependent on mitigation taken (or not) now.
2) A rise of 3 degrees in ~200 years is very significant in geological history, so major impacts on ecosystems are very likely [see WG2]. Rises as high as 6-8C cannot be ruled out [ref AR5 WG3 table SPM-1], and such a rise would be cataclysmic.
3) As well as physical system being subject to inertia, so are human and economic systems. Changes taken, or not, now, will have huge impacts on CO2 emissions for decades to come. Particularly infrastructure.
4) Fossil fuels are finite. In the event that fossil fuel reserves are too small to allow the rises in CO2 needed for these impacts (as argued in the comments above), it is implicit that carbon dioxide emissions reductions will be made by force majeure. In that scenario reductions ahead of a resource crunch this are likely essential to avoid economic collapse. In the event that reserves *are* big enough, absent action we see a certainty of big impacts and a potential of cataclysmic impacts [see (2)]
5) There are many uncertainties. Magnitude of temperature change, regional impacts, effects of temperature change on sea level, extreme weather and ecosystems. The unpredictability of these makes adaptation either impossible or very expensive, so adds to the attractiveness of mitigation.
6) Economic models are bunk on the timescales of climate change, “close to useless”, see for instance http://www.nber.org/papers/w19244. They cannot account for the potential for societal collapse and merely codify value systems (risk perception, value of human life, value of ecosystems) which are in reality the points of debate.
7) The very worst thing we could do with early mitigation is waste a small amount of money relative to certain or potential impacts; CO2 reductions are in the medium to long term either inevitable or attractive [see 4]. Risk and reward points very strongly towards mitigation. That does not mean we should do nothing on adaptation.
Now, of course, what “urgent action” means is open to many interpretations.
Finally, an aside on models, as SoD makes them central to his argument. In my view, models are not an essential part of the case for action: basic physics (heat transfer plus assumption of constant RH and very simple ocean dynamics) gives ECS of ~3, TCS ~2. Climate models are not necessary for this result, with other lines of evidence in the same region (paleoclimate), although they could in principle falsify it if circulation effects were shown to provide strong negative feedbacks.
verytallguy,
Very interesting points. First question, what scenario (or representative concentration pathway) are you basing these values on?
They apply to all scenarios save for RCP 2.6
The table SPM-1 in WG3 SPM provides a ready summary:
Click to access ipcc_wg3_ar5_summary-for-policymakers.pdf
verytallguy,
That doesn’t stack up with IPCC wg I which suggests, chapter 12, p. 1031:
1.1°C to 2.6°C (RCP4.5)
1.4°C to 3.1°C (RCP6.0)
2.6°C to 4.8°C (RCP8.5)
I give more of the extract in Impacts – IV – Temperature Projections and Probabilities
The devil is in the detail ie footnotes, most notably
verytallguy,
I’m having trouble squaring up this report vs working group 1 (WG 1).
The CO2 concentrations for RCP6 don’t seem to match this table. This table in WG 3 has 720–1000ppm for RCP6. This is different from WG 1.
Also, as the WG 1 reports say, the model outputs don’t provide any kind of probability density function but it seems that by WG 3 that is ignored and they are used as pdfs. I noted this in Impacts – IV – Temperature Projections and Probabilities under the sub-heading “Probabilities and Lists”, concluding with:
WG 3 is like a new world, unrelated to WG 1.
At some stage I will devote some time to trying to make sense of it.
SoD,
I share your confusion on the CO2 concentrations in the WG3 table, though they are roughly in line with the RCPs. I don’t know enough on the WG3 methodology to comment.
I don’t recognise your figures from WGI chapter 12. Here’s what I see there:
Looking at table 12.2, page 1055 we have:
RCP 4.5: 2.3 (1.4 to 3.1)
RCP 6.0: 3.7 (no range given)
RCP 8.5 : 6.5 (3.3 to 9.8)
All of these then need 0.61 adding to bring the initial baseline from 1850 to 1900 rather than 1986-2005 to be directly comparable to the WG3 table.
Additionally the final baseline is also different in that the WG3 figures are for 2100 whereas the WG1 figures are for 2081-2100 average. That will cause an additional increment, higher for the higher concentration RCPs where the rate of increase will be higher.
The reported figures from the WG3 table are:
RCP 4.5: 2.6 (1.5 to 4.5) [using the total range from both RCP 4.5 numbers in the table]
RCP 6.0: 3.4 (2.1 to 5.8)
RCP 8.5 : 4.5 (2.8 to 7.8)
Taking into account the baseline differences, the medians for WG3 table seem to be lower than the WG1 table, indeed considerably lower for RCP6.0 and RCP 8.5.
The differences, whilst perhaps interesting, are not large enough to be relevant to the arguments I put forward, I think.
verytallguy,
The numbers you show from WG1 from table 12.2, page 1055, are for the year around 2200, not 2100.
Thanks, I thought I’d probably done something really stupid.
So the correctly reported figures from table 12.2, WGI are (as you said):
RCP 4.5: 1.8 (1.1 to 2.6)
RCP 6.0: 2.2 (1.4 to 3.1)
RCP 8.5 : 3.7 (2.6 to 4.8)
The reported figures from the WG3 table are:
RCP 4.5: 2.6 (1.5 to 4.5)
RCP 6.0: 3.4 (2.1 to 5.8)
RCP 8.5 : 4.5 (2.8 to 7.8)
The baseline discrepancies I describe above bring these into pretty close agreement, at least for the medians. The top ends for the WG3 numbers look more different.
Again, the differences don’t affect the policy argument materially, at least in my view.
verytallguy,
And very interesting paper – Climate Change Policy: What Do the Models Tell Us. What can economics tell us?, Robert S. Pindyck (2013)
As the paper suggests, not much really.
They also reference a paper – Welfare Costs of Long-Run Temperature Shifts with this introduction:
Perhaps this is the missing piece of recent reductions in economic productivity that has puzzled economists for so long. I will dig a little deeper.
A few interesting extracts from Pindyck’s paper:
The first extract reminds me of the comment from Timothy Taylor that was in part the inspiration for this series. Here is what I said in the introduction to this series:
verytallguy,
Irony alert.
You cited Climate Change Policy: What Do the Models Tell Us. What can economics tell us?, Robert S. Pindyck (2013).
This paper says:
Very interesting.
Yet Pindyck also says in his paper:
This referenced paper – Welfare Costs of Long-Run Temperature Shifts, Bansal and Ochoa – says:
So it turns out that Bansal and Ochoa don’t show that increases in temperature have a negative impact on economic growth but instead just assume it.
All very helpful in demonstrating the house of cards that is economic forecasting generally and specifically economic forecasting in a future warming world.
If you have some comment that brings some sanity back to this Alice in Wonderland experience now is the time to share it.
Far from it.
If you use the same methodology to assess whether it would be worth investing a modest % of GDP now to repel an Earth destroying asteroid strike in a century’s time, the economics would conclude that on an NPV basis we should do nothing, as even total armageddon then still means we will have added value over the century.
vtg,
Indeed.
Do you consider the recent Paris Accords to be in the urgent action category?
They struck me as “jam tomorrow” but I’m not really well informed enough on their content to comment with any authority to be honest. How about you?
I love Lewis Carroll references. “The rule is, jam tomorrow and jam yesterday — but never jam today.” is, in my opinion, a good description of the Paris Accords, much like the original Kyoto Protocol.
I also am particularly fond of the Humpty Dumpty Theory of Language.
https://www.fecundity.com/pmagnus/humpty.html
VTG, I think these differences in how much the planet will warm are important for policy considerations. What you did really amounts to cherry picking higher numbers by using 2200 and going back to 1850-1900. RCP 8.5 is most people think quite unlikely. Why do people continue to use it then?
In fact, there is a lot of evidence coming to light of rapid climate changes in the past and its a rapidly growing area of climate science. So its problematic to say those warming rates are unprecedented. It’s a subject of current active research.
IPCC projections are in fact based on GCM’s so to say they are not central to these projections is wrong. Quite a few would disagree with your characterization of the evidence on ECS too.
dpy,
Cherry picking? I made a transcription error, which I immediately acknowledged.
I did not anywhere state that the IPCC do not use GCMs.
I did not claim anything was “unprecedented”.
You seem to be making things up.
VTG, The point here which you didn’t really respond to is that all of your points are easily disputable. You state them as an advocate would without any acknowledgement of disagreements among scientists.
What strikes me is how the ground on which these issues are discussed has changed in the last decade.
1. With regard to ECS, the trend has been downward particularly for energy balance estimates using historical temperature trends. Lots of things contributed to this including the realization that uniform priors were really bad statistical practice. It is amazing to me how the defense of these methods lasted so long. But climate scientists are particularly resistant to input from statistician. Similarly, there have been some lower paleoclimate estimates recently too. Even the IPCC has “adjusted” their estimate for likely decadal warming below GCM mean predictions.
2. Likewise, the ground on which GCM’s are discussed has also shifted with the belated acknowledgement by the modelers themselves of the complex and non-transparent nature of the tuning required. There is now a very healthy trend to discuss more openly these issues. Likewise after a long period of denial, the lack of skill with regard to regional climate predictions has been more or less acknowledged.
3. There has been an acknowledgement that data and models disagree about the tropical lapse rate and that this could be bad news for GCM’s.
These are all good things and the second is personally gratifying to me.
dpy
In which case, one can only wonder why you felt the need to invent a number of points I did not, in fact, make.
The points you follow up with are, of course, equally if not more easily disputed.
Then, hilariously:
Complaints about a lack of scientific language would be rather more credible if not followed immediately by the vexatious:
and the banned at this blog
OK, aside from sniping, what about the substance of what I said? The ground on which these issues are being discussed has shifted significantly, calling into question the use of IPCC estimates of long term warming. And we can discount RCP8.5, n’est pas? My 3 points I think should cause one to question the IPCC projections based as they are on GCM’s.
On the substance, I don’t recognise your description of the ground having “shifted significantly”. Quite the opposite; the range in ECS remains essentially unchanged for perhaps 40 years. Or perhaps you can point to a review article claiming otherwise??
As to projections being based on GCMs, sure. But consider a Gedankenexperiment where GCMs are not computationally possible. What range of projections would we have? Essentially the same, as I point out above.
VTG, As Mike N said above, you have a nasty style of arguing. It’s rhetorical misdirection away from substance.
It is clear that even the IPCC in AR5 lowered their projection of decadal warming below the GCM mean. This clearly disproves your specious claim that without GCM’s the projections would be the same.
Your argument about ECS ranges is likewise deceptive. My point is that there are a vastly larger number of lower estimates of ECS than there were 15 years ago. Recall that in AR3 some of the observational studies were “redone” using uniform priors so that the result was higher. That practice has ceased with the result that observational studies have lower ECS estimate than in previous IPCC reports. The ground of debate has now shifted with the alarmed claiming that observational studies only measure short term feedbacks and that thus true ECS (on millennial time scales) is higher. This is another example of how the ground has shifted.
From Knutti et al, 2017, Nature Geoscience
dpy,
it really would be better if you kept away from the personal invective given your own contributions here.
Already in this thread you have been advised:
And you rather readily throw around unpleasant insinuations:
I do though like the conspiratorial thinking of my forming part of a:
Most entertaining.
Moving on to your point on Knutti (2017), I’m alas unable to access the full paper. Please point me to a link to it if you can.
I’m assuming it’s this one (in general it’s best to provide a link for the absence of doubt over your citation):
http://www.nature.com/ngeo/journal/vaop/ncurrent/full/ngeo3017.html?WT.feed_name=subjects_climate-sciences
Your interpretation of it favouring your position appears from the abstract to be entirely untenable, as Knutti observes:
My claim, which you are disputing is:
Knutti appears on the face of it to provide an almost exact paraphrase of my claim.
I look forward to reading how the paper contradicts the abstract. Unless of course your quote was “rhetorical misdirection away from substance”, that is.
It’s hard to respond to content free misdirection, VTG. Knutti explicitly supports my assertion which you denied, that the ground has shifted in climate science on the question of ECS. I am correct and you are wrong, but constantly shifting the goal posts. The ground has shifted in the ECS discussion and Knutti is precise evidence of that shift. The new ground is to find reasons why observationally based studies are an underestimate. The old standbys of uniform priors no longer work and have been discredited. This is not unusual in climate science where old papers and methods are never corrected or retracted.
It is pity that you can’t access the paper. It’s available for a small charge.
It would be helpful if you could actually respond to substance rather than mining for any way to discredit the substance.
This is really very simple. The ground has shifted in the ECS debate (as Knutti proves) and the IPCC range of ECS has not changed since the Charney report. You responded to my obviously true assertion with a different statement as if it disproved my assertion, when it didd no such thing. That’s what Mike meant by “nasty style of arguing.” There is no contradiction with regard to ECS. The IPCC range has not changed. And the ground has shifted. I am surprised that you are arguing something where the truth is so obvious. Can you not see that both statements can be true? Can you at least admit this, VTG?
Dpy,
Your claim that “the ground has shifted” is contradicted explicitly in the abstract – the consensus figure on ecs hasn’t changed.
You now seem to be claiming that there is new evidence on ecs, but that has *not* shifted the consensus.
Sure. New evidence emerges all the time, in every published paper. The overall consensus has not changed, presumably because the overall balance had not shifted significantly due to the new evidence. As I originally pointed out. And as knutti seems to reiterate.
OK, so even the miracle of Google didn’t turn up a pdf of the paper.
It it, however, turn up the following quite from its conclusions, please correct me if it’s wrong:
My bold.
If that’s a true quote then it’s very hard not to conclude that your earlier extract was anything other than a deliberate attempt to misrepresent the paper.
Quite a revelation, this exchange for me.
More misdirection, VTG. The IPCC consensus has changed from AR4 to AR5, with the lower end going from 2.0 back to 1.5. This is discussed in Knutti. I tried to get to common ground and you refused. It’s a nasty style of arguing as Mike N observed.
I was not misrepresenting Knutti. The issue is complex and not conducive to the sound bites and logic chopping style of thinking. And its certainly not conducive to knee jerk denial.
dpy,
I’m done. The conversation with you has been remarkable.
“Oh frabjous day!”
One more point here is interesting. Knutti goes to great lengths to argue that observational estimates of sensitivity are underestimates and that around 3 degrees C is the “best” value. I note that this argument is based on GCM’s (of course) whose skill at predicting regional climate is nil and thus whose skill at predicting “heterogenous” feedbacks is very questionable. There are various claims about “physical constraints” but the proof is GCM’s. I found this a little humorous as the last line of defense of high ECS is still and always has been GCM’s.
verytallguy,
I don’t know if global warming will increase storms, or storm severity or another metric of storms.
The IPCC report says that it’s not clear. The trends aren’t clear. The theory isn’t clear. Many climate scientists believe it is clear and that the evidence is on the side of more warming, worse storms. I don’t understand the arguments well enough to pick a winner.
I know of other fields (non-climate) where someone could read papers from different groups and declare the subject still open for debate, yet for me I can see that the argument is clearly much stronger, even overwhelming, for one side.
We may well find in 10 years time that the evidence for extreme storms becomes clearer, both in observations and in theory. Or we may find that there is no increase in trend and the theoretical arguments tip towards no increase in extreme storms.
This is my point with this article.
It’s easy to join a partisan crowd. But some important areas of climate science – suggesting significant harm from warming – are not very clear.
And yet we will see believe about extreme storms being a litmus test of ideology, painting people into two opposing partisan camps. Good vs evil, angels vs devils.
I don’t think it’s helpful or good.
SoD,
understood, and I largely agree with you, although I think I have a somewhat different perspective.
On the science:
According to AR5 WG1 Table SPM.1, it is “more likely than not” that storm severity will increase in some basins by the end of the century, and “very likely” that heavy precipitation events will “increase in the frequency, intensity, and/or amount of heavy precipitation”. For the latter, there is already “medium confidence” of human influence on “likely” changes already observed.
Perhaps, although I’ve not seen much evidence of this myself; doubtless you can give some examples. I have seen extreme partisanship on the avoiding of linkages, eg
Now there’s partisanship!
What I would say is that *not* talking about extreme storms or rainfall events such as Irma or Harvey, when the balance of evidence shows that we expect these to increase, is equally a partisan act as choosing to talk about that aspect of them.
The Cliff Mass blog I linked to earlier does a very careful job of assessing Gulf Coast rainfall. It concludes there has been no historical trend and that models show no significant changes with warming. Models are probably not reliable for this however. He calculates that rainfall from Harvey might have been 1 inch higher due to warming under worst case assumptions for warming and its effects. That is insignificant in terms of damages or deaths. It does seem that many scientists are way out in pseudo-science territory here, including Mann and Myles Allan. My view is that such “pseudo-science” should be left to the National Enquirer and only serves to discredit scientists who use it as a political tool.
Handwaving from “basic thermodynamics” is just that. I’ve heard this argued both ways as you would expect with such BS. Decreased pole to equator temp gradient should result in less severe mid attitude weather. Warmer seas should lead to worse tropical storms, but wait maybe its the differences in temperature that control the strength of vertical convection.
The problem here SOD is that there is a conscious public relations strategy that has evolved in the activist community to emphasize extreme weather as a way to get action. That should lead to a high level of suspicion of vague qualititative claims. VTG seems to be in this camp.
It’s been known for 60 years that convection is an ill-posed problem. Current models and their lapse rates seem to be contradicted by data in the tropics (as shown even at Real Climate). We know GCM’s use incredibly crude grids there and have virtually no hope of being credible. Tropical storms are not going to yield to this type of modeling. Something better is needed. I’m not in the field, but perhaps some new theoretical understanding is needed. I am suspicious that the tropical lapse rate theory may be wrong though. Perhaps you have some thoughts on this.
Add pointed out earlier, it’s not remotely a “worst case”. Claiming it is does not make it so.
What Cliff did was to assume the worst case for current warming attribution to man. He showed the impact on HARVEY precipitation was small. In addition no effect on steering winds either.
Reading the post would help you not just pick nits and address the main points.
No, that’s not what he did. It’s what he says he did.
What he actually did was assume that natural variation can only be positive.
That is by no means a “worst case”, in fact, its a median outcome.
I suggest you read his maths rather than his rhetoric.
Well, aside from nit picking, Mass’s main point is that global warming cannot be said to have had any significant effect on Harvey’s rainfall or slow rate of movement. And its far more detailed than Mann’s science free assertions in the Guardian. VTG, Isn’t that correct (aside from nit picking)?
dpy,
I guess your “nit picking” is my “fundamentally incorrect approach”.
As to significance, if an already record breaking event is worsened by a few % more, that’s pretty significant, is it not? Even with the limited warming to date.
And now you’re criticising an article in a newspaper for not having enough equations in it? Seriously?
VTG and SOD: The disagreement about an discount rate discussed technically by Pindyck can be described more intuitively. That explanation has interesting consequences.
If our economy grows over the next century like it did over the last century, then my descendants a century will be much richer than we are and perfectly capable of dealing with the cost of adapting to climate change. This would be no point in mitigation today, especially if it significantly suppresses the rate of economic growth. However, if our economy suffers from growing problems of resource depletion, environmental degradation, sustainability, stagnation, etc., my descendants a century from now could be lucky to be as well off as I am today even without climate change. Climate change could send them into an irreversible downward spiral, where the increasing costs of adaptation are more than the increase in affluence. Pindyke says (top p 867):
“In the simplest (deterministic) Ramsey framework, that discount rate is R = δ + ηg, where g is the real per capita growth rate of consumption, which historically has been around 1.5 to 2 percent per annum, at least for the United States. Stern (2007), citing ethical arguments, sets δ ≈ 0 and η = 1 , so that R is small and the estimated SCC is very large. By comparison, Nordhaus (2008) tries to match market data, and sets δ = 1.5 per- cent and η = 2, so that R ≈ 5.5 percent and the estimated SCC is far smaller.”
So much of the debate about the correct discount rate to use arises from different expectations for future economic growth without climate change. It gets more interesting when we turn our attention to developing or undeveloped countries. Those countries know that rapid economic growth over the next century is real possibility – the developed world has already done it. China is doing it right now. China chose a development path that increased their current per capita emissions to equal those of the EU and they are moving in opposite directions. For developing countries, the expected growth rate is high and their discount rate is low and SCC are low. All of the future growth in emissions will come from developing countries (roughly the difference between an optimist RCP6.0 and a pessimistic RCP8.5) and depends mostly on what these countries choose to do. Whether they calculate an appropriate discount rate using Ramsey formalism or reason more intuitively, they are likely to disagree with elite policymakers in developed countries, who are not optimistic about the future. It is hard to imagine a solution to this problem.
Lomborg published some very misleading results using the MAGICC model about the minimal impact of the Paris Accords that received a lot of publicity. Hidden in the Supplementary Material were results based for scenarios one could understand: a) All countries continue current emissions until 2100. b) All countries follow the Paris Accord until 2030 and then continues emitting at the same level until 2100. The difference in 2100 was 0.5 degC of warming. Despite all of the hoopla and substantial emissions reductions in developed countries, emissions growth over the new 20 years in developed countries followed by stability is worth 0.5 degC more warming compared with stability starting right now. As it turns out, emissions growth in the developing world in the 20 years of the Paris Accord under optimistic growth will be exactly the same as the preceding 20 years under the Kyoto Agreement (which placed no constrains on their emissions). Their nationally determined emissions were basically emissions growth as usual.
http://onlinelibrary.wiley.com/store/10.1111/1758-5899.12295/asset/supinfo/gpol12295-sup-0005-FigureS4.pdf?v=1&s=d6a273bb8a1fcdcebd6672b89e69bcb549ff5b48
http://onlinelibrary.wiley.com/doi/10.1111/1758-5899.12295/full
[…] on the distinction between constitutional and legislative change, a subject I must come back to. * The Debate is Over – 99% of Scientists believe Gravity and the Heliocentric Solar System so theref… – Science of Doom. * Yet More on the Book of Errors Titled “Democracy in Chains” – […]
[…] on the distinction between constitutional and legislative change, a subject I must come back to. * The Debate is Over – 99% of Scientists believe Gravity and the Heliocentric Solar System so theref… – Science of Doom. * Yet More on the Book of Errors Titled “Democracy in Chains” – […]
[…] on the distinction between constitutional and legislative change, a subject I must come back to. * The Debate is Over – 99% of Scientists believe Gravity and the Heliocentric Solar System so theref… – Science of Doom. * Yet More on the Book of Errors Titled “Democracy in Chains” – […]
The article is great, but this:
// At least 99.9% of physicists believe the theory of gravity, and the heliocentric model of the solar system. The debate is over. //
It’s simply untruth.
If you’ve meant GTR – yes, it perfectly fits with a great range of observations, yet there are big problems in it (a conflict with QM, to name only one of them) and the effort to find better theory is huge. Quantum gravity, strings/m-theory, entropic gravity … they try so hard…
But perhaps the analogy is even better then you intended…?
Kind regards,
marekkulczycki: We might ask what we mean by saying we “believe in a theory”:
1) There is some risk in believing the mechanisms underlying a theory. The theory of gravity postulates the existence of a force, but in general relativity this turns out to be a pseudo-force produced by a distorted frame of reference (like centrifugal force).
2) There is some risk in believing in the predictions of a theory outside the bounds of experimental testing and beyond the uncertainties of the experiments. Dark matter has been postulated to exist because we believe the law of gravity applies on a galactic scale. Quantum mechanics was invented because Newton’s and Maxwell’s laws obviously didn’t apply to nuclei and electrons.
3) A hypothesis becomes a theory when it has survived repeated stringent experiments designed to expose any inconsistency between observations and predictions made by the theory. We can believe in the predictions of a theory within the bounds of that experimental testing and the uncertainties of these experiments. Any valid new theory will make the same predictions; as was the case when Newton’s Laws of Gravity were supplanted by General Relativity.
@Frank
I did a wrong thing by posting my comment. The author clearly says: “An analogy doesn’t prove anything. It is for illumination.”
I just couldn’t stay calm after reading that debate over gravity might be over 🙂
The article is not about gravity, neither QFT, and cosmology, so I will touch the topic of dark matter only this one time: 😉
It’s not that physicists believe in GTR so much, that they want to keep it alive at any cost. It’s rather that GTR + dark matter fits the observed data best – so far. See Sean Carroll’s lecture if you don’t believe me https://youtu.be/iu7LDGhSi1A
Except that I agree with what you have said. Yet, the factor of faith has a lot to do with science and even more – with scientists. CAGW looks a lot like religion to me (and a false one too). I am referring to papers on the subject, not to youtube and “deniers’ ” blogs.
Cheers.
marekkulczycki: Many climate skeptics correctly note that scientific theories evolve. They assert that perceived contradictions between conventional physics (vigorously supported by this blog) and “evidence” they cite could disappear someday. To the extent that current scientific theory is well-grounded by relevant experimental observations, the predictions of any new theory MUST agree with the predictions of the current theory.
For example, many skeptics have difficulty with the idea that DLR from GHGs delivers energy absorbed by the surface of the planet, appearing to violate the 2LoT. How firmly grounded in experiment is our understanding of the emission of thermal IR by GHGs? Why do we use a single cross-section for both absorption (thoroughly studied) and emission in Schwarzschild’s Equation for Radiative Transfer? (Actually, we don’t. The emission cross-section is o*[B(lambda,T)], where o is the absorption cross-section.) I wrote a Wikipedia article on Schwarzschild’s equation intended to make skeptics more comfortable with the predictions of radiative transfer calculations. If you have any expertise in this area, I’m looking for feedback.
https://en.wikipedia.org/wiki/Schwarzschild%27s_equation_for_radiative_transfer
(a) By 2017, the number of published studies on climate modeling assuming man-made climate change was over 15,000
(b) The number of published studies of controlled experiments measuring surface warming due to infrared emitted by carbon dioxide remains zero.
But all of those modeling studies (a) assume knowledge of the results of (b).
31 years of hysterical climate alarmism. Tens of billions of dollars spend on climate research. But not a single “scientist” wants to know (b). Why not? Why are “climate scientists” the least curious scientists on earth?
Why do “99% of scientists” not give a damn about reality?
Mark4asp: Confirmation bias makes it very difficult for us humans to assimilate and recall facts that are inconsistent with our deeply-held beliefs. Scientists have an obligation to fight against confirmation bias. The following facts may assist you:
a) Climate scientists do model experiments with observed changes in natural forcing like total solar irradiance and volcanic aerosols. They compare them to experiments with changes in both natural forcing and anthropogenic forcing (mostly GHGs and aerosols). Natural forcing alone produces little change in climate. When anthropogenic forcing is added, there is warming similar to what we have observed
b) Unfortunately we don’t have two Earth’s: one with and one without added CO2. So we can’t do a properly controlled study. We are currently performing an uncontrolled study in which we appear likely to at least double CO2 while changing other forcings. So far, the combined anthropogenic forcing appears equivalent to about 2/3rds of a doubling and we have about 1 K of transient warming. So a doubling will likely be associated with a transient warming of 1.5 K. Since about 30% of current forcing is still being consumed by warming the deep ocean, projected equilibrium warming (with no heat entering the deep ocean) would be about 2 K. The assessment that current conditions are equivalent to 2/3rds of a doubling comes with significant uncertainty.
NONE of the values in paragraph b) come from climate models. (In fact, the above numbers disagree with the output of climate models.) Forcing by GHGs is calculated based on measurements made in the laboratory and applied to radiation transfer through our atmosphere. The predictions of those calculations have been confirmed by numerous experiments done in our atmosphere. There is little doubt that an instantaneous doubling of CO2 would reduce radiative cooling to space by about 3.5 W/m2. The law of conservation of energy demands warming until this radiative imbalance is eliminated!
We can’t determine how much warming will be associated with a 3.5 W/m2 reduction in radiative cooling to space without knowing how emission of OLR and reflection of SWR change with warming – the warming that is restoring radiative balance. AOGCMs provide this information. Unfortunately, AOGCMs don’t do a good job of predicting the changes in OLR and SWR observed from space in response to seasonal changes in temperature.
Climate modelers can appear to not give a damn about “reality” because their models provide a much clearer picture of climate change than they can obtain from flawed observations of climate change: poorly-sited, moving thermometers with inexplicably inhomogeneities compared when compared with nearby thermometers; in the ocean, switching from thermometers in wooden or canvas buckets to the engine cooling water intake to stationary or drifting buoys; satellites that drift from their projected orbits with instruments that deteriorate and can’t be re-calibrated; tide gauges that require decades to detect one inch/decade of SLR against the background of SLR natural variability. Reality is pretty ugly, AOGCMs can’t be validated, natural variability is large, making projections for policymakers without AOGCMs is impossible, and climate scientists are receiving massive funding to produce answers.
Reblogged this on Climate- Science.