In the recent articles we mostly reviewed climate models’ successes or otherwise with simulating the last glacial inception.
Part Seven looked at some early GCM work – late 80′s to mid 90′s. Part Eight reviewed four different studies a decade or so ago. Part Nine was on one study which simulated the last 120 kyrs, and Part Ten reviewed one of the most recent studies of glacial inception 115 kyrs ago with a very latest climate model, CCSM4.
We will return to glacial inception, but in this article we will look at the end of the last ice age, partly because on another blog someone highlighted a particular paper which covered it and I spent some time trying to understand the paper.
The last 20 kyrs now have some excellent records from both polar regions. The EPICA project, initiated almost 20 years ago, has produced ice core data for Antarctica to match up with the Greenland NGRIP ice core data going back almost 800 kyrs. And from other research more proxy temperature data has become available from around the globe.
Shakun et al 2012
This paper is from Shakun et al 2012 (thanks to commenter BBD for highlighting it). As an aside, Bette Otto-Bliesner is one of the co-authors, also for Jochum et al (2012) that we reviewed in Part Ten. She is one of the lead authors of the IPCC AR5 for the section on Paleoclimate.
The Last Glacial Maximum (LGM) was around 22k-18 kyrs ago. Sea level was 120m lower than today as thick ice sheets covered parts of North America and Europe.
Why did it end? How did it end?
The paper really addresses the second question.
The top graph below shows Antarctic temperatures in red, CO2 in yellow dots and global temperatures in blue:

From Shakun et al 2012
Figure 1
The second graph shows us the histogram of leads and lags vs CO2 changes for both Antarctica and global temperature.
We can see clearly that the Antarctic temperatures started a sustained increase about 18 kyrs ago and led the global temperatures. We can see that CO2 is slightly preceded by, or in sync with, Antarctic temperatures. This indicates that the CO2 increases here are providing a positive feedback on an initial Antarctic temperature rise (knowing from basic physics that more CO2 increases radiative forcing in the troposphere – see note 1).
But what caused this initial rise in Antarctic temperatures? One possibility put forward is an earlier rise in temperature in the higher northern latitudes that can be seen in the second graph below:

From Shakun et al 2012
Figure 2
..An important exception is the onset of deglaciation, which features about 0.3ºC of global warming before the initial increase in CO2 ,17.5 kyr ago. This finding suggests that CO2 was not the cause of initial warming.
..Substantial temperature change at all latitudes (Fig. 5b), as well as a net global warming of about 0.3ºC (Fig. 2a), precedes the initial increase in CO2 concentration at 17.5 kyr ago, suggesting that CO2 did not initiate deglacial warming. This early global warming occurs in two phases: a gradual increase between 21.5 and 19 kyr ago followed by a somewhat steeper increase between 19 and 17.5 kyr ago (Fig. 2a). The first increase is associated with mean warming of the northern mid to high latitudes, most prominently in Greenland, as there is little change occurring elsewhere at this time (Fig. 5 and Supplementary Fig. 20). The second increase occurs during a pronounced interhemispheric seesaw event (Fig. 5), presumably related to a reduction in AMOC strength, as seen in the Pa/Th record and our modelling (Fig. 4f, g).
..In any event, we suggest that these spatiotemporal patterns of temperature change are consistent with warming at northern mid to high latitudes, leading to a reduction in the AMOC at ~19 kyr ago, being the trigger for the global deglacial warming that followed, although more records will be required to confirm the extent and magnitude of early warming at such latitudes.
The interhemispheric seesaw referred to is important to understand and refers to the relationship between two large scale ocean currents – between the tropics and the high northern latitudes and between the tropics and Antartica. (A good paper to start is Asynchrony of Antarctic and Greenland climate change during the last glacial period, Blunier et al 1998). Perhaps a subject for a later article.
Then a “plausible scenario” is presented for the initial NH warming:
A possible forcing model to explain this sequence of events starts with rising boreal summer insolation driving northern warming. This leads to the observed retreat of Northern Hemisphere ice sheets and the increase in sea level commencing, 19 kyr ago (Fig. 3a, b), with the attendant freshwater forcing causing a reduction in the AMOC that warms the Southern Hemisphere through the bipolar seesaw.
This is a poor section of the paper. I find it strange that someone could write this and not at least point out the obvious flaws in it. Before explaining, two points are worth noting:
- That this is described a “possible forcing model” and it’s really not the paper’s subject or apparently supported by any evidence in the paper
- Their model runs, fig 4c, don’t support this hypothesis – they show NH temperatures trending down over this critical period. Compare 4b and 4c (b is proxy data, c is the model). However, they don’t break out the higher latitudes so perhaps their model did show this result.

From Shakun et al 2012
Figure 3
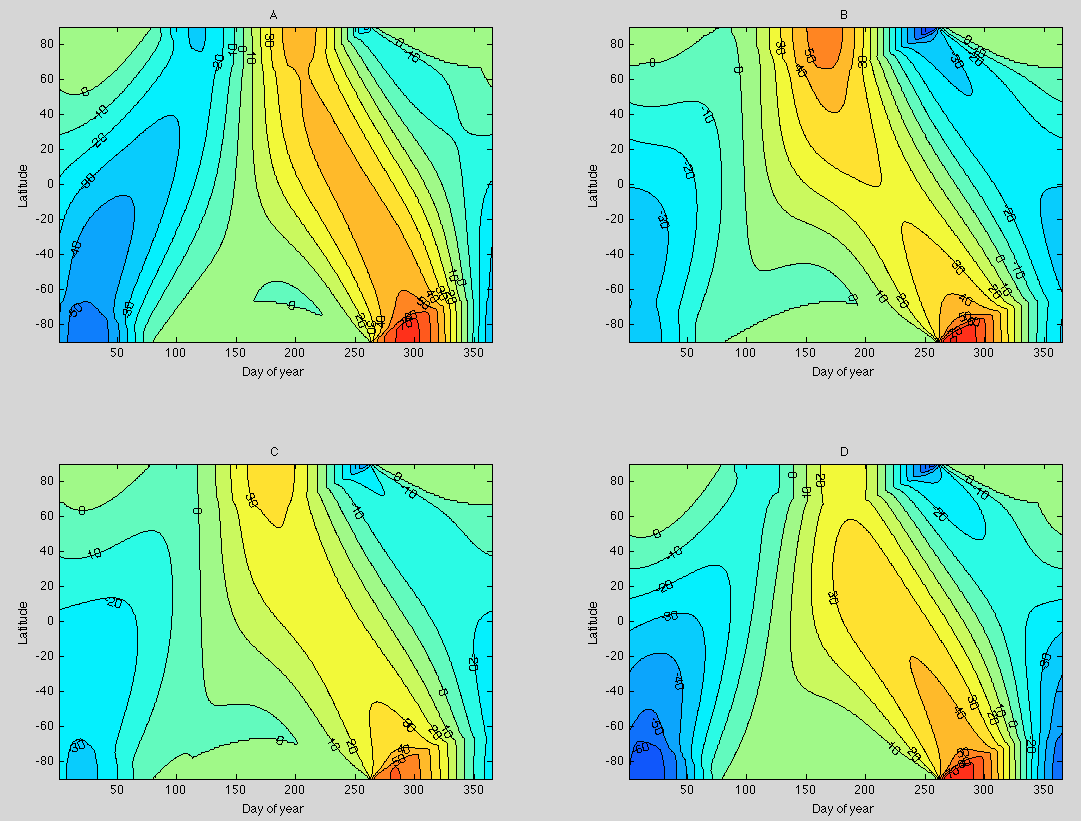
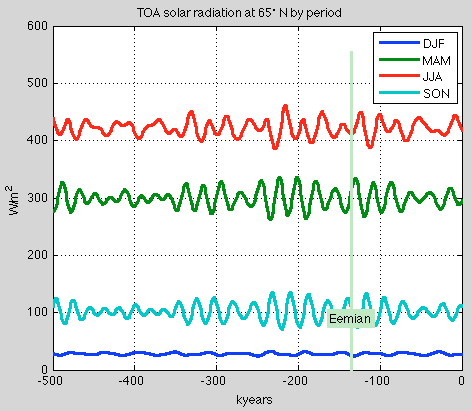
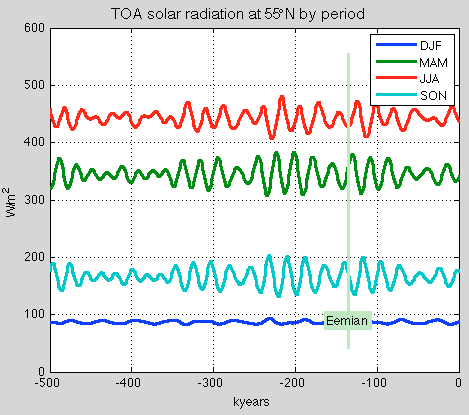
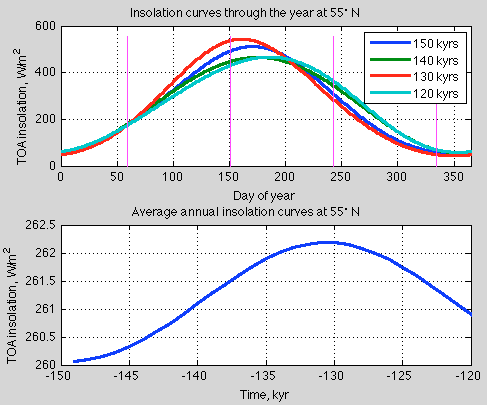
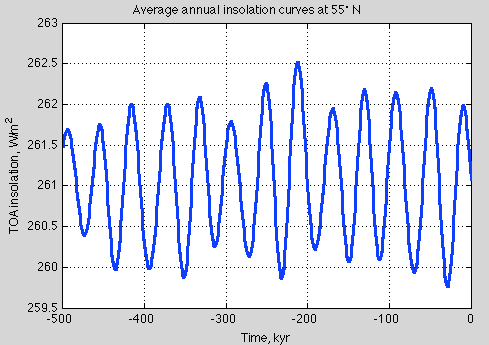
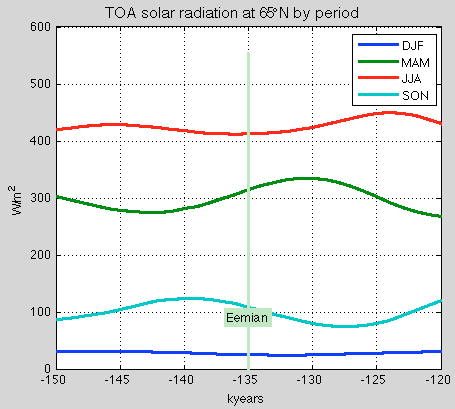
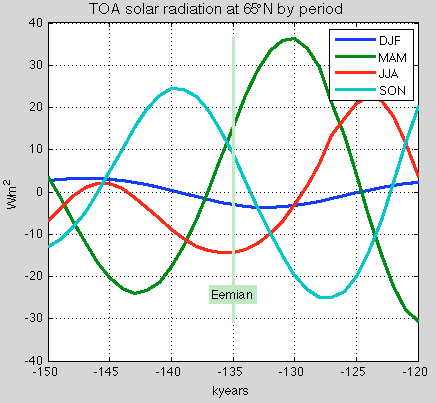
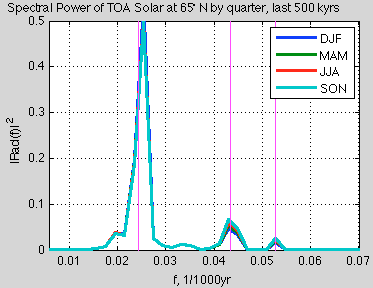
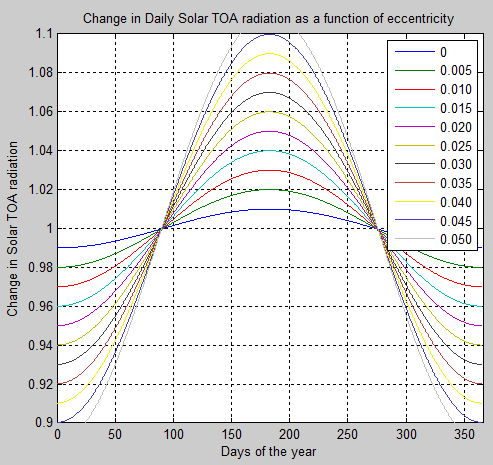
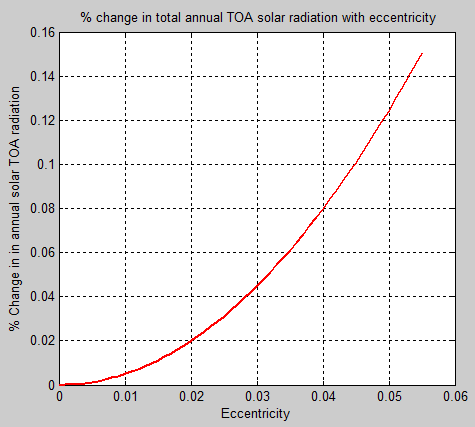
The obvious criticism of this hypothesis is that insolation (summer, 65ºN) has been a lot higher during earlier periods:

Figure 4
We saw this in Ghosts of Climates Past – Pop Quiz: End of An Ice Age.
And also earlier periods of significant temperature rises in the high northern latitudes have been recorded during the last glacial period. Why were none of these able to initiate this same sequence of events and initiate an Antarctic temperature rise?
At the time of the LGM, the ice sheets were at their furthest extent, with the consequent positive feedback of the higher albedo. If a small increase in summer insolation in high northern latitudes could initiate a deglaciation, surely the much higher summer insolation at 100 kyrs BP or 82 kyrs BP would have initiated a deglaciation given the additional benefit of the lower albedo at the time.
As I was completing this section of the article I went back to the Nature website to see if there was any supplemental information (Nature papers are short and online material that doesn’t appear in the pdf paper can be very useful).
There was a link to a News & Views article on this paper by Eric Wolff. Eric Wolff is one of the key EPICA contributors, a lead author and co-author of many EPICA papers, so I was quite encouraged to read his perspective on the paper.
Many people seem convinced the Milankovitch theory is without question and not accepting it is absurd, see for example the blog discussion I referred to earlier, so it’s worth quoting extensively from Wolff’s short article:
Between about 19,000 and 10,000 years ago, Earth emerged from the last glacial period. The whole globe warmed, ice sheets retreated from Northern Hemisphere continents and atmospheric composition changed significantly. Many theories try to explain what triggered and sustained this transformation (known as the glacial termination), but crucial evidence to validate them is lacking.
On page 49 of this issue, Shakun et al use a global reconstruction of temperature to show that the transition from the glacial period to the current interglacial consisted of an antiphased temperature response of Earth’s two hemispheres, superimposed on a globally coherent warming. Ocean-circulation changes, controlling the contrasting response in each hemisphere, seem to have been crucial to the glacial termination.
Once again, a key climate scientist notes that we don’t know why the last ice age ended. As we saw in Part Six – “Hypotheses Abound” – the title explains the content..
..Some studies have proposed that changes in ocean heat transport are an essential part of glacial termination. Shakun et al. combine their data with simulations based on an ocean–atmosphere general circulation model to present a plausible sequence of events from about 19,000 years ago onwards. They propose that a reduction in the AMOC (induced in the model by introducing fresh water into the North Atlantic) led to Southern Hemisphere warming, and a net cooling in the Northern Hemisphere. Carbon dioxide concentration began to rise soon afterwards, probably owing to degassing from the deep Southern Ocean; although quite well documented, the exact combination of mechanisms for this rise remains a subject of debate. Both hemispheres then warmed together, largely in response to the rise in carbon dioxide, but with further oscillations in the hemispheric contrast as the strength of the AMOC varied. The model reproduces well both the magnitude and the pattern of global and hemispheric change, with carbon dioxide and changing AMOC as crucial components.
The success of the model used by Shakun and colleagues in reproducing the data is encouraging. But one caveat is that the magnitude of fresh water injected into the Atlantic Ocean in the model was tuned to produce the inferred strength of the AMOC and the magnitude of interhemispheric climate response; the result does not imply that the ocean circulation in the model has the correct sensitivity to the volume of freshwater input.
Shakun and colleagues’ work does provide a firm data-driven basis for a plausible chain of events for most of the last termination. But what drove the reduction in the AMOC 19,000 years ago? The authors point out that there was a significant rise in temperature between 21,500 and 19,000 years ago in the northernmost latitude band (60–90° N). They propose that this may have resulted from a rise in summer insolation (incoming solar energy) at high northern latitudes, driven by well-known cycles in Earth’s orbit around the Sun. They argue that this rise could have caused an initial ice-sheet melt that drove the subsequent reduction in the AMOC.
However, this proposal needs to be treated with caution. First, there are few temperature records in this latitude band: the warming is seen clearly only in Greenland ice cores. Second, there is at least one comparable rise in temperature in the Greenland records, between about 62,000 and 60,000 years ago, which did not result in a termination. Finally, although it is true that northern summer insolation increased from 21,500 to 19,000 years ago, its absolute magnitude remained lower than at any time between 65,000 and 30,000 years ago. It is not clear why an increase in insolation from a low value initiated termination whereas a continuous period of higher insolation did not.
In short, another ingredient is needed to explain the link between insolation and termination, and the triggers for the series of events described so well in Shakun and colleagues’ paper. The see-saw of temperature between north and south throughout the glacial period, most clearly observed in rapid Greenland warmings (Dansgaard–Oeschger events), is often taken as a sign that numerous changes in AMOC strength occurred. However, the AMOC weakening that started 19,000 years ago lasted for much longer than previous ones, allowing a much more substantial rise in southern temperature and in carbon dioxide concentration. Why was it so hard, at that time, to reinvigorate the AMOC and end this weakening?
And what is the missing ingredient that turned the rise in northern insolation around 20,000 years ago into the starting gun for deglaciation, when higher insolation at earlier times failed to do so? It has been proposed that terminations occur only when northern ice-sheet extent is particularly large. If this is indeed the extra ingredient, then the next step in unwinding the causal chain must be to understand what aspect of a large ice sheet controls the onset and persistence of changes in the AMOC that seem to have been key to the last deglaciation.
[Emphasis added].
Thanks, Eric Wolff. My summary on Shakun et al, overall – on its main subject – it’s a very good paper with solid new data, good explanations and graphs.
However, this field is still in flux..
Parrenin et al 2013
Understanding the role of atmospheric CO2 during past climate changes requires clear knowledge of how it varies in time relative to temperature. Antarctic ice cores preserve highly resolved records of atmospheric CO2 and Antarctic temperature for the past 800,000 years.
Here we propose a revised relative age scale for the concentration of atmospheric CO2 and Antarctic temperature for the last deglacial warming, using data from five Antarctic ice cores. We infer the phasing between CO2 concentration and Antarctic temperature at four times when their trends change abruptly.
We find no significant asynchrony between them, indicating that Antarctic temperature did not begin to rise hundreds of years before the concentration of atmospheric CO2, as has been suggested by earlier studies.
[Emphasis added].
Ouch. In a later article we will delve into the complex world of dating ice cores and the air trapped in the ice cores.
WAIS Divide Project Members (2013)
The cause of warming in the Southern Hemisphere during the most recent deglaciation remains a matter of debate.
Hypotheses for a Northern Hemisphere trigger, through oceanic redistributions of heat, are based in part on the abrupt onset of warming seen in East Antarctic ice cores and dated to 18,000 years ago, which is several thousand years after high-latitude Northern Hemisphere summer insolation intensity began increasing from its minimum, approximately 24,000 years ago.
An alternative explanation is that local solar insolation changes cause the Southern Hemisphere to warm independently. Here we present results from a new, annually resolved ice-core record from West Antarctica that reconciles these two views. The records show that 18,000 years ago snow accumulation in West Antarctica began increasing, coincident with increasing carbon dioxide concentrations, warming in East Antarctica and cooling in the Northern Hemisphere associated with an abrupt decrease in Atlantic meridional overturning circulation. However, significant warming in West Antarctica began at least 2,000 years earlier.
Circum-Antarctic sea-ice decline, driven by increasing local insolation, is the likely cause of this warming. The marine-influenced West Antarctic records suggest a more active role for the Southern Ocean in the onset of deglaciation than is inferred from ice cores in the East Antarctic interior, which are largely isolated from sea-ice changes.
[Emphasis added].
We see that “rising solar insolation” in any part of the world from any value can be presented as a hypothesis for ice age termination. Here “local solar insolation” means the solar insolation in the Antarctic region, compare with Shakun et al, where rising insolation (from a very low value) in the high northern latitudes was presented as a hypothesis for northern warming which then initiated a southern warming.
That said, this is a very interesting paper with new data from Antarctica, the West Antarctic Ice Sheet (WAIS) Divide ice core (WDC), where drilling was completed in 2011:
Because the climate of West Antarctica is distinct from that of interior East Antarctica, the exclusion of West Antarctic records may result in an incomplete picture of past Antarctic and Southern Ocean climate change. Interior West Antarctica is lower in elevation and more subject to the influence of marine air masses than interior East Antarctica, which is surrounded by a steep topographic slope. Marine-influenced locations are important because they more directly reflect atmospheric conditions resulting from changes in ocean circulation and sea ice. However, ice-core records from coastal sites are often difficult to interpret because of complicated ice-flow and elevation histories.
The West Antarctic Ice Sheet (WAIS) Divide ice core (WDC), in central West Antarctica, is unique in coming from a location that has experienced minimal elevation change, is strongly influenced by marine conditions and has a relatively high snow-accumulation rate, making it possible to obtain an accurately dated record with high temporal resolution.
WDC paints a slightly different picture from other Antarctic ice cores:
..and significant warming at WDC began by 20 kyr ago, at least 2,000 yr before significant warming at EDML and EDC.
..Both the WDC and the lower-resolution Byrd ice-core records show that warming in West Antarctica began before the decrease in AMOC that has been invoked to explain Southern Hemisphere warming [the references include Shakun et al 2012]. The most significant early warming at WDC occurred between 20 and 18.8 kyr ago, although a period of significant warming also occurred between 22 and 21.5 kyr ago. The magnitude of the warming at WDC before 18 kyr ago is much greater than at EDML or EDC..

From WAIS Divide Project (2013)
Figure 5
We will look at this paper in more detail in a later article.
Conclusion
The termination of the last ice age is a fascinating topic that tests our ability to understand climate change.
One criticism made of climate science on many blogs is that climate scientists are obsessed with running GCMs, instead of doing “real science”, “running real experiments” and “gathering real data”. I can’t say where the balance really is, but in my own journey through climate science I find that there is a welcome and healthy obsession with gathering data, finding new sources of data, analyzing data, comparing datasets and running real experiments. The Greenland and Antarctic ice core projects, like NGRIP, EPICA and WAIS Divide Project are great examples.
On other climate blogs, writers and commenters seem very happy that climate scientists have written a paper that “supports the orbital hypothesis” without any critical examination of what the paper actually supports with evidence.
Returning to the question at hand, explaining the termination of the last ice age – the problem at the moment is less that there is no theory, and more that the wealth of data has not yet settled onto a clear chain of cause and effect. This is obviously essential to come up with a decent theory.
And any theory that explains the termination of the last ice age will need to explain why it didn’t happen earlier. Invoking “rising insolation” seems like lazy journalism to me. Luckily Eric Wolff, at least, agrees with me.
Articles in the Series
Part One – An introduction
Part Two – Lorenz – one point of view from the exceptional E.N. Lorenz
Part Three – Hays, Imbrie & Shackleton – how everyone got onto the Milankovitch theory
Part Four – Understanding Orbits, Seasons and Stuff – how the wobbles and movements of the earth’s orbit affect incoming solar radiation
Part Five – Obliquity & Precession Changes – and in a bit more detail
Part Six – “Hypotheses Abound” – lots of different theories that confusingly go by the same name
Part Seven – GCM I – early work with climate models to try and get “perennial snow cover” at high latitudes to start an ice age around 116,000 years ago
Part Seven and a Half – Mindmap – my mind map at that time, with many of the papers I have been reviewing and categorizing plus key extracts from those papers
Part Eight – GCM II – more recent work from the “noughties” – GCM results plus EMIC (earth models of intermediate complexity) again trying to produce perennial snow cover
Part Nine – GCM III – very recent work from 2012, a full GCM, with reduced spatial resolution and speeding up external forcings by a factors of 10, modeling the last 120 kyrs
Part Ten – GCM IV – very recent work from 2012, a high resolution GCM called CCSM4, producing glacial inception at 115 kyrs
Pop Quiz: End of An Ice Age – a chance for people to test their ideas about whether solar insolation is the factor that ended the last ice age
Twelve – GCM V – Ice Age Termination – very recent work from He et al 2013, using a high resolution GCM (CCSM3) to analyze the end of the last ice age and the complex link between Antarctic and Greenland
Thirteen – Terminator II – looking at the date of Termination II, the end of the penultimate ice age – and implications for the cause of Termination II
Fourteen – Concepts & HD Data – getting a conceptual feel for the impacts of obliquity and precession, and some ice age datasets in high resolution
Fifteen – Roe vs Huybers – reviewing In Defence of Milankovitch, by Gerard Roe
Sixteen – Roe vs Huybers II – remapping a deep ocean core dataset and updating the previous article
Seventeen – Proxies under Water I – explaining the isotopic proxies and what they actually measure
Eighteen – “Probably Nonlinearity” of Unknown Origin – what is believed and what is put forward as evidence for the theory that ice age terminations were caused by orbital changes
Nineteen – Ice Sheet Models I – looking at the state of ice sheet models
References
Global warming preceded by increasing carbon dioxide concentrations during the last deglaciation, Shakun, Clark, He, Marcott, Mix, Liu, Otto-Bliesner, Schmittner & Bard, Nature (2012) – free paper
Climate change: A tale of two hemispheres, Eric W. Wolff, Nature (2012)
Synchronous Change of Atmospheric CO2 and Antarctic Temperature During the Last Deglacial Warming, Parrenin, Masson-Delmotte, Köhler, Raynaud, Paillard, Schwander, Barbante, Landais, Wegner & Jouzel, Science (2013) – free paper, in submission form (rather than published form)
For interest Valérie Masson-Delmotte is one of the two co-ordinating lead authors for AR5 for the Paleoclimate section, Frédéric Parrenin is a contributing author.
Onset of deglacial warming in West Antarctica driven by local orbital forcing, WAIS Divide Project Members, Nature (2013) – free paper
Notes
Note 1 – see for example, CO2 – An Insignificant Trace Gas? – an 8-part series on CO2, Atmospheric Radiation and the “Greenhouse” Effect – a 12-part series on how radiation interacts with the atmosphere, Visualizing Atmospheric Radiation – a 13-part series to help us get a better grasp of how this works including “does water vapor overwhelm CO2″, “is CO2 saturated” and many other questions.