Feeds:
Posts
Comments

Archive for the ‘Feedback’ Category

A couple of recent articles covered ground related to clouds, but under Models –Models, On – and Off – the Catwalk – Part Seven – Resolution & Convection & Part Five – More on Tuning & the Magic Behind the Scenes. In the first article Andrew Dessler, day job climate scientist, made a few comments and in one comment provided some great recent references. One of these was by Paulo Ceppi and colleagues published this year and freely accessible. Another paper with some complementary explanations is from Mark Zelinka and colleagues, also published this year (but behind a paywall).

In this article we will take a look at the breakdown these papers provide. There is a lot to the Ceppi paper so we’re not going to review it all in this article, hopefully in a followup article.

Globally and annually averaged, clouds cool the planet by around 18W/m² – that’s large compared with the radiative effect of doubling CO2, a value of 3.7W/m². The net effect is made up of two larger opposite effects:

  • cooling from reflecting sunlight (albedo effect) of about 46W/m²
  • warming from the radiative effect of about 28W/m² – clouds absorb terrestrial radiation and reemit from near the top of the cloud where it is colder, this is like the “greenhouse” effect

In this graphic, Zelinka and colleagues show the geographical breakdown of cloud radiative effect averaged over 15 years from CERES measurements:

From Zelinka et al 2017

Figure 1 – Click to enlarge

Note that the cloud radiative effect shown above isn’t feedbacks from warming, it is simply the current effect of clouds. The big question is how this will change with warming.

In the next graphic, the inset in the top shows cloud feedback (note 1) vs ECS from 28 GCMs. ECS is the steady state temperature resulting from doubling CO2. Two models are picked out – red and blue – and in the main graph we see simulated warming under RCP8.5 (an unlikely future world confusing described by many as the “business as usual” scenario).

In the bottom graphic, cloud feedbacks from models are decomposed into the effect from low cloud amount, from changing high cloud altitude and from low cloud opacity. We see that the amount of low cloud is the biggest feedback with the widest spread, followed by the changing altitude of high clouds. And both of them have a positive feedback. The gray lines extending out cover the range of model responses.

From Zelinka et al 2017

Figure 2 – Click to enlarge

In the next figure – click to enlarge – they show the progression in each IPCC report, helpfully color coded around the breakdown above:

From Zelinka et al 2017

Figure 3 – Click to enlarge

On AR5:

Notably, the high cloud altitude feedback was deemed positive with high confidence due to supporting evidence from theory, observations, and high-resolution models. On the other hand, continuing low confidence was expressed in the sign of low cloud feedback because of a lack of strong observational constraints. However, the AR5 authors noted that high-resolution process models also tended to produce positive low cloud cover feedbacks. The cloud opacity feedback was deemed highly uncertain due to the poor representation of cloud phase and microphysics in models, limited observations with which to evaluate models, and lack of physical understanding. The authors noted that no robust mechanisms contribute a negative cloud feedback.

And on work since:

In the four years since AR5, evidence has increased that the overall cloud feedback is positive. This includes a number of high-resolution modelling studies of low cloud cover that have illuminated the competing processes that govern changes in low cloud coverage and thickness, and studies that constrain long-term cloud responses using observed short-term sensitivities of clouds to changes in their local environment. Both types of analyses point toward positive low cloud feedbacks. There is currently no evidence for strong negative cloud feedbacks..

Onto Ceppi et al 2017. In the graph below we see climate feedback from models broken out into a few parameters

  • WV+LR – the combination of water vapor and lapse rate changes (lapse rate is the temperature profile with altitude)
  • Albedo – e.g. melting sea ice
  • Cloud total
  • LW cloud – this is longwave effects, i.e., how clouds change terrestrial radiation emitted to space
  • SW cloud- this is shortwave effects, i.e., how clouds reflect solar radiation back to space

From Ceppi et al 2017

Figure 4 – Click to enlarge

Then they break down the cloud feedback further. This graph is well worth understanding. For example, in the second graph (b) we are looking at higher altitude clouds. We see that the increasing altitude of high clouds causes a positive feedback. The red dots are LW (longwave = terrestrial radiation). If high clouds increase in altitude the radiation from these clouds to space is lower because the cloud tops are colder. This is a positive feedback (more warming retained in the climate system). The blue dots are SW (shortwave = solar radiation). If high clouds increase in altitude it has no effect on the reflection of solar radiation – and so the blue dots are on zero.

Looking at the low clouds – bottom graph (c) – we see that the feedback is almost all from increasing reflection of solar radiation from increasing amounts of low clouds.

From Ceppi et al 2017

Figure 5 

Now a couple more graphs from Ceppi et al – the spatial distribution of cloud feedback from models (note this is different from our figure 1 which showed current cloud radiative effect):

From Ceppi et al 2017

Figure 6

And the cloud feedback by latitude broken down into: altitude effects; amount of cloud; and optical depth (higher optical depth primarily increases the reflection to space of solar radiation but also has an effect on terrestrial radiation).

From Ceppi et al 2017

Figure 7

They state:

The patterns of cloud amount and optical depth changes suggest the existence of distinct physical processes in different latitude ranges and climate regimes, as discussed in the next section. The results in Figure 4 allow us to further refine the conclusions drawn from Figure 2. In the multi- model mean, the cloud feedback in current GCMs mainly results from:

  • globally rising free-tropospheric clouds
  • decreasing low cloud amount at low to middle latitudes, and
  • increasing low cloud optical depth at middle to high latitudes

Cloud feedback is the main contributor to intermodel spread in climate sensitivity, ranging from near zero to strongly positive (−0.13 to 1.24 W/m²K) in current climate models.

It is a combination of three effects present in nearly all GCMs: rising free- tropospheric clouds (a LW heating effect); decreasing low cloud amount in tropics to midlatitudes (a SW heating effect); and increasing low cloud optical depth at high latitudes (a SW cooling effect). Low cloud amount in tropical subsidence regions dominates the intermodel spread in cloud feedback.

Happy Christmas to all Science of Doom readers.

Note – if anyone wants to debate the existence of the “greenhouse” effect, please add your comments to Two Basic Foundations or The “Greenhouse” Effect Explained in Simple Terms or any of the other tens of articles on that subject. Comments here on the existence of the “greenhouse” effect will be deleted.

References

Cloud feedback mechanisms and their representation in global climate models, Paulo Ceppi, Florent Brient, Mark D Zelinka & Dennis Hartmann, IREs Clim Change 2017 – free paper

Clearing clouds of uncertainty, Mark D Zelinka, David A Randall, Mark J Webb & Stephen A Klein, Nature 2017 – paywall paper

Notes

Note 1: From Ceppi et al 2017: CLOUD-RADIATIVE EFFECT AND CLOUD FEEDBACK:

The radiative impact of clouds is measured as the cloud-radiative effect (CRE), the difference between clear-sky and all-sky radiative flux at the top of atmosphere. Clouds reflect solar radiation (negative SW CRE, global-mean effect of −45W/m²) and reduce outgoing terrestrial radiation (positive LW CRE, 27W/m²−2), with an overall cooling effect estimated at −18W/m² (numbers from Henderson et al.).

CRE is proportional to cloud amount, but is also determined by cloud altitude and optical depth.

The magnitude of SW CRE increases with cloud optical depth, and to a much lesser extent with cloud altitude.

By contrast, the LW CRE depends primarily on cloud altitude, which determines the difference in emission temperature between clear and cloudy skies, but also increases with optical depth. As the cloud properties change with warming, so does their radiative effect. The resulting radiative flux response at the top of atmosphere, normalized by the global-mean surface temperature increase, is known as cloud feedback.

This is not strictly equal to the change in CRE with warming, because the CRE also responds to changes in clear-sky radiation—for example, due to changes in surface albedo or water vapor. The CRE response thus underestimates cloud feedback by about 0.3W/m² on average. Cloud feedback is therefore the component of CRE change that is due to changing cloud properties only. Various methods exist to diagnose cloud feedback from standard GCM output. The values presented in this paper are either based on CRE changes corrected for noncloud effects, or estimated directly from changes in cloud properties, for those GCMs providing appropriate cloud output. The most accurate procedure involves running the GCM radiation code offline—replacing instantaneous cloud fields from a control climatology with those from a perturbed climatology, while keeping other fields unchanged—to obtain the radiative perturbation due to changes in clouds. This method is computationally expensive and technically challenging, however.

Read Full Post »

I was re-reading Missing iris effect as a possible cause of muted hydrological change and high climate sensitivity in models, Thorsten Mauritsen and Bjorn Stevens from 2015 (because I referenced it in a recent comment) and then looked up other recent papers citing it. One interesting review paper is by Stevens et al from 2016. I recognized his name from many other papers and it looks like Bjorn Stevens has been publishing papers since the early 1990s, with almost 200 papers in peer-reviewed journals, mostly on this and related topics. Likewise, Sherwood and Bony (two of the coauthors) are very familiar names from this field.

Many regular readers (and I’m sure new readers of this blog) will understand much more than me about current controversies in climate sensitivity. The question in brief (of course there are many subtleties) – how much will the earth warm if we double CO2? It’s a very important question. As the authors explain at the start:

Nearly 40 years have passed since the U.S. National Academies issued the “Charney Report.” This landmark assessment popularized the concept of the “equilibrium climate sensitivity” (ECS), the increase of Earth’s globally and annually averaged near surface temperature that would follow a sustained doubling of atmospheric carbon dioxide relative to its preindustrial value. Through the application of physical reasoning applied to the analysis of output from a handful of relatively simple models of the climate system, Jule G. Charney and his co-authors estimated a range of 1.5 –4.5 K for the ECS [Charney et al., 1979].

Charney is a eminent name you will know, along with Lorentz, if you read about the people who broke ground on numerical weather modeling. The authors explain a little about the definition of ECS:

ECS is an idealized but central measure of climate change, which gives specificity to the more general idea of Earth’s radiative response to warming. This specificity makes ECS something that is easy to grasp, if not to realize. For instance, the high heat capacity and vast carbon stores of the deep ocean mean that a new climate equilibrium would only be fully attained a few millennia after an applied forcing [Held et al., 2010; Winton et al., 2010; Li et al., 2012]; and uncertainties in the carbon cycle make it difficult to know what level of emissions is compatible with a doubling of the atmospheric CO2 concentration in the first place.

Concepts such as the “transient climate response” or the “transient climate response to cumulative carbon emissions” have been introduced to account for these effects and may be a better index of the warming that will occur within a century or two [Allen and Frame, 2007; Knutti and Hegerl, 2008; Collins et al., 2013;MacDougall, 2016].

But the ECS is strongly related and conceptually simpler, so it endures as the central measure of Earth’s susceptibility to forcing [Flato et al., 2013].

And about the implications of narrowing the range of ECS:

The socioeconomic value of better understanding the ECS is well documented. If the ECS were well below 1.5 K, climate change would be a less serious problem. The stakes are much higher for the upper bound. If the ECS were above 4.5 K, immediate and severe reductions of greenhouse gas emissions would be imperative to avoid dangerous climate changes within a few human generations.

From a mitigation point of view, the difference between an ECS of 1.5 K and 4.5 K corresponds to about a factor of two in the allowable CO2 emissions for a given temperature target [Stocker et al., 2013] and it explains why the value of learning more about the ECS has been appraised so highly [Cooke et al., 2013; Neubersch et al., 2014].

The ECS also gains importance because it conditions many other impacts of greenhouse gases, such as regional temperature and rainfall [Bony et al., 2013; Tebaldi and Arblaster, 2014], and even extremes [Seneviratne et al., 2016], knowledge of which is required for developing effective adaptation strategies. Being an important and simple measure of climate change, the ECS is something that climate science should and must be able to better understand and quantify more precisely.

One of the questions they raise is at the heart of my question about whether climate sensitivity is a constant that we can measure, or a value that has some durable meaning rather than being dependent on the actual climate specifics at the time. For example, there are attempts to measure it via the climate response during an El Nino. We see the climate warm and we measure how the top of atmosphere radiation balance changes. We attempt to measure the difference in ocean temperature between end of the last ice age and today and deduce climate sensitivity. Perhaps I have a mental picture of non-linear systems that is preventing me from seeing the obvious. However, the picture I have in my head is that the dependence of the top of radiation balance on temperature is not a constant.

Here is their commentary. They use the term “pattern effect” for my mental model described above:

Hence, a generalization of the concept of climate sensitivity to different eras may need to account for differences that arise from the different base state of the climate system, increasingly so for large perturbations.

Even for small perturbations, there is mounting evidence that the outward radiation may be sensitive to the geographic pattern of surface temperature changes. Senior and Mitchell [2000] argued that if warming is greater over land, or at high latitudes, different feedbacks may occur than for the case where the same amount of warming is instead concentrated over tropical oceans.

These effects appear to be present in a range of models [Armour et al., 2013; Andrews et al., 2015]. Physically they can be understood because clouds—and their impact on radiation—are sensitive to changes in the atmospheric circulation, which responds to geographic differences in warming [Kang et al., 2013], or simply because an evolving pattern of surface warming weights local responses differently at different times [Armour et al., 2013].

Hence different patterns of warming, occurring on different timescales, may be associated with stronger or weaker radiative responses. This introduces an additional state dependence, one that is not encapsulated by the global mean temperature. We call this a “pattern effect.” Pattern effects are thought to be important for interpreting changes over the instrumental period [Gregory and Andrews, 2016], and may contribute to the state dependence of generalized measures of Earth’s climate sensitivity as inferred from the geological record.

Some of my thoughts are that the insoluble questions on this specific topic are also tied into the question about the climate being chaotic vs just weather being chaotic – see for example, Natural Variability and Chaos – Four – The Thirty Year Myth. In that article we look at the convention of defining climate as the average of 30 years of weather and why that “eliminates” chaos, or doesn’t. Non-linear systems have lots of intractable problems – more on that topic in the whole series Natural Variability and Chaos. It’s good to see it being mentioned in this paper.

Read the whole paper – it reviews the conditions necessary for very low climate sensitivity and for very high climate sensitivity, with the idea being that if one necessary condition can be ruled out then the very low and/or very high climate sensitivity can be ruled out. The paper also includes some excellent references for further insights.

From Stevens et al 2016

Click to enlarge

Happy Thanksgiving to our US readers.

References

Missing iris effect as a possible cause of muted hydrological change and high climate sensitivity in models, Thorsten Mauritsen & Bjorn Stevens, Nature Geoscience (2015) – paywall paper

Prospects for narrowing bounds on Earth’s equilibrium climate sensitivity, Bjorn Stevens, Steven C Sherwood, Sandrine Bony & Mark J Webb, Earth’s
Future (2016) – free paper

Read Full Post »

In Part Nine – Data I – Ts vs OLR we looked at the monthly surface temperature (“skin temperature”) from NCAR vs OLR measured by CERES. The slope of the data was about 2 W/m² per 1K surface temperature change. Commentators pointed out that this was really the seasonal relationship – it probably didn’t indicate anything further.

In Part Ten we looked at anomaly data: first where monthly means were removed; and then where daily means were removed. Mostly the data appeared to be a big noisy scatter plot with no slope. The main reason that I could see for this lack of relationship was that anomaly data didn’t “keep going” in one direction for more than a few days. So it’s perhaps unreasonable to expect that we would find any relationship, given that most circulation changes take time.

We haven’t yet looked at regional versions of Ts vs OLR, the main reason is I can’t yet see what we can usefully plot. A large amount of heat is exported from the tropics to the poles and so without being able to itemize the amount of heat lost from a tropical region or the amount of heat gained by a mid-latitude or polar region, what could we deduce? One solution is to look at the whole globe in totality – which is what we have done.

In this article we’ll look at the mean global annual data. We only have CERES data for complete years from 2001 to 2013 (data wasn’t available to end of the 2014 when I downloaded it).

Here are the time-series plots for surface temperature and OLR:

Global annual Ts vs year & OLR  vs year 2001-2013

Figure 1

Here is the scatter plot of the above data, along with the best-fit linear interpolation:

Global annual Ts vs OLR 2001-2013

Figure 2

The calculated slope is similar to the results we obtained from the monthly data (which probably showed the seasonal relationship). This is definitely the year to year data, but also gives us a slope that indicates positive feedback. The correlation is not strong, as indicated by the R² value of 0.37, but it exists.

As explained in previous posts, a change of 3.6 W/m² per 1K is a “no feedback” relationship, where a uniform 1K change in surface & atmospheric temperature causes an OLR increase of 3.6 W/m² due to increased surface and atmospheric radiation – a greater increase in OLR would be negative feedback and a smaller increase would be positive feedback (e.g. see Part Eight with the plot of OLR changes vs latitude and height, which integrated globally gives 3.6 W/m²).

The problem of the”no feedback” calculation is perhaps a bit more complicated and I want to dig into this calculation at some stage.

I haven’t looked at whether the result is sensitive to the date of the start of year. Next, I want to look at the changes in humidity, especially upper tropospheric water vapor, which is a key area for radiative changes. This will be a bit of work, because AIRS data comes in big files (there is a lot of data).

Read Full Post »

[I was going to post this new article not long after the last article in the series, but felt I was missing something important and needed to think about it. Instead I’ve not had any new insights and am posting for comment.]

In Part Nine – Data I, we looked at the relationship between Ts (surface temperature) and OLR (outgoing longwave radiation), for reasons all explained there.

The relationship shown there appears to be primarily the seasonal relationship, which looks like a positive feedback due to the 2W/m² per 1K temperature increase. What about the feedback on a different timescale from the seasonal relationship?

From the 2001-2013 data, here is the monthly mean and the daily mean for both Ts and OLR:

Monthly mean & daily mean for Ts & OLR

Figure 1

If we remove the monthly mean from the data, here are those same relationships (shown in the last article as anomalies from the overall 2001-2013 mean):

OLR vs Ts - NCAR -CERES-monthlymeansremoved

Figure 2 – Click to Expand

On a lag of 1 day there is a possible relationship with a low correlation – and the rest of the lags show no relationship at all.

Of course, we have created a problem with this new dataset – as the lag increases we are “jumping boundaries”. For example, on the 7-day lag all of the Ts data in the last week of April is being compared with the OLR data in the first week of May. With slowly rising temperatures, the last week of April will be “positive temperature data”, but the first week of May will be “negative OLR data”. So we expect 1/4 of our data to show the opposite relationship.

So we can show the data with the “monthly boundary jumps removed” – which means we can only show lags of say 1-14 days (with 3% – 50% of the data cut out); and we can also show the data as anomalies from the daily mean. Both have the potential to demonstrate the feedback on shorter timescales than the seasonal cycle.

First, here is the data with daily means removed:

OLR vs Ts - NCAR -CERES-dailymeansremoved

Figure 3 – Click to Expand

Second, here is the data with the monthly means removed as in figure 2, but this time ensuring that no monthly boundaries are crossed (so some of the data is removed to ensure this):

OLR vs Ts - NCAR -CERES-monthlymeansremoved-noboundary

Figure 4 – Click to Expand

So basically this demonstrates no correlation between change in daily global OLR and change in daily global temperature on less than seasonal timescales. (Or “operator error” with the creation of my anomaly data). This is excluding (because we haven’t tested it here) the very short timescale of day to night change.

This was surprising at first sight.

That is, we see global Ts increasing on a given day but we can’t distinguish any corresponding change in global OLR from random changes, at least until we get to seasonal time periods? (See graph in last article).

Then what is probably the reason came into view. Remember that this is anomaly data (daily global temperature with monthly mean subtracted). This bar graph demonstrates that when we are looking at anomaly data, most of the changes in global Ts are reversed the next day, or usually within a few days:

Days temperature goes in same direction

Figure 5

This means that we are unlikely to see changes in Ts causing noticeable changes in OLR unless the climate response we are looking for (humidity and cloud changes) occurs within a day or two.

That’s my preliminary thinking, looking at the data – i.e., we can’t expect to see much of a relationship, and we don’t see any relationship.

One further point – explained in much more detail in the (short) series Measuring Climate Sensitivity – is that of course changes in temperature are not caused by some mechanism that is independent of radiative forcing.

That is, our measurement problem is compounded by changes in temperature being first caused by fluctuations in radiative forcing (the radiation balance) and ocean heat changes and then we are measuring the “resulting” change in the radiation balance resulting from this temperature change:

Radiation balance & ocean heat balance => Temperature change => Radiation balance & ocean heat balance

So we can’t easily distinguish the net radiation change caused by temperature changes from the radiative contribution to the original temperature changes.

I look forward to readers’ comments.

Articles in the Series

Part One – introducing some ideas from Ramanathan from ERBE 1985 – 1989 results

Part One – Responses – answering some questions about Part One

Part Two – some introductory ideas about water vapor including measurements

Part Three – effects of water vapor at different heights (non-linearity issues), problems of the 3d motion of air in the water vapor problem and some calculations over a few decades

Part Four – discussion and results of a paper by Dessler et al using the latest AIRS and CERES data to calculate current atmospheric and water vapor feedback vs height and surface temperature

Part Five – Back of the envelope calcs from Pierrehumbert – focusing on a 1995 paper by Pierrehumbert to show some basics about circulation within the tropics and how the drier subsiding regions of the circulation contribute to cooling the tropics

Part Six – Nonlinearity and Dry Atmospheres – demonstrating that different distributions of water vapor yet with the same mean can result in different radiation to space, and how this is important for drier regions like the sub-tropics

Part Seven – Upper Tropospheric Models & Measurement – recent measurements from AIRS showing upper tropospheric water vapor increases with surface temperature

Part Eight – Clear Sky Comparison of Models with ERBE and CERES – a paper from Chung et al (2010) showing clear sky OLR vs temperature vs models for a number of cases

Part Nine – Data I – Ts vs OLR – data from CERES on OLR compared with surface temperature from NCAR – and what we determine

Part Ten – Data II – Ts vs OLR – more on the data

Read Full Post »

In the last article we looked at a paper which tried to unravel – for clear sky only – how the OLR (outgoing longwave radiation) changed with surface temperature. It did the comparison by region, by season and from year to year.

The key point for new readers to understand – why are we interested in how OLR changes with surface temperature? The concept is not so difficult. The practical analysis presents more problems.

Let’s review the concept – and for more background please read at least the start of the last article: if we increase the surface temperature, perhaps due to increases in GHGs, but it could be due to any reason, what happens to outgoing longwave radiation? Obviously, we expect OLR to increase. The real question is how by how much?

If there is no feedback then OLR should increase by about 3.6 W/m² for every 1K in surface temperature (these values are global averages):

  • If there is positive feedback, perhaps due to more humidity, then we expect OLR to increase by less than 3.6 W/m² – think “not enough heat got out to get things back to normal”
  • If there is negative feedback, then we expect OLR to increase by more than 3.6 W/m². In the paper we reviewed in the last article the authors found about 2 W/m² per 1K increase – a positive feedback, but were only considering clear sky areas

One reader asked about an outlier point on the regression slope and whether it affected the result. This motivated me to do something I have had on my list for a while now – get “all of the data” and analyse it. This way, we can review it and answer questions ourselves – like in the Visualizing Atmospheric Radiation series where we created an atmospheric radiation model (first principles physics) and used the detailed line by line absorption data from the HITRAN database to calculate how this change and that change affected the surface downward radiation (“back radiation”) and the top of atmosphere OLR.

With the raw surface temperature, OLR and humidity data “in hand” we can ask whatever questions we like and answer these questions ourselves..

NCAR reanalysis, CERES and AIRS

CERES and AIRS – satellite instruments – are explained in CERES, AIRS, Outgoing Longwave Radiation & El Nino.

CERES measures total OLR in a 1ºx 1º grid on a daily basis.

AIRS has a “hyper-spectral” instrument, which means it looks at lots of frequency channels. The intensity of radiation at these many wavelengths can be converted, via calculation, into measurements of atmospheric temperature at different heights, water vapor concentration at different heights, CO2 concentration, and concentration of various other GHGs. Additionally, AIRS calculates total OLR (it doesn’t measure it – i.e. it doesn’t have a measurement device from 4μm – 100μm). It also measures parameters like “skin temperature” in some locations and calculates the same in other locations.

For the purposes of this article, I haven’t yet dug into the “how” and the reliability of surface AIRS measurements. The main point to note about satellites is they sit at the “top of atmosphere” and their ability to measure stuff near the surface depends on clever ideas and is often subverted by factors including clouds and surface emissivity. (AIRS has microwave instruments specifically to independently measure surface temperature even in cloudy conditions, because of this problem).

NCAR is a “reanalysis product”. It is not measurement, but it is “informed by measurement”. It is part measurement, part model. Where there is reliable data measurement over a good portion of the globe the reanalysis is usually pretty reliable – only being suspect at the times when new measurement systems come on line (so trends/comparisons over long time periods are problematic). Where there is little reliable measurement the reanalysis depends on the model (using other parameters to allow calculation of the missing parameters).

Some more explanation in Water Vapor Trends under the sub-heading Reanalysis – or Filling in the Blanks.

For surface temperature measurements reanalysis is not subverted by models too much. However, the mainstream surface temperature series are surely better than NCAR – I know that there is an army of “climate interested people” who follow this subject very closely. (I am not in that group).

I used NCAR because it is simple to download and extract. And I expect – but haven’t yet verified – that it will be quite close to the various mainstream surface temperature series. If someone is interested and can provide daily global temperature from another surface temperature series as an Excel, csv, .nc – or pretty much any data format – we can run the same analysis.

For those interested, see note 1 on accessing the data.

Results – Global Averages

For our starting point in this article I decided to look at global averages from 2001 to 2013 inclusive (data from CERES not yet available for the whole of 2014). This was after:

  • looking at daily AIRS data
  • creating and comparing NCAR over 8 days with AIRS 8-day averages for surface skin temperature and surface air temperature
  • creating and comparing AIRS over 8-days with CERES for TOA OLR

More on those points in later articles.

The global relationship with surface temperature and OLR is what we have a primary interest in – for the purpose of determining feedbacks. Then we want to figure out some detail about why it occurs. I am especially interested in the AIRS data because it is the only global measurement of upper tropospheric water vapor (UTWV) – and UTWV along with clouds are the key factors in the question of feedback – how OLR changes with surface temperature. For now, we will look at the simple relationship between surface temperature (“skin temperature”) and OLR.

Here is the data, shown as an anomaly from the global mean values over the period Jan 1st, 2001 to Dec 31st, 2013. Each graph represents a different lag – how does global OLR (CERES) change with global surface temperature (NCAR) on a lag of 1 day, 7 days, 14 days and so on:

OLR vs Ts - NCAR -CERES

Figure 1 – Click to Expand

The slope gives the “apparent feedback” and the R² simply reflects how much of the graph is explained by the linear trend. This last value is easily estimated just by looking at each graph.

For reference, here is the timeseries data, as anomalies, with the temperature anomaly multiplied by a factor of 3 so its magnitude is similar to the OLR anomaly:

OLR from CERES vs Ts from NCAR as timeseries

Figure 2 – Click to Expand

Note on the calculation – I used the daily data to calculate a global mean value (area-weighted) and calculated one mean value over the whole time period then subtracted it from every daily data value to obtain an anomaly for each day. Obviously we would get the same slope and R² without using anomaly data (just a different intercept on the axes).

For reference, mean OLR = 238.9 W/m², mean Ts = 288.0 K.

My first question – before even producing the graphs – was whether a lag graph shows the change in OLR due to a change in Ts or due to a mixture of many effects. That is, what is the interpretation of the graphs?

The second question – what is the “right lag” to use? We don’t expect an instant response when we are looking for feedbacks:

  • The OLR through the window region will of course respond instantly to surface temperature change
  • The OLR as a result of changing humidity will depend upon how long it takes for more evaporated surface water to move into the mid- to upper-troposphere
  • The OLR as a result of changing atmospheric temperature, in turn caused by changing surface temperature, will depend upon the mixture of convection and radiative cooling

To say we know the right answer in advance pre-supposes that we fully understand atmospheric dynamics. This is the question we are asking, so we can’t pre-suppose anything. But at least we can suggest that something in the realm of a few days to a few months is the most likely candidate for a reasonable lag.

But the idea that there is one constant feedback and one constant lag is an idea that might well be fatally flawed, despite being seductively simple. (A little more on that in note 3).

And that is one of the problems of this topic. Non-linear dynamics means non-linear results – a subject I find hard to describe in simple words. But let’s say – changes in OLR from changes in surface temperature might be “spread over” multiple time scales and be different at different times. (I have half-written an article trying to explain this idea in words, hopefully more on that sometime soon).

But for the purpose of this article I only wanted to present the simple results – for discussion and for more analysis to follow in subsequent articles.

Articles in the Series

Part One – introducing some ideas from Ramanathan from ERBE 1985 – 1989 results

Part One – Responses – answering some questions about Part One

Part Two – some introductory ideas about water vapor including measurements

Part Three – effects of water vapor at different heights (non-linearity issues), problems of the 3d motion of air in the water vapor problem and some calculations over a few decades

Part Four – discussion and results of a paper by Dessler et al using the latest AIRS and CERES data to calculate current atmospheric and water vapor feedback vs height and surface temperature

Part Five – Back of the envelope calcs from Pierrehumbert – focusing on a 1995 paper by Pierrehumbert to show some basics about circulation within the tropics and how the drier subsiding regions of the circulation contribute to cooling the tropics

Part Six – Nonlinearity and Dry Atmospheres – demonstrating that different distributions of water vapor yet with the same mean can result in different radiation to space, and how this is important for drier regions like the sub-tropics

Part Seven – Upper Tropospheric Models & Measurement – recent measurements from AIRS showing upper tropospheric water vapor increases with surface temperature

Part Eight – Clear Sky Comparison of Models with ERBE and CERES – a paper from Chung et al (2010) showing clear sky OLR vs temperature vs models for a number of cases

Part Nine – Data I – Ts vs OLR – data from CERES on OLR compared with surface temperature from NCAR – and what we determine

Part Ten – Data II – Ts vs OLR – more on the data

References

Wielicki, B. A., B. R. Barkstrom, E. F. Harrison, R. B. Lee III, G. L. Smith, and J. E. Cooper, 1996: Clouds and the Earth’s Radiant Energy System (CERES): An Earth Observing System Experiment, Bull. Amer. Meteor. Soc., 77, 853-868   – free paper

Kalnay et al.,The NCEP/NCAR 40-year reanalysis project, Bull. Amer. Meteor. Soc., 77, 437-470, 1996  – free paper

NCEP Reanalysis data provided by the NOAA/OAR/ESRL PSD, Boulder, Colorado, USA, from their Web site at http://www.esrl.noaa.gov/psd/

Notes

Note 1: Boring Detail about Extracting Data

On the plus side, unlike many science journals, the data is freely available. Credit to the organizations that manage this data for their efforts in this regard, which includes visualization software and various ways of extracting data from their sites. However, you can still expect to spend a lot of time figuring out what files you want, where they are, downloading them, and then extracting the data from them. (Many traps for the unwary).

NCAR – data in .nc files, each parameter as a daily value (or 4x daily) in a separate annual .nc file on an (approx) 2.5º x 2.5º grid (actually T62 gaussian grid).

Data via ftp – ftp.cdc.noaa.gov. See http://www.esrl.noaa.gov/psd/data/gridded/data.ncep.reanalysis.surface.html.

You get lat, long, and time in the file as well as the parameter. Care needed to navigate to the right folder because the filenames are the same for the 4x daily and the daily data.

NCAR are using latest version .nc files (which Matlab circa 2010 would not open, I had to update to the latest version – many hours wasted trying to work out the reason for failure).

CERES – data in .nc files, you select the data you want and the time period but it has to be a less than 2G file and you get a file to download. I downloaded daily OLR data for each annual period. Data in a 1ºx 1º grid. CERES are using older version .nc so there should be no problem opening.

Data from http://ceres-tool.larc.nasa.gov/ord-tool/srbavg

AIRS – data in .hdf files, in daily, 8-day average, or monthly average. The data is “ascending” = daytime, “descending” = nighttime plus some other products. Daily data doesn’t give global coverage (some gaps). 8-day average does but there are some missing values due to quality issues. Data in a 1ºx 1º grid. I used v6 data.

Data access page – http://disc.sci.gsfc.nasa.gov/datacollection/AIRX3STD_V006.html?AIRX3STD&#tabs-1.

Data via ftp.

HDF is not trivial to open up. The AIRS team have helpfully provided a Matlab tool to extract data which helped me. I think I still spent many hours figuring out how to extract what I needed.

Files Sizes – it’s a lot of data:

NCAR files that I downloaded (skin temperature) are only 12MB per annual file.

CERES files with only 2 parameters are 190MB per annual file.

AIRS files as 8-day averages (or daily data) are 400MB per file.

Also the grid for each is different. Lat from S-pole to N-pole in CERES, the reverse for AIRS and NCAR. Long from 0.5º to 359.5º in CERES but -179.5 to 179.5 in AIRS. (Note for any Matlab people, it won’t regrid, say using interp2, unless the grid runs from lowest number to highest number).

Note 2: Checking data – because I plan on using the daily 1ºx1º grid data from CERES and NCAR, I used it to create the daily global averages. As a check I downloaded the global monthly averages from CERES and compared. There is a discrepancy, which averages at 0.1 W/m².

Here is the difference by month:

CERES-Monthly-discrepancy-by-month

Figure 3 – Click to expand

And a scatter plot by month of year, showing some systematic bias:

CERES-Monthly-discrepance-scatter-plot

Figure 4

As yet, I haven’t dug any deeper to find if this is documented – for example, is there a correction applied to the daily data product in monthly means? is there an issue with the daily data? or, more likely, have I %&^ed up somewhere?

Note 3: Extract from Measuring Climate Sensitivity – Part One:

Linear Feedback Relationship?

One of the biggest problems with the idea of climate sensitivity, λ, is the idea that it exists as a constant value.

From Cloud Feedbacks in the Climate System: A Critical Review, Stephens, Journal of Climate (2005):

The relationship between global-mean radiative forcing and global-mean climate response (temperature) is of intrinsic interest in its own right. A number of recent studies, for example, discuss some of the broad limitations of (1) and describe procedures for using it to estimate Q from GCM experiments (Hansen et al. 1997; Joshi et al. 2003; Gregory et al. 2004) and even procedures for estimating from observations (Gregory et al. 2002).

While we cannot necessarily dismiss the value of (1) and related interpretation out of hand, the global response, as will become apparent in section 9, is the accumulated result of complex regional responses that appear to be controlled by more local-scale processes that vary in space and time.

If we are to assume gross time–space averages to represent the effects of these processes, then the assumptions inherent to (1) certainly require a much more careful level of justification than has been given. At this time it is unclear as to the specific value of a global-mean sensitivity as a measure of feedback other than providing a compact and convenient measure of model-to-model differences to a fixed climate forcing (e.g., Fig. 1).

[Emphasis added and where the reference to “(1)” is to the linear relationship between global temperature and global radiation].

If, for example, λ is actually a function of location, season & phase of ENSO.. then clearly measuring overall climate response is a more difficult challenge.

Read Full Post »

In Part Seven we had a look at a 2008 paper by Gettelman & Fu which assessed models vs measurements for water vapor in the upper troposphere.

In this article we will look at a 2010 paper by Chung, Yeomans & Soden. This paper studies outgoing longwave radiation (OLR) vs temperature change, for clear skies only, in three ways (and comparing models and measurements):

  • by region
  • by season
  • year to year

Why is this important and what is the approach all about?

Let’s suppose that the surface temperature increases for some reason. What happens to the total annual radiation emitted by the climate system? We expect it to increase. The hotter objects are the more they radiate.

If there is no positive feedback in the climate system then for a uniform global 1K (=1ºC) increase in surface & atmospheric temperature we expect the OLR to increase by 3.6 W/m². This is often called, by convention only, the “Planck feedback”. It refers to the fact that an increased surface temperature, and increased atmospheric temperature, will radiate more – and the “no feedback value” is 3.6 W/m² per 1K rise in temperature.

To explain a little further for newcomers.. with the concept of “no positive feedback” an initial 1K surface temperature rise – from any given cause – will stay at 1K. But if there is positive feedback in the climate system, an initial 1K surface temperature rise will result in a final temperature higher than 1K.

If the OLR increases by less than 3.6 W/m² the final temperature will end up higher than 1K – positive feedback. If the OLR increases by more than 3.6 W/m² the final temperature will end up lower than 1K – negative feedback.

Base Case

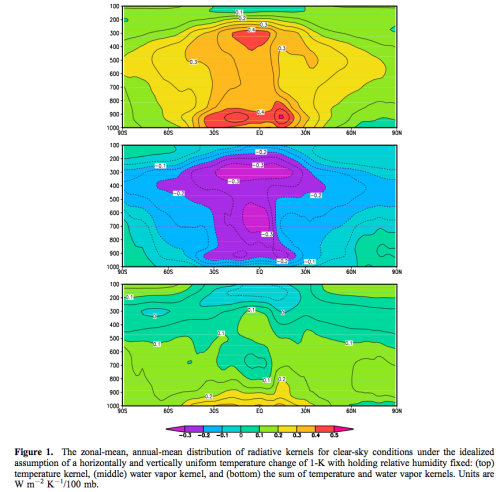
At the start of their paper they show the calculated clear-sky OLR change as the result of an ideal case. This is the change in OLR as a result of the surface and atmosphere increasing uniformly by 1K:

  • first, from the temperature change alone
  • second, from the change in water vapor as a result of this temperature change, assuming relative humidity stays constant
  • finally, from the first and second combined
From Chung et al (2010)

From Chung et al (2010)

Figure 1 – Click to expand

The graphs show the breakdown by pressure (=height) and latitude. 1000mbar is the surface and 200mbar is approximately the tropopause, the place where convection stops.

The sum of the first graph (note 1) is the “no feedback” response and equals 3.6 W/m². The sum of the second graph is the “feedback from water vapor” and equals -1.6 W/m². The combined result in the third graph equals 2.0 W/m². The second and third graphs are the result if relative humidity is constant.

We can also see that the tropics is where most of the changes take place.

They say:

One striking feature of the fixed-RH kernel is the small values in the tropical upper troposphere, where the positive OLR response to a temperature increase is offset by negative responses to the corresponding vapor increase. Thus under a constant RH- warming scenario, the tropical upper troposphere is in a runaway greenhouse state – the stabilizing effect of atmospheric warming is neutralized by the increased absorption from water vapor. Of course, the tropical upper troposphere is not isolated but is closely tied to the lower tropical troposphere where the combined temperature-water vapor responses are safely stabilizing.

To understand the first part of their statement, if temperatures increase and overall OLR does not increase at all then there is nothing to stop temperatures increasing. Of course, in practice, the “close to zero” increase in OLR for the tropical upper troposphere under a temperature rise can’t lead to any kind of runaway temperature increase. This is because there is a relationship between the temperatures in the upper troposphere and the lower- & mid- troposphere.

Relative Humidity Stays Constant?

Back in 1967, Manabe & Wetherald published their seminal paper which showed the result of increases in CO2 under two cases – with absolute humidity constant and with relative humidity constant:

Generally speaking, the sensitivity of the surface equilibrium temperature upon the change of various factors such as solar constant, cloudiness, surface albedo, and CO2 content are almost twice as much for the atmosphere with a given distribution of relative humidity as for that with a given distribution of absolute humidity..

..Doubling the existing CO2 content of the atmosphere has the effect of increasing the surface temperature by about 2.3ºC for the atmosphere with the realistic distribution of relative humidity and by about 1.3ºC for that with the realistic distribution of absolute humidity.

They explain important thinking about this topic:

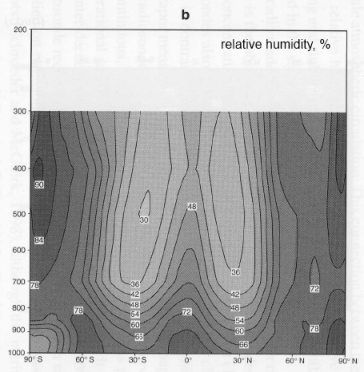
Figure 1 shows the distribution of relative humidity as a function of latitude and height for summer and winter. According to this figure, the zonal mean distributions of relative humidity closely resemble one another, whereas those of absolute humidity do not. These data suggest that, given sufficient time, the atmosphere tends to restore a certain climatological distribution of relative humidity responding to the change of temperature.

It doesn’t mean that anyone should assume that relative humidity stays constant under a warmer world. It’s just likely to be a more realistic starting point than assuming that absolute humidity stays constant.

I only point this out for readers to understand that this idea is something that has seemed reasonable for almost 50 years. Of course, we have to question this “reasonable” assumption. How relative humidity changes as the climate warms or cools is a key factor in determining the water feedback and, therefore, it has had a lot of attention.

Results From the Paper

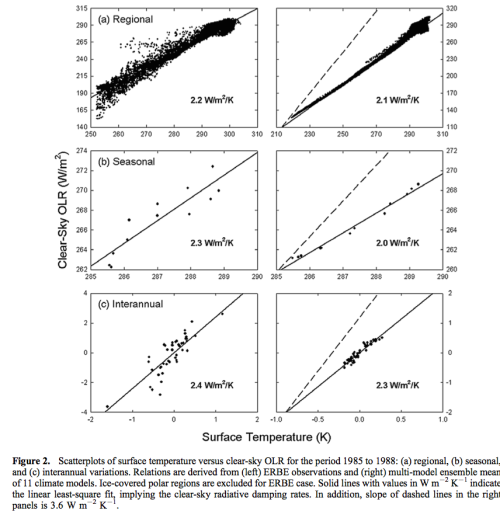
The observed rates of radiative damping from regional, seasonal, and interannual variations are substantially smaller than the rate of Planck radiative damping (3.6W/m²), yet slightly larger than that anticipated from a uniform warming, constant-RH response (2.0 W/m²).

The three comparison regressions can be seen, with ERBE data on the left and model results on the right:

From Chung et al (2010)

From Chung et al (2010)

Figure 2 – Click to expand

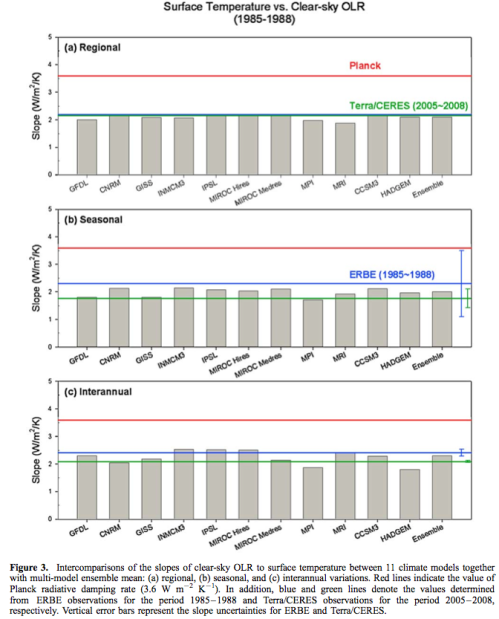
In the next figure, the differences between the models can be seen, and compared with ERBE and CERES results. The red “Planck” line is the no-feedback line, showing that (for these sets of results) models and experimental data show a positive feedback (when looking at clear sky OLR).

From Chung et al (2010)

From Chung et al (2010)

Figure 3 – Click to expand

Conclusion

At the least, we can see that climate models and measured values are quite close, when the results are aggregated. Both the model and the measured results are a long way from neutral feedback (the dashed slope in figure 2 and the red line in figure 3), instead they show positive feedback, quite close to what we would expect from constant relative humidity. The results indicate that relative humidity declines a little in the warmer case. The results also indicate that the models calculate a little more positive feedback than the real world measurements under these cases.

What does this mean for feedback from warming from increased GHGs? It’s the important question. We could say that the results tell us nothing, because how the world warms from increasing CO2 (and other GHGs) will change climate patterns and so seasonal, regional and year to year changes in periods from 1985-1988 and 2005-2008 are not particularly useful.

We could say that the results tell us that water vapor feedback is demonstrated to be a positive feedback, and matches quite closely the results of models. Or we could say that without cloudy sky data the results aren’t very interesting.

At the very least we can see that for current climate conditions under clear skies the change in OLR as temperature changes indicates an overall positive feedback, quite close to constant relative humidity results and quite close to what models calculate.

The ERBE results include the effect of a large El Nino and I do question whether year to year changes (graph c in figs 2 & 3) under El Nino to La Nino changes can be considered to represent how the climate might warm with more CO2. If we consider how the weather patterns shift during El-Nino to La Nina it has long been clear that there are positive feedbacks, but also the weather patterns end up back to normal (the cycle ends). I welcome knowledgeable readers explaining why El Nino feedback patters are relevant to future climate shifts, perhaps this will help me to clarify my thinking, or correct my misconceptions.

However, the CERES results from 2005-2008 don’t include the effect of a large El Nino and they show an overall slightly more positive feedback.

I asked Brian Soden a few question about this paper and he was kind enough to respond:

Q. Given the much better quality data since CERES and AIRS, why is ERBE data the focus?
A. At the time, the ERBE data was the only measurement that covered a large ENSO cycle (87/88 El Nino event followed by 88/89 La Nina)

Q. Why not include cloudy skies as well in this review? Collecting surface temperature data is more challenging of course because it needs a different data source. Is there a comparable study that you know of for cloudy skies?
A. The response of clouds to surface temperature changes is more complicated. We wanted to start with something relatively simple; i.e., water vapor. Andrew Dessler at Texas AM has a paper that came out a few years back that looks at total-sky fluxes and thus includes the effects on clouds.

Q. Do you know of any studies which have done similar work with what must now be over 10 years of CERES/AIRS.
A. Not off-hand. But it would be useful to do.

Articles in the Series

Part One – introducing some ideas from Ramanathan from ERBE 1985 – 1989 results

Part One – Responses – answering some questions about Part One

Part Two – some introductory ideas about water vapor including measurements

Part Three – effects of water vapor at different heights (non-linearity issues), problems of the 3d motion of air in the water vapor problem and some calculations over a few decades

Part Four – discussion and results of a paper by Dessler et al using the latest AIRS and CERES data to calculate current atmospheric and water vapor feedback vs height and surface temperature

Part Five – Back of the envelope calcs from Pierrehumbert – focusing on a 1995 paper by Pierrehumbert to show some basics about circulation within the tropics and how the drier subsiding regions of the circulation contribute to cooling the tropics

Part Six – Nonlinearity and Dry Atmospheres – demonstrating that different distributions of water vapor yet with the same mean can result in different radiation to space, and how this is important for drier regions like the sub-tropics

Part Seven – Upper Tropospheric Models & Measurement – recent measurements from AIRS showing upper tropospheric water vapor increases with surface temperature

Part Eight – Clear Sky Comparison of Models with ERBE and CERES – a paper from Chung et al (2010) showing clear sky OLR vs temperature vs models for a number of cases

Part Nine – Data I – Ts vs OLR – data from CERES on OLR compared with surface temperature from NCAR – and what we determine

Part Ten – Data II – Ts vs OLR – more on the data

References

An assessment of climate feedback processes using satellite observations of clear-sky OLR, Eui-Seok Chung, David Yeomans, & Brian J. Soden, GRL (2010) – free paper

Thermal equilibrium of the atmosphere with a given distribution of relative humidity, Manabe & Wetherald, Journal of the Atmospheric Sciences (1967) – free paper

Notes

Note 1: The values are per 100 mbar “slice” of the atmosphere. So if we want to calculate the total change we need to sum the values in each vertical slice, and of course, because they vary through latitude we need to average the values (area-weighted) across all latitudes.

Read Full Post »

In Wonderland, Radiative Forcing and the Rate of Inflation we looked at the definition of radiative forcing and a few concepts around it:

  • why the instantaneous forcing is different from the adjusted forcing
  • what adjusted forcing is and why it’s a more useful concept
  • why the definition of the tropopause affects the value
  • GCM results usually don’t use radiative forcing as an input

In this article we will look at some results using the Wonderland model.

Remember the Wonderland model is not the earth. But the same is also true of “real” GCMs with geographical boundaries that match the earth as we know it. They are not the earth either. All models have limitations. This is easy to understand in principle. It is challenging to understand in the specifics of where the limitations are, even for specialists – and especially for non-specialists.

What the Wonderland model provides is a coarse geography with earth-like layout of land and ocean, plus of course, physics that follows the basic equations. And using this model we can get a sense of how radiative forcing is related to temperature changes when the same value of radiative forcing is applied via different mechanisms.

In the 1997 paper I think that Hansen, Sato & Ruedy did a decent job of explaining the limitations of radiative forcing, at least as far as the Wonderland climate model is able to assist us with that understanding. Remember as well that, in general, results we see from GCMs do not use radiative forcing. Instead they calculate from first principles – or parameterized first principles.

Doubling CO2

Now there’s a lot in this first figure, it can be a bit overwhelming. We’ll take it one step at a time. We double CO2 overnight – in Wonderland – and we see various results. The left half of the figure is all about flux while the right half is all about temperature:

From Hansen et al 1997

From Hansen et al 1997

Figure 1 – Green text added – Click to Expand

On the top line, the first two graphs are the net flux change, as a function of height and latitude. First left – instantaneous; second left – adjusted. These two cases were explained in the last article.

The second left is effectively the “radiative forcing”, and we can see that the above the tropopause (at about 200 mbar) the net flux change with height is constant. This is because the stratosphere has come into radiative balance. Refer to the last article for more explanation. On the right hand side, with all feedbacks from this one change in Wonderland, we can see the famous predicted “tropospheric hot spot” and the cooling of the stratosphere.

We see in the bottom two rows on the right the expected temperature change :

  • second row – change in temperature as a function of latitude and season (where temperature is averaged across all longitudes)
  • third row – change in temperature as a function of latitude and longitude (averaged annually)

It’s interesting to see the larger temperature increases predicted near the poles. I’m not sure I really understand the mechanisms driving that. Note that the radiative forcing is generally higher in the tropics and lower at the poles, yet the temperature change is the other way round.

Increasing Solar Radiation by 2%

Now let’s take a look at a comparison exercise, increasing solar radiation by 2%.

The responses to these comparable global forcings, 2xCO2 & +2% S0, are similar in a gross sense, as found by previous investigators. However, as we show in the sections below, the similarity of the responses is partly accidental, a cancellation of two contrary effects. We show in section 5 that the climate model (and presumably the real world) is much more sensitive to a forcing at high latitudes than to a forcing at low latitudes; this tends to cause a greater response for 2xCO2 (compare figures 4c & 4g); but the forcing is also more sensitive to a forcing that acts at the surface and lower troposphere than to a forcing which acts higher in the troposphere; this favors the solar forcing (compare figures 4a & 4e), partially offsetting the latitudinal sensitivity.

We saw figure 4 in the previous article, repeated again here for reference:

From Hansen et al (1997)

From Hansen et al (1997)

Figure 2

In case the above comment is not clear, absorbed solar radiation is more concentrated in the tropics and a minimum at the poles, whereas CO2 is evenly distributed (a “well-mixed greenhouse gas”). So a similar average radiative change will cause a more tropical effect for solar but a more even effect for CO2.

We can see that clearly in the comparable graphic for a solar increase of 2%:

From Hansen et al (1997)

From Hansen et al (1997)

Figure 3 – Green text added – Click to Expand

We see that the change in net flux is higher at the surface than the 2xCO2 case, and is much more concentrated in the tropics.

We also see the predicted tropospheric hot spot looking pretty similar to the 2xCO2 tropospheric hot spot (see note 1).

But unlike the cooler stratosphere of the 2xCO2 case, we see an unchanging stratosphere for this increase in solar irradiation.

These same points can also be seen in figure 2 above (figure 4 from Hansen et al).

Here is the table which compares radiative forcing (instantaneous and adjusted), no feedback temperature change, and full-GCM calculated temperature change for doubling CO2, increasing solar by 2% and reducing solar by 2%:

From Hansen et al 1997

From Hansen et al 1997

Figure 4 – Green text added – Click to Expand

The value R (far right of table) is the ratio of the predicted temperature change from a given forcing divided by the predicted temperature change from the 2% increase in solar radiation.

Now the paper also includes some ozone changes which are pretty interesting, but won’t be discussed here (unless we have questions from people who have read the paper of course).

“Ghost” Forcings

The authors then go on to consider what they call ghost forcings:

How does the climate response depend on the time and place at which a forcing is applied? The forcings considered above all have complex spatial and temporal variations. For example, the change of solar irradiance varies with time of day, season, latitude, and even longitude because of zonal variations in ground albedo and cloud cover. We would like a simpler test forcing.

We define a “ghost” forcing as an arbitrary heating added to the radiative source term in the energy equation.. The forcing, in effect, appears magically from outer space at an atmospheric level, latitude range, season and time of day. Usually we choose a ghost forcing with a global and annual mean of 4 W/m², making it comparable to the 2xCO2 and +2% S0 experiments.

In the following table we see the results of various experiments:

Hansen et al (1997)

Hansen et al (1997)

Figure 5 – Click to Expand

We note that the feedback factor for the ghost forcing varies with the altitude of the forcing by about a factor of two. We also note that a substantial surface temperature response is obtained even when the forcing is located entirely within the stratosphere. Analysis of these results requires that we first quantify the effect of cloud changes. However, the results can be understood qualitatively as follows.

Consider ΔTs in the case of fixed clouds. As the forcing is added to successively higher layers, there are two principal competing effects. First, as the heating moves higher, a larger fraction of the energy is radiated directly to space without warming the surface, causing ΔTs to decline as the altitude of the forcing increases. However, second, warming of a given level allows more water vapor to exist there, and at the higher levels water vapor is a particularly effective greenhouse gas. The net result is that ΔTs tends to decline with the altitude of the forcing, but it has a relative maximum near the tropopause.

When clouds are free to change the surface temperature change depends even more on the altitude of the forcing (figure 8). The principal mechanism is that heating of a given layer tends to decrease large-scale cloud cover within that layer. The dominant effect of decreased low-level clouds is a reduced planetary albedo, thus a warming, while the dominant effect of decreased high clouds is a reduced greenhouse effect, thus a cooling. However, the cloud cover, the cloud cover changes and the surface temperature sensitivity to changes may depend on characteristics of the forcing other than altitude, e.g. latitude, so quantitive evaluation requires detailed examination of the cloud changes (section 6).
Conclusion

Radiative forcing is a useful concept which gives a headline idea about the imbalance in climate equilibrium caused by something like a change in “greenhouse” gas concentration.

GCM calculations of temperature change over a few centuries do vary significantly with the exact nature of the forcing – primarily its vertical and geographical distribution. This means that a calculated radiative forcing of, say, 1 W/m² from two different mechanisms (e.g. ozone and CFCs) would (according to GCMs) not necessarily produce the same surface temperature change.

References

Radiative forcing and climate response, Hansen, Sato & Ruedy, Journal of Geophysical Research (1997) – free paper

Notes

Note 1: The reason for the predicted hot spot is more water vapor causes a lower lapse rate – which increases the temperature higher up in the troposphere relative to the surface. This change is concentrated in the tropics because the tropics are hotter and, therefore, have much more water vapor. The dry polar regions cannot get a lapse rate change from more water vapor because the effect is so small.

Any increase in surface temperature is predicted to cause this same change.

With limited research on my part, the idealized picture of the hotspot as shown above is not actually the real model results. The top graph is the “just CO2” graph, and the bottom graph is the “CO2 + aerosols” – the second graph is obviously closer to the real case:

From Santer et al 1996

From Santer et al 1996

Many people have asked for my comment on the hot spot, but apart from putting forward an opinion I haven’t spent enough time researching this topic to understand it. From time to time I do dig in, but it seems that there are about 20 papers that need to be read to say something useful on the topic. Unfortunately many of them are heavy in stats and my interest wanes.

Read Full Post »

In an earlier article on water vapor we saw that changing water vapor in the upper troposphere has a disproportionate effect on outgoing longwave radiation (OLR). Here is one example from Spencer & Braswell 1997:

Spencer and Braswell (1997)

From Spencer & Braswell (1997)

Figure 1

The upper troposphere is very dry, and so the mass of water vapor we need to change OLR by a given W/m² is small by comparison with the mass of water vapor we need to effect the same change in or near the boundary layer (i.e., near to the earth’s surface). See also Visualizing Atmospheric Radiation – Part Four – Water Vapor.

This means that when we are interested in climate feedback and how water vapor concentration changes with surface temperature changes, we are primarily interested in the changes in upper tropospheric water vapor (UTWV).

Upper Tropospheric Water Vapor

A major problem with analyzing UTWV is that most historic measurements are poor for this region. The upper troposphere is very cold and very dry – two issues that cause significant problems for radiosondes.

The atmospheric infrared sounder (AIRS) was launched in 2002 on the Aqua satellite and this instrument is able to measure temperature and water vapor with vertical resolution similar to that obtained from radiosondes. At the same time, because it is on a satellite we get the global coverage that is not available with radiosondes and the ability to measure the very cold, very dry upper tropospheric atmosphere.

Gettelman & Fu (2008) focused on the tropics and analysed the relationship (covariance) between surface temperature and UTWV from AIRS over 2002-2007, and then compared this with the results of the CAM climate model using prescribed (actual) surface temperature from 2001-2004 (note 1):

This study will build upon previous estimates of the water vapor feedback, by focusing on the observed response of upper-tropospheric temperature and humidity (specific and relative humidity) to changes in surface temperatures, particularly ocean temperatures. Similar efforts have been performed before (see below), but this study will use new high vertical resolution satellite measurements and compare them to an atmospheric general circulation model (GCM) at similar resolution.

The water vapor feedback arises largely from the tropics where there is a nearly moist adiabatic profile. If the profile stays moist adiabatic in response to surface temperature changes, and if the relative humidity (RH) is unchanged because of the supply of moisture from the oceans and deep convection to the upper troposphere, then the upper-tropospheric specific humidity will increase.

[Emphasis added]

They describe the objective:

The goal of this work is a better understanding of specific feedback processes using better statistics and vertical resolution than has been possible before. We will compare satellite data over a short (4.5 yr) time record to a climate model at similar space and time resolution and examine the robustness of results with several model simulations. The hypothesis we seek to test is whether water vapor in the model responds to changes in surface temperatures in a manner similar to the observations. This can be viewed as a necessary but not sufficient condition for the model to reproduce the upper-tropospheric water vapor feedback caused by external forcings such as anthropogenic greenhouse gas emissions.

[Emphasis added].

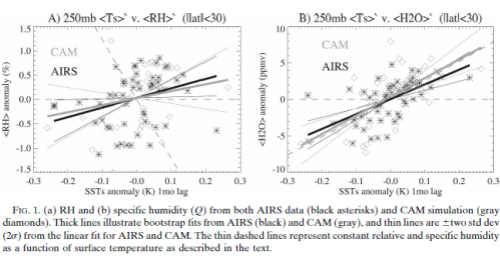
The results are for relative humidity (RH) on the left and absolute humidity on the right:

From Gettelman & Fu (2008)

From Gettelman & Fu (2008)

Figure 2

The graphs show that change in 250 mbar RH with temperature is statistically indistinguishable from zero. For those not familiar with the basics, if RH stays constant with rising temperature it is the same as increasing “specific humidity” – which means an increased mixing ratio of water vapor in the atmosphere. And we see this is the right hand graph.

Figure 1a has considerable scatter, but in general, there is little significant change of 250-hPa relative humidity anomalies with anomalies in the previous month’s surface temperature. The slope is not significantly different than zero in either AIRS observations (1.9 ± 1.9% RH/°C) or CAM (1.4 ± 2.8% RH/°C).

The situation for specific humidity in Fig. 1b indicates less scatter, and is a more fundamental measurement from AIRS (which retrieves specific humidity and temperature separately). In Fig. 1b, it is clear that 250- hPa specific humidity increases with increasing averaged surface temperature in both AIRS observations and CAM simulations. At 250 hPa this slope is 20 ± 8 ppmv/°C for AIRS and 26 ± 11 ppmv/°C for CAM. This is nearly 20% of background specific humidity per degree Celsius at 250 hPa.

The observations and simulations indicate that specific humidity increases with surface temperatures (Fig. 1b). The increase is nearly identical to that required to maintain constant relative humidity (the sloping dashed line in Fig. 1b) for changes in upper-tropospheric temperature. There is some uncertainty in this constant RH line, since it depends on calculations of saturation vapor mixing ratio that are nonlinear, and the temperature used is a layer (200–250 hPa) average.

The graphs below show the change in each variable as surface temperature is altered as a function of pressure (height). The black line is the measurement (AIRS).

So the right side graph shows that, from AIRS data of 4 years, specific humidity increases with surface temperature in the upper troposphere:

From Gettelman & Fu (2008)

From Gettelman & Fu (2008)

Figure 3 – Click to Enlarge

There are a number of model runs using CAM with different constraints. This is a common theme in climate science – researchers attempting to find out what part of the physics (at least as far as the climate model can reproduce it) contributes the most or least to a given effect. The paper has no paywall, so readers are recommended to review the whole paper.

Conclusion

The question of how water vapor responds to increasing surface temperature is a critical one in climate research. The fundamentals are discussed in earlier articles, especially Clouds and Water Vapor – Part Two – and much better explained in the freely available paper Water Vapor Feedback and Global Warming, Held and Soden (2000).

One of the key points is that the response of water vapor in the planetary boundary layer (the bottom layer of the atmosphere) is a lot easier to understand than the response in the “free troposphere”. But how water vapor changes in the free troposphere is the important question. And the water vapor concentration in the free troposphere is dependent on the global circulation, making it dependent on the massive complexity of atmospheric dynamics.

Gettelman and Fu attempt to answer this question for the first half decade’s worth of quality satellite observation and they find a result that is similar to that produced by GCMs.

Many people outside of climate science believe that GCMs have “positive feedback” or “constant relative humidity” programmed in. Delving into a climate model is a technical task, but the details are freely available – e.g., Description of the NCAR Community Atmosphere Model (CAM 3.0), W.D. Collins (2004). It’s clear to me that relative humidity is not prescribed in climate models – both from the equations used and from the results that are produced in many papers. And people like the great Isaac Held, a veteran of climate modeling and atmospheric dynamics, also state the same. So, readers who believe otherwise – come forward with evidence.

Still, that’s a different story from acknowledging that climate models attempt to calculate humidity from some kind of physics but believing that these climate models get it wrong. That is of course very possible.

At least from this paper we can see that over this short time period, not subject to strong ENSO fluctuations or significant climate change, the satellite date shows upper tropospheric humidity increasing with surface temperature. And the CAM model produces similar results.

Articles in this Series

Articles in the Series

Part One – introducing some ideas from Ramanathan from ERBE 1985 – 1989 results

Part One – Responses – answering some questions about Part One

Part Two – some introductory ideas about water vapor including measurements

Part Three – effects of water vapor at different heights (non-linearity issues), problems of the 3d motion of air in the water vapor problem and some calculations over a few decades

Part Four – discussion and results of a paper by Dessler et al using the latest AIRS and CERES data to calculate current atmospheric and water vapor feedback vs height and surface temperature

Part Five – Back of the envelope calcs from Pierrehumbert – focusing on a 1995 paper by Pierrehumbert to show some basics about circulation within the tropics and how the drier subsiding regions of the circulation contribute to cooling the tropics

Part Six – Nonlinearity and Dry Atmospheres – demonstrating that different distributions of water vapor yet with the same mean can result in different radiation to space, and how this is important for drier regions like the sub-tropics

Part Seven – Upper Tropospheric Models & Measurement – recent measurements from AIRS showing upper tropospheric water vapor increases with surface temperature

Part Eight – Clear Sky Comparison of Models with ERBE and CERES – a paper from Chung et al (2010) showing clear sky OLR vs temperature vs models for a number of cases

Part Nine – Data I – Ts vs OLR – data from CERES on OLR compared with surface temperature from NCAR – and what we determine

Part Ten – Data II – Ts vs OLR – more on the data

References

Observed and Simulated Upper-Tropospheric Water Vapor Feedback, Gettelman & Fu, Journal of Climate (2008) – free paper

How Dry is the Tropical Free Troposphere? Implications for Global Warming Theory, Spencer & Braswell, Bulletin of the American Meteorological Society (1997) – free paper

Notes

Note 1 – The authors note: “..Model SSTs may be slightly different from the data, but represent a partially overlapping period..”

I asked Andrew Gettelman why the model was run for a different time period than the observations and he said that the data (in the form needed for running CAM) was not available at that time.

Read Full Post »

Once we start measuring climate parameters we get a lot of data. To compare datasets, or datasets with models, we can look at means, standard deviations, medians, percentiles, and so on.

I’ve frequently mentioned the problem that climate is nonlinear. If we investigate the underlying physics of most processes we find that the answer to the problem does not scale linearly as inputs change.

Roca et al (2012) say:

The main reason for water vapor to be of importance to the energetics of the climate lies in the nonlinearity of the radiative transfer to the humidity. The outgoing longwave radiation (OLR) is indeed much more sensitive to a given perturbation in a dry rather than moist environment, conferring a central role of the moisture distribution in these regions to the radiation budget of the planet and to the overall climate sensitivity.

The authors demonstrate that with the same mean value of water vapor in a dry climate we can get different values of radiation to space for different distributions. (Note that FTH = free tropospheric humidity. This is the humidity above the atmospheric boundary layer – the boundary layer ranges from between a few hundred meters and one km):

Energy constraints on planet Earth (i.e. applying the first law of thermodynamics) require that, at equilibrium, the Earth emits in the long wave as much radiation as its gets from the Sun. This budget approach is hence focused on the mean values of the OLR over the whole planet and over long time scales corresponding to the global radiative-convective equilibrium theory.

While the mean OLR is the constrained parameter, owing to the nonlinearity of the clear-sky radiative transfer to water vapour (Figs. 2a, 3), the whole distribution of moisture has to be considered rather than its mean in order to link the distribution of humidity to that of radiation.

To illustrate this, the OLR sensitivity to FTH curve (Fig. 2a) and four distributions of FTH for a dry case are considered (Fig. 2bc):  a constant distribution with mean of 14.5%, an uniform distribution with mean of 14.5% bounded within plus or minus 5%, a Gaussian distribution with mean of 14.5% (and a 5% standard deviation) and a generalized log-normal distribution with a mean of 14.5% shown in Fig. 2c. The mean OLR corresponding to the constant distribution is 311 W/m². The uniform and normal distribution yield to a mean OLR larger by 0.7 W/m² in both cases.

The log-normal PDF, on the other hand, gives a 3 W/m² overestimation of the OLR with respect to the constant case. At the scale of the doubling of CO2 problem, such a systematic bias could be significant depending on its geographical spread, which is explored next.

PDF is the probability density function.

And in case it’s not clear what the authors were saying, the same average humidity can result in significantly different OLR depending on the distribution of the humidity from which the average was calculated.

Roca-2012

Figure 1

We saw the importance of the drier subsiding regions of the tropics in Clouds & Water Vapor – Part Five – Back of the envelope calcs from Pierrehumbert in that they have much higher OLR than the convective regions.

This paper calculates the results (using the vertical profile of temperature as a multi-year summer average of Bay of Bengal conditions from ERA-40) that with a constant boundary layer humidity (BLH), increasing FTH from 1% to 15% reduces OLR by 23 W/m². Increasing FTH from 35% to 50% reduces OLR by only 8 W/m². The spectral composition of these changes is interesting:

Roca-2012-brightness-temp-vs-wavelength

Figure 2

The authors comment that the changes in surface temperature (in the 2nd graph) result in a smaller change in OLR, which seems to be indicated from the brightness temperature graph. I have asked Remy Roca if he has the OLR calculations for this second graph to hand.

Then a statistical test is applied to values of humidity at 500 hPa (about 5.5 km altitude):

Roca-2012-fig4

Figure 3

We see that the moist areas are more likely to have a normal (gaussian) distribution, while the dry areas are less likely.

Here is an actual distribution from Ryoo et al (2008), for different regions from 250 hPa (about 11km) for both tropical (red) and sub-tropical regions (blue):

Ryoo-2008

Figure 4

The authors use the frequency of occurrence of relative humidity less than 10% as a measure:

The need of handling the whole PDF of humidity instead of only the mean of the field implies the manipulation of the upper moments of the distribution (skewness and kurtosis). While the computations are straightforward, the comparison of two PDFs through the comparison of their 4 moments is not. Assuming a generalized log-normal distribution also requires 4 parameters to be fitted. It can be brought down to 2 parameters by imposing the lower and upper range limit of the distribution (0 and 100% for instance) at the cost of limiting the possible distributions.

The simplified model (Ryoo et al. 2009) also comprises only two parameters, linked to the first two moments of the distribution. Still, the moments-to-moments comparison of PDFs remains difficult.

Here, it is proposed to limit the analysis to a single parameter characterizing the PDF with emphasis on the dry foot of the distribution: the frequency of occurrence of RH below 10%, noted in the following as RHp10.

The paper then provides some graphs of the frequency of RH below 10%. We can think of it as another way of looking at the same data, but focusing on the drier end of the dataset:

From Roca et al 2012

From Roca et al 2012

Figure 5

From Roca et al 2012

From Roca et al 2012

Figure 6

The authors then consider the source of the driest air at 500hPa. Now this uses what is called the advection-condensation method, something I hope to cover in a later article on water vapor. But for interest, here is their result:

From Roca et al 2012

From Roca et al 2012

Figure 7

The middle graph is the first graph with air sourced from the extra-tropics excluded.

The RHp10 distribution of the reconstructed field for the boreal summer 2003 is compared to the RHp10 distribution obtained by keeping only the air masses that experienced last saturation within the intertropical belt (35S–35N) in Fig. 9. Excluding the extra-tropical last saturated air masses overall moistens the atmosphere. The domain averaged RHp10 decreases from 37 to 23% without the extra-tropical influence. While the patterns overall remain similar within the two computations, the driest areas nevertheless appear more impacted and less spread in the tropics only case (Fig. 9 middle). The very dry features in the subtropical south Atlantic is mainly built from tropical originating air with the fraction of extra-tropical influence less than 10% (Fig. 9c).

Conclusion

Even if a monthly mean value of a climatological value from a model matches the measurement monthly mean it doesn’t necessarily mean that the consequences for the climate are the same.

Small changes in the distribution of values (for the same average) can have significant impacts. Here we see that this is the case for dry regions.

In Clouds & Water Vapor – Part Five – Back of the envelope calcs from Pierrehumbert we saw that these dry regions have a big role in cooling the tropics and therefore in regulating the temperature of the planet. Understanding more about the distribution of humidity and the mechanisms and causes is essential for progress in climate science.

Articles in the Series

Part One – introducing some ideas from Ramanathan from ERBE 1985 – 1989 results

Part One – Responses – answering some questions about Part One

Part Two – some introductory ideas about water vapor including measurements

Part Three – effects of water vapor at different heights (non-linearity issues), problems of the 3d motion of air in the water vapor problem and some calculations over a few decades

Part Four – discussion and results of a paper by Dessler et al using the latest AIRS and CERES data to calculate current atmospheric and water vapor feedback vs height and surface temperature

Part Five – Back of the envelope calcs from Pierrehumbert – focusing on a 1995 paper by Pierrehumbert to show some basics about circulation within the tropics and how the drier subsiding regions of the circulation contribute to cooling the tropics

Part Six – Nonlinearity and Dry Atmospheres – demonstrating that different distributions of water vapor yet with the same mean can result in different radiation to space, and how this is important for drier regions like the sub-tropics

Part Seven – Upper Tropospheric Models & Measurement – recent measurements from AIRS showing upper tropospheric water vapor increases with surface temperature

Part Eight – Clear Sky Comparison of Models with ERBE and CERES – a paper from Chung et al (2010) showing clear sky OLR vs temperature vs models for a number of cases

Part Nine – Data I – Ts vs OLR – data from CERES on OLR compared with surface temperature from NCAR – and what we determine

Part Ten – Data II – Ts vs OLR – more on the data

References

Tropical and Extra-Tropical Influences on the Distribution of Free Tropospheric Humidity over the Intertropical Belt, Roca et al, Surveys in Geophysics (2012) – paywall paper

Variability of subtropical upper tropospheric humidity, Ryoo, Waugh & Gettelman, Atmospheric Chemistry and Physics Discussions (2008) – free paper

Read Full Post »

In Atmospheric Circulation – Part One we saw the Hadley circulation: convection in the tropics and subsidence in the subtropics:

From Marshall & Plumb (2008)

Figure 1

The distribution of relative humidity in the atmosphere is a result of this circulation.

The sun heats the tropical ocean surface which both warms the air just above it and also evaporates water into this air. This hot moist air rises. As this air rises it cools, due to adiabatic expansion (see Potential Temperature), and water vapor condenses out, releasing the latent heat stored. The strongest examples are known as deep convection because the convected air rises all the way to the tropopause (the top of the troposphere).

Cold air can hold much less water vapor than hot air – for example, air at 30°C can hold seven times as much water vapor as air at 0°C. Air at the warmest ocean surface can hold about 1,000 times (in g/kg) more water vapor than the coldest point in the atmosphere (the tropical tropopause).

So by the time convected air reaches the very cold tropopause (top of the troposphere) it has become very dry.

Once at the tropopause it slowly subsides, and warms due to compression by the atmosphere [updated sentence Dec  27th]. During this subsidence, the absolute amount of water vapor doesn’t increase (no source of new water vapor), but the temperature does increase. Therefore, the relative humidity (RH) – the amount of water vapor present vs the maximum that could be held – keeps decreasing.

Here is the annual average of relative humidity (originally shown in Clouds and Water Vapor – Part Two):

From Soden (2006)

Figure 2

The tropical troposphere is moist, while the sub-tropics are much drier. Here is the frequency of very low humidity at 500hPa (about 5.8 km altitude) from Roca et al (2012):

From Roca et al 2012

Figure 3

And from the same paper, a longer term average of the free tropospheric humidity (FTH = humidity above the boundary layer) to the left and the frequency of occurrence of very low humidity (<10%) to the right:

From Roca et al 2012

Figure 4

Why are we interested in very low humidity?

Pierrehumbert 1995

There are a number of climate scientists with a significant contribution to the study of water vapor in climate, and with apologies to people I have missed, my own informal list includes Richard S Lindzen, Kenneth Minschwaner, Kerry Emmanuel, Isaac M Held, Brian J Soden, Raymond T Pierrehumbert, Steven C Sherwood, Andrew E Dessler, Rémy Roca.

Pierrehumbert wrote a 1995 paper, Thermostats, radiator fins, and the local runaway greenhouse, which seems to be somewhat out of date now but a good starting point to illustrate some important concepts. (A more comprehensive paper on the background to this topic is Pierrehumbert’s 1999 paper, reference below).

The author comments:

Our version of the single-cell model is distinguished primarily by a choice of some radical simplifications that allow us to bring out the central behavior transparently. The chief utility of the model is didactic. We introduce it to bring out in concrete terms the repercussions of some of the phenomena discussed in section 3. It has too many adjustable parameters and too much missing physics to enable reliable quantitative projections of climate change to be made, but it will be nonetheless of interest to see whether such a model can be made to yield earthlike conditions..

[Emphasis added]. For those who are unfamiliar with climate models, this is much much much simpler than any real climate model. As an aside Isaac Held has a great article on the rationale for, and problem of, simplifying climate models in The ‘Fruit Fly’ of Climate Models. It’s an article more about making simpler GCM’s than about making 2-box models, but the points are still valid.

Below, the tropics represented in two parts – the convective region with high humidity, and the subsiding region with low humidity.

From Pierrehumbert 1995

Figure 5

The essence of the main part of his paper is that the tropical atmosphere, with high humidity, is not very efficient at radiating away the large amounts of solar heat absorbed, while the low humidity subsiding region is much more effective at this.

Here is a simplified example demonstrating the problem of radiating away high incident solar radiation as relative humidity (RH) increases (very simplified because this atmospheric profile has a constant RH above the boundary layer):

From Pierrehumbert 1995

Figure 6

Pierrehumbert comments:

From Fig. 2 [figure 6 in this article] we see that if the full annual-mean insolation of 420 W/m² were absorbed, T(0) would run away to temperatures in excess of 340K for any relative humidity greater than 25%. Even in Sc [solar radiation] is reduced to 370 W/m² to account for the mean clear sky albedo in the tropics, the temperature would run away for relative humidities as low as 50%.

Considered locally, the present-day tropics would thus be in a runaway state (or nearly so) so long as it is sufficiently close to saturation.

Clouds do not alter this conclusion because insofar as Cs + Cl = 0 in the tropics the reduction in solar absorption is compensated by an equal reduction in OLR. In order to stabilize the tropical runaway, one must appeal to the lateral heat transports out of the moist regions. Satellite observations show OLR of 300 W/m² or less over the warmest tropical oceans, confirming the inability of the warmest oceans to get rid of the absorbed solar radiation locally.

(See Note 1).

So, of course, one well known mechanism for tropical cooling is export of heat to higher latitudes. Basic climate texts demonstrate that this takes place as a matter of course by plotting the absorbed solar radiation vs OLR by latitude. The tropics absorb more energy than they radiate, while the poles radiate more than they absorb. The average poleward transport of energy by latitude can be calculated as a result.

The other mechanism of tropical cooling takes place in the subsiding regions of the tropics.

Pierrehumbert comments (on his simple model):

The warm pool atmosphere cannot get rid of its heat, because of the strong water vapor greenhouse effect; this heat must be exported via zonal and meridional heat fluxes, to drier regions where it can be radiated to space. These dry, non-convective regions act like “radiator fins” stuck into the side of the warm pool atmosphere. The “super greenhouse” shape of the clear-sky OLR curve in the analysis of Raval and Ramanathan (1989) and Ramanathan and Collins (1991) provides direct evidence for radiator fins, since it shows that OLR is generally higher in some cooler SST regions than it is over the warmest tropical waters.

How does Air at the Tropopause Subside?

The air at the tropopause is very cold. Why doesn’t it sink down below the warmer air underneath?

This question was answered in Potential Temperature. Air that rises cools even without any exchange of heat with the surroundings (due to losing internal energy while doing work expanding against the lower pressure).

Air that sinks warms without any exchange of heat with the surroundings (due to gaining internal energy from work done on it by the compression of the higher pressure atmosphere).

And the formulas for both of these processes are very simple and well-understood. So the important graph is the graph of potential temperature vs altitude (or pressure), which shows what temperature each parcel of air would have if it was moved to the surface without any exchange of heat. It allows us to properly compare air temperature at different heights (pressures).

We see that potential temperature – the real comparison metric – increases with height. This is to be expected – warmer air floats above cooler air:

From Marshall & Plumb (2008)

Figure 7 – Click for a larger image

So, if we take air, warmed by strong solar heating at the surface, and raise it quickly to the tropopause, how does it ever come down?

Consider the air with potential temperature of 360K (almost 87°C if moved adiabatically back to the surface). If it starts to sink it warms (due to compression by the atmosphere) and its natural buoyancy pushes it back up.

Radiative Cooling

The mechanism for air to subside involves losing heat “diabatically”. Adiabatic means no exchange of heat with surroundings, which can happen with rapid air movement during convection. Diabatic means there is an exchange of heat with the surroundings.

And as the air cools it sinks. (Its actual & potential temperature decreases, allowing it to sink, but then compressional warming takes place and its actual temperature increases).

From Minschwaner & McElroy 1992

Figure 8

If there was no radiative cooling there would be no gentle subsidence, at least nothing like the current process we see in the atmosphere.

Skip the next section if you don’t like maths..

Maths Digression

There is an equation for the subsiding region which relates the heating rate (=-cooling rate), H, with two important parameters:

H ∝ cp.ω.∂θ/∂p

where H = heating rate (=-cooling rate), ∝ is the symbol for “proportional to”, c= heat capacity of air under constant pressure, ω = rate of change of pressure with time following the parcel (how fast the parcel is ascending or descending), ∂θ/∂p = change in potential temperature with pressure, so this is a measure of the atmospheric stratification

The two important parameters are:

  • ω – subsidence rate
  • ∂θ/∂p – stratification of the atmosphere

The value H is essentially dependent on the amount of radiatively-active gases in the atmosphere in the subsiding region. There is also an effect from any mixing with extra-tropical colder air.

Results from the Teaching Model

Here is a sample result from Pierrehumbert’s model under some simplified assumptions (no ocean heat transport and no heat transfer between tropics and extra-tropics).

The solid curve is Energy In to the warm pool = absorbed solar – cooling due to atmospheric circulation from the cold pool. The dashed curve is Energy Out from the warm pool:

From Pierrehumbert 1995

From Pierrehumbert 1995

Figure 9

Pierrehumbert makes the comment that the stability of the solution depends on the steepness of the solid curve and this is due to the fixed emissivity of the “cold pool” atmosphere. Remember that the region with subsidence has little water vapor above the boundary layer. In fact, as we will see in the upcoming graphs, it is the ability of the subsiding region to cool via radiation that allows the atmospheric circulation.

Here is set of graphs under the same simplified assumptions (and with RH=100% in the warm pool) showing how the surface temperature (Ts1 = warm pool sea surface temperature, Ts2 = cold pool sea surface temperature) varies with emissivity of the cold pool atmosphere. Each graph is a different ratio of surface area of cold pool vs warm pool. Remember that the “warm pool” is the convecting regions and the “cold pool” is the subsiding regions:

From Pierrehumbert 1995

From Pierrehumbert 1995

Figure 10

We can see that when the emissivity of the cold pool region is very low (when the amount of “greenhouse” gases is very low) the warm pool regions go into a form of thermal runaway. This is because radiative cooling is now very ineffective in the subsiding regions and so the tropical large-scale atmospheric circulation (the Hadley circulation) is “choked up”. If air can’t cool, it can’t descend, and so the circulation slows right down.

Consider the case where there is much less CO2 in the atmosphere – then the emissivity is governed mostly by water vapor. So the dry subsiding region has little ability to radiate any heat to space – preventing subsidence – but the hot moist convecting region cannot radiate sufficient heat to space because the emission to space is coming from higher up in the atmosphere, e.g. see fig. 6, of the water vapor.

So increasing the emissivity from zero (increasing “greenhouse” gases) cools the climate to begin with. Then as the emissivity increases past a certain point the warm pool surface temperatures start to increase again.

And so long as the cold pool area is large enough compared with the warm pool area the temperatures can be quite reasonable – even without any export of heat to higher latitudes.

This is a very interesting result. We see that climate is not “linear”. In simple terms “not linear” means that just because one area cools down by 1°C doesn’t mean that an equal size area must heat up by 1°C.

Now we see a result with slightly more realistic boundary conditions – heat is exported to higher latitudes (and RH reduced to 75% in the warm pool):

From Pierrehumbert 1995

From Pierrehumbert 1995

Figure 11

Overall, the result of the (slightly) more realistic conditions is simply reducing the temperatures. This is not surprising.

Conclusion

The 1995 paper is quite complex and covers more than this topic (note for keen readers, the end of the paper has a summary of all the terms used in the paper, something I wish I had known while trying to make sense of it).

The model is a very simplified model of the atmosphere and can easily be criticized for any of the particular assumptions it makes.

The reason for highlighting the paper and drawing out some of its conclusions is because there is a lot of value in understanding:

  • the large scale circulation
  • its effect on water vapor
  • what factors allow air near the tropopause to cool and descend
  • the non-linearity of climate

Of particular interest might be understanding that more “greenhouse” gases in the subsiding regions allow a faster circulation, which in turn removes more heat from the climate than a slower circulation.

Articles in the Series

Part One – introducing some ideas from Ramanathan from ERBE 1985 – 1989 results

Part One – Responses – answering some questions about Part One

Part Two – some introductory ideas about water vapor including measurements

Part Three – effects of water vapor at different heights (non-linearity issues), problems of the 3d motion of air in the water vapor problem and some calculations over a few decades

Part Four – discussion and results of a paper by Dessler et al using the latest AIRS and CERES data to calculate current atmospheric and water vapor feedback vs height and surface temperature

Part Five – Back of the envelope calcs from Pierrehumbert – focusing on a 1995 paper by Pierrehumbert to show some basics about circulation within the tropics and how the drier subsiding regions of the circulation contribute to cooling the tropics

Part Six – Nonlinearity and Dry Atmospheres – demonstrating that different distributions of water vapor yet with the same mean can result in different radiation to space, and how this is important for drier regions like the sub-tropics

Part Seven – Upper Tropospheric Models & Measurement – recent measurements from AIRS showing upper tropospheric water vapor increases with surface temperature

Part Eight – Clear Sky Comparison of Models with ERBE and CERES – a paper from Chung et al (2010) showing clear sky OLR vs temperature vs models for a number of cases

Part Nine – Data I – Ts vs OLR – data from CERES on OLR compared with surface temperature from NCAR – and what we determine

Part Ten – Data II – Ts vs OLR – more on the data

References

Atmosphere, Ocean and Climate Dynamics, Marshall & Plumb, Elsevier Academic Press (2008)

Tropical and Extra-Tropical influences on the distribution of free tropospheric humidity over the inter-tropical belt, Roca et al, Surveys in Geophysics (2012)

Thermostats, radiator fins, and the local runaway greenhouse, Pierrehumbert, Journal of the Atmospheric Sciences (1995) – free paper

Subtropical Water Vapor As a Mediator of Rapid Global Climate Change, Pierrehumbert, (1999)

Notes

Note 1 – The statement:

Clouds do not alter this conclusion because insofar as Cs + Cl = 0 in the tropics the reduction in solar absorption is compensated by an equal reduction in OLR

relates to the fact that in the tropical region the overall cloud effect is close to zero. This is surprising and the subject of much study. For a starting point see On the Observed Near Cancellation between Longwave and Shortwave Cloud Forcing in Tropical Regions, J.T. Kiehl, Journal of Climate (1994)

Read Full Post »

Older Posts »