A couple of recent articles covered ground related to clouds, but under Models –Models, On – and Off – the Catwalk – Part Seven – Resolution & Convection & Part Five – More on Tuning & the Magic Behind the Scenes. In the first article Andrew Dessler, day job climate scientist, made a few comments and in one comment provided some great recent references. One of these was by Paulo Ceppi and colleagues published this year and freely accessible. Another paper with some complementary explanations is from Mark Zelinka and colleagues, also published this year (but behind a paywall).
In this article we will take a look at the breakdown these papers provide. There is a lot to the Ceppi paper so we’re not going to review it all in this article, hopefully in a followup article.
Globally and annually averaged, clouds cool the planet by around 18W/m² – that’s large compared with the radiative effect of doubling CO2, a value of 3.7W/m². The net effect is made up of two larger opposite effects:
- cooling from reflecting sunlight (albedo effect) of about 46W/m²
- warming from the radiative effect of about 28W/m² – clouds absorb terrestrial radiation and reemit from near the top of the cloud where it is colder, this is like the “greenhouse” effect
In this graphic, Zelinka and colleagues show the geographical breakdown of cloud radiative effect averaged over 15 years from CERES measurements:
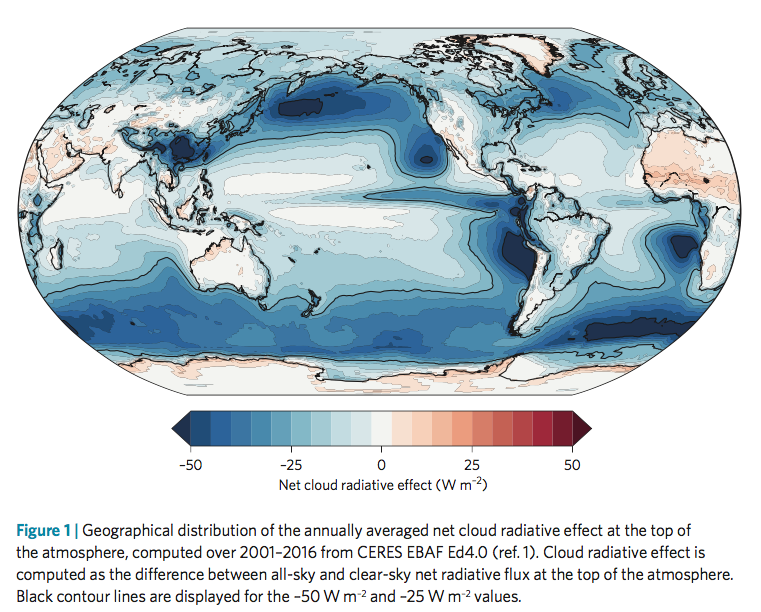
From Zelinka et al 2017
Figure 1 – Click to enlarge
Note that the cloud radiative effect shown above isn’t feedbacks from warming, it is simply the current effect of clouds. The big question is how this will change with warming.
In the next graphic, the inset in the top shows cloud feedback (note 1) vs ECS from 28 GCMs. ECS is the steady state temperature resulting from doubling CO2. Two models are picked out – red and blue – and in the main graph we see simulated warming under RCP8.5 (an unlikely future world confusing described by many as the “business as usual” scenario).
In the bottom graphic, cloud feedbacks from models are decomposed into the effect from low cloud amount, from changing high cloud altitude and from low cloud opacity. We see that the amount of low cloud is the biggest feedback with the widest spread, followed by the changing altitude of high clouds. And both of them have a positive feedback. The gray lines extending out cover the range of model responses.
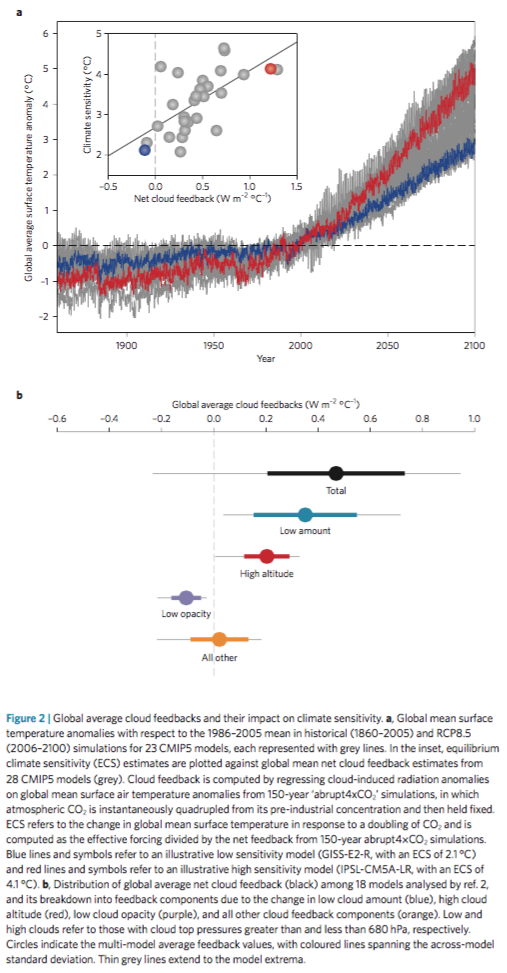
From Zelinka et al 2017
Figure 2 – Click to enlarge
In the next figure – click to enlarge – they show the progression in each IPCC report, helpfully color coded around the breakdown above:
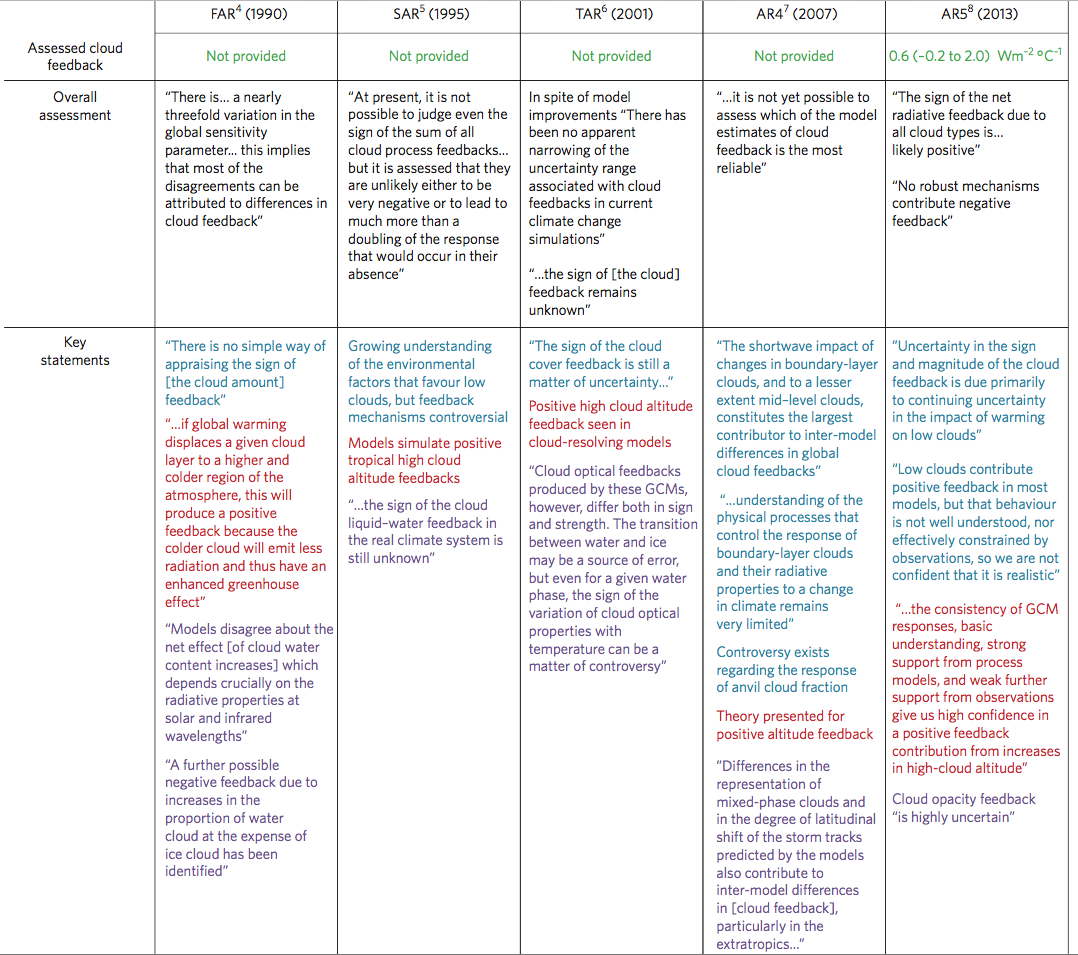
From Zelinka et al 2017
Figure 3 – Click to enlarge
On AR5:
Notably, the high cloud altitude feedback was deemed positive with high confidence due to supporting evidence from theory, observations, and high-resolution models. On the other hand, continuing low confidence was expressed in the sign of low cloud feedback because of a lack of strong observational constraints. However, the AR5 authors noted that high-resolution process models also tended to produce positive low cloud cover feedbacks. The cloud opacity feedback was deemed highly uncertain due to the poor representation of cloud phase and microphysics in models, limited observations with which to evaluate models, and lack of physical understanding. The authors noted that no robust mechanisms contribute a negative cloud feedback.
And on work since:
In the four years since AR5, evidence has increased that the overall cloud feedback is positive. This includes a number of high-resolution modelling studies of low cloud cover that have illuminated the competing processes that govern changes in low cloud coverage and thickness, and studies that constrain long-term cloud responses using observed short-term sensitivities of clouds to changes in their local environment. Both types of analyses point toward positive low cloud feedbacks. There is currently no evidence for strong negative cloud feedbacks..
Onto Ceppi et al 2017. In the graph below we see climate feedback from models broken out into a few parameters
- WV+LR – the combination of water vapor and lapse rate changes (lapse rate is the temperature profile with altitude)
- Albedo – e.g. melting sea ice
- Cloud total
- LW cloud – this is longwave effects, i.e., how clouds change terrestrial radiation emitted to space
- SW cloud- this is shortwave effects, i.e., how clouds reflect solar radiation back to space
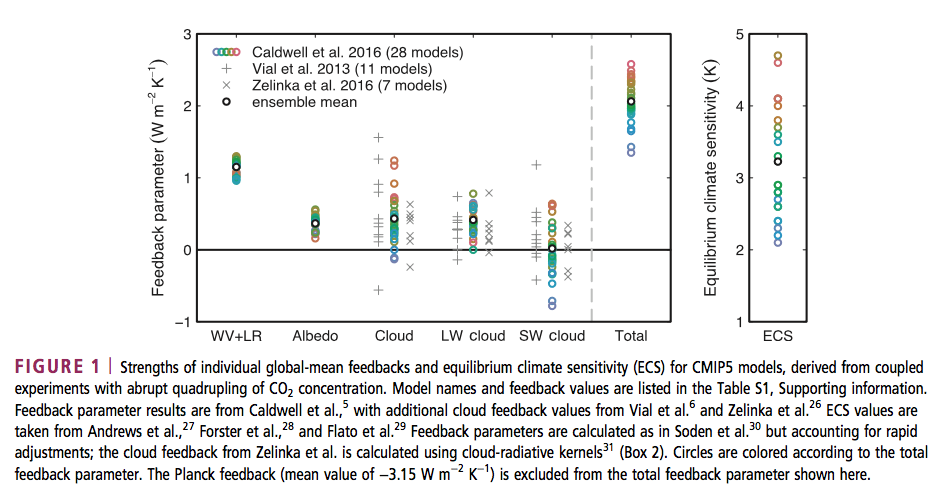
From Ceppi et al 2017
Figure 4 – Click to enlarge
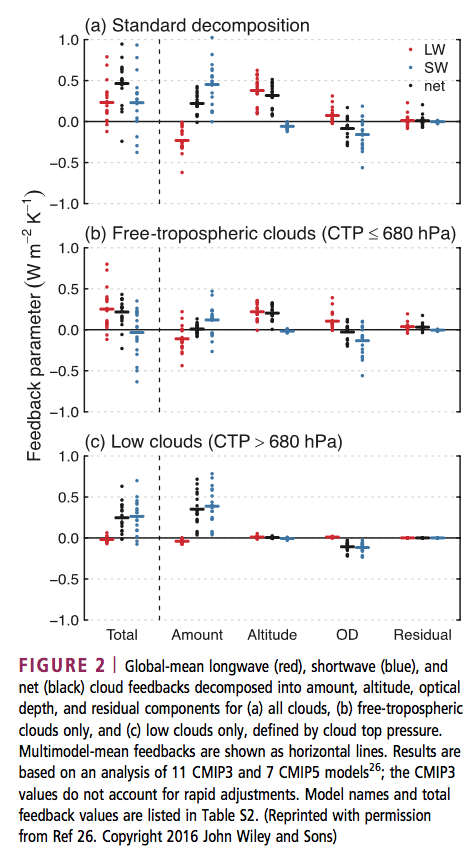
Then they break down the cloud feedback further. This graph is well worth understanding. For example, in the second graph (b) we are looking at higher altitude clouds. We see that the increasing altitude of high clouds causes a positive feedback. The red dots are LW (longwave = terrestrial radiation). If high clouds increase in altitude the radiation from these clouds to space is lower because the cloud tops are colder. This is a positive feedback (more warming retained in the climate system). The blue dots are SW (shortwave = solar radiation). If high clouds increase in altitude it has no effect on the reflection of solar radiation – and so the blue dots are on zero.
Looking at the low clouds – bottom graph (c) – we see that the feedback is almost all from increasing reflection of solar radiation from increasing amounts of low clouds.
From Ceppi et al 2017
Figure 5
Now a couple more graphs from Ceppi et al – the spatial distribution of cloud feedback from models (note this is different from our figure 1 which showed current cloud radiative effect):
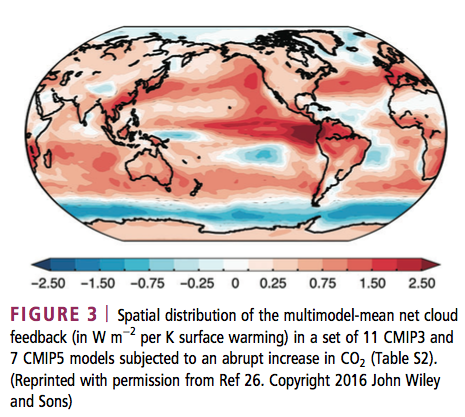
From Ceppi et al 2017
Figure 6
And the cloud feedback by latitude broken down into: altitude effects; amount of cloud; and optical depth (higher optical depth primarily increases the reflection to space of solar radiation but also has an effect on terrestrial radiation).
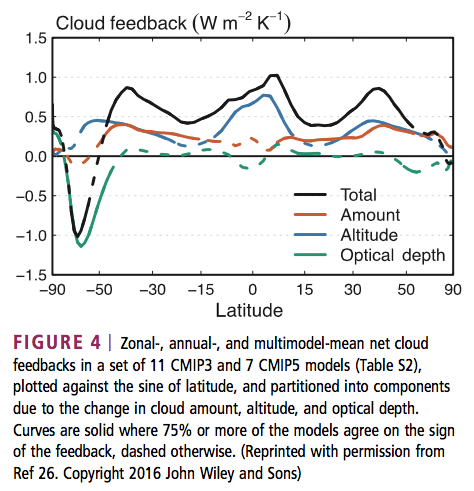
From Ceppi et al 2017
Figure 7
They state:
The patterns of cloud amount and optical depth changes suggest the existence of distinct physical processes in different latitude ranges and climate regimes, as discussed in the next section. The results in Figure 4 allow us to further refine the conclusions drawn from Figure 2. In the multi- model mean, the cloud feedback in current GCMs mainly results from:
- globally rising free-tropospheric clouds
- decreasing low cloud amount at low to middle latitudes, and
- increasing low cloud optical depth at middle to high latitudes
Cloud feedback is the main contributor to intermodel spread in climate sensitivity, ranging from near zero to strongly positive (−0.13 to 1.24 W/m²K) in current climate models.
It is a combination of three effects present in nearly all GCMs: rising free- tropospheric clouds (a LW heating effect); decreasing low cloud amount in tropics to midlatitudes (a SW heating effect); and increasing low cloud optical depth at high latitudes (a SW cooling effect). Low cloud amount in tropical subsidence regions dominates the intermodel spread in cloud feedback.
Happy Christmas to all Science of Doom readers.
Note – if anyone wants to debate the existence of the “greenhouse” effect, please add your comments to Two Basic Foundations or The “Greenhouse” Effect Explained in Simple Terms or any of the other tens of articles on that subject. Comments here on the existence of the “greenhouse” effect will be deleted.
References
Cloud feedback mechanisms and their representation in global climate models, Paulo Ceppi, Florent Brient, Mark D Zelinka & Dennis Hartmann, IREs Clim Change 2017 – free paper
Clearing clouds of uncertainty, Mark D Zelinka, David A Randall, Mark J Webb & Stephen A Klein, Nature 2017 – paywall paper
Notes
Note 1: From Ceppi et al 2017: CLOUD-RADIATIVE EFFECT AND CLOUD FEEDBACK:
The radiative impact of clouds is measured as the cloud-radiative effect (CRE), the difference between clear-sky and all-sky radiative flux at the top of atmosphere. Clouds reflect solar radiation (negative SW CRE, global-mean effect of −45W/m²) and reduce outgoing terrestrial radiation (positive LW CRE, 27W/m²−2), with an overall cooling effect estimated at −18W/m² (numbers from Henderson et al.).
CRE is proportional to cloud amount, but is also determined by cloud altitude and optical depth.
The magnitude of SW CRE increases with cloud optical depth, and to a much lesser extent with cloud altitude.
By contrast, the LW CRE depends primarily on cloud altitude, which determines the difference in emission temperature between clear and cloudy skies, but also increases with optical depth. As the cloud properties change with warming, so does their radiative effect. The resulting radiative flux response at the top of atmosphere, normalized by the global-mean surface temperature increase, is known as cloud feedback.
This is not strictly equal to the change in CRE with warming, because the CRE also responds to changes in clear-sky radiation—for example, due to changes in surface albedo or water vapor. The CRE response thus underestimates cloud feedback by about 0.3W/m² on average. Cloud feedback is therefore the component of CRE change that is due to changing cloud properties only. Various methods exist to diagnose cloud feedback from standard GCM output. The values presented in this paper are either based on CRE changes corrected for noncloud effects, or estimated directly from changes in cloud properties, for those GCMs providing appropriate cloud output. The most accurate procedure involves running the GCM radiation code offline—replacing instantaneous cloud fields from a control climatology with those from a perturbed climatology, while keeping other fields unchanged—to obtain the radiative perturbation due to changes in clouds. This method is computationally expensive and technically challenging, however.


The Debate is Over – 99% of Scientists believe Gravity and the Heliocentric Solar System so therefore..
Posted in Commentary on August 1, 2017| 171 Comments »
At least 99.9% of physicists believe the theory of gravity, and the heliocentric model of the solar system. The debate is over. There is no doubt that we can send a manned (and woman-ed) mission to Mars.
Some “skeptics” say it can’t be done. They are denying basic science! Gravity is plainly true. So is the heliocentric model. Everyone agrees. There is an overwhelming consensus. So the time for discussion is over. There is no doubt about the Mars mission.
I create this analogy (note 1) for people who don’t understand the relationship between five completely different ideas:
The first two items on the list are fundamental physics and chemistry, and while advanced to prove (see The “Greenhouse” Effect Explained in Simple Terms for the first one) to people who want to work through a proof, they are indisputable. Together they create the theory of AGW (anthropogenic global warming). This says that humans are contributing to global warming by burning fossil fuels.
99.9% of people who understand atmospheric physics believe this unassailable idea (note 2).
This means that if we continue with “business as usual” (note 3) and keep using fossil fuels to generate energy, then by 2100 the world will be warmer than today.
For that we need climate models.
Climate Models
These are models which break the earth’s surface, ocean and atmosphere into a big grid so that we can use physics equations (momentum, heat transfer and others) to calculate future climate (this class of model is called finite element analysis). These models include giant fudge-factors that can’t be validated (by giant fudge factors I mean “sub-grid parameterizations” and unknown parameters, but I’m writing this article for a non-technical audience).
One way to validate models is to model the temperature over the last 100 years. Another way is to produce a current climatology that matches observations. Generally temperature is the parameter with most attention (note 4).
Some climate models predict that if we double CO2 in the atmosphere (from pre-industrial periods) then surface temperature will be around 4.5ºC warmer. Others that the temperature will be 1.5ºC warmer. And everything in between.
Surely we can just look at which models reproduced the last 100 years temperature anomaly the best and work with those?
From Mauritsen et al 2012
If the model that predicts 1.5ºC in 2100 is close to the past, while the one that predicts 4.5ºC has a big overshoot, we will know that 1.5ºC is a more likely future. Conversely, if the model that predicts 4.5ºC in 2100 is close to the past but the 1.5ºC model woefully under-predicts the last 100 years of warming then we can expect more like 4.5ºC in 2100.
You would think so, but you would be wrong.
All the models get the last 100 years of temperature changes approximately correct. Jeffrey Kiehl produced a paper 10 years ago which analyzed the then current class of models and gently pointed out the reason. Models with large future warming included a high negative effect from aerosols over the last 100 years. Models with small future warming included a small negative effect from aerosols over the last 100 years. So both reproduced the past but with a completely different value of aerosol cooling. You might think we can just find out the actual cooling effect of aerosols around 1950 and then we will know which climate model to believe – but we can’t. We didn’t have satellites to measure the cooling effect of aerosols back then.
This is the challenge of models with many parameters that we don’t know. When a modeler is trying to reproduce the past, or the present, they pick the values of parameters which make the model match reality as best as they can. This is a necessary first step (note 5).
So how warm will it be in 2100 if we double CO2 in the atmosphere?
Models also predict rainfall, drought and storms. But they aren’t as good as they are at temperature. Bray and von Storch survey climate scientists periodically on a number of topics. Here is their response to:
How would you rate the ability of regional climate models to make 50 year projections of convective rain storms/thunder storms? (1 = very poor to 7 = very good)
Similar ratings are obtained for rainfall predictions. The last 50 years has seen no apparent global worsening of storms, droughts and floods, at least according to the IPCC consensus (see Impacts – V – Climate change is already causing worsening storms, floods and droughts).
Sea level is expected to rise between around 0.3m to 0.6m (see Impacts – VI – Sea Level Rise 1 and IX – Sea Level 4 – Sinking Megacities) – this is from AR5 of the IPCC (under scenario RCP6). I mention this because the few people I’ve polled thought that sea level was expected to be 5-10m higher in 2100.
Actual reports with uneventful projections don’t generate headlines.
Crop Models
Crop models build on climate models. Once we know rainfall, drought and temperature we can work out how this impacts crops.
Past predictions of disaster haven’t been very accurate, although they are wildly popular with generating media headlines and book sales, as Paul Ehrlich found to his benefit. But that doesn’t mean future predictions of disaster are necessarily wrong.
There are a number of problems with trying to answer the question.
Even if climate models could predict the global temperature, when it comes to a region the size of, say, northern California their accuracy is much lower. Likewise for rainfall. Models which produce similar global temperature changes often have completely different regional precipitation changes. For example, from the IPCC Special Report on Extremes (SREX), p. 154:
In a warmer world with more CO2 (helps some plants) and maybe more rainfall, or maybe less what can we expect out of crop yields? It’s not clear. The IPCC AR5 wg II, ch 7, p 496:
Of course, as climate changes over the next 80 years agricultural scientists will grow different crops, and develop new ones. In 1900, almost half the US population worked in farming. Today the figure is 2-3%. Agriculture has changed unimaginably.
In the left half of this graph we can see global crop yield improvements over 50 years (the right side is projections to 2050):
From Ray et al 2013
Economic Models
What will the oil price be in 2020? Economic models give you the answer. Well, they give you an answer. And if you consult lots of models they give you lots of different answers. When the oil price changes a lot, which it does from time to time, all of the models turn out to be wrong. Predicting future prices of commodities is very hard, even when it is of paramount concern for major economies, and even when a company could make vast profits from accurate prediction.
AR5 of the IPCC report, wg 2, ch 7, p.512, had this to say about crop prices in 2050:
In 2001, the 3rd report (often called TAR) said, ch 5, p.238, perhaps a little more clearly:
Economic models are not very good at predicting anything. As Herbert Stein said, summarizing a lifetime in economics:
Conclusion
Recently a group, Cook et al 2013, reviewed over 10,000 abstracts of climate papers and concluded that 97% believed in the proposition of AGW – the proposition that humans are contributing to global warming by burning fossil fuels. I’m sure if the question were posed the right way directly to thousands of climate scientists, the number would be over 99%.
It’s not in dispute.
AGW is a necessary theory for Catastrophic Anthropogenic Global Warming (CAGW). But not sufficient by itself.
Likewise we know for sure that gravity is real and the planets orbit the sun. But it doesn’t follow that we can get humans safely to Mars and back. Maybe we can. Understanding gravity and the heliocentric theory is a necessary condition for the mission, but a lot more needs to be demonstrated.
The uncertainties in CAGW are huge.
Economic models that have no predictive skill are built on limited crop models which are built on climate models which have a wide range of possible global temperatures and no consensus on regional rainfall.
Human ingenuity somehow solved the problem of going from 2.5bn people in the middle of the 20th century to more than 7bn people today, and yet the proportion of the global population in abject poverty (note 6) has dropped from over 40% to maybe 15%. This was probably unimaginable 70 years ago.
Perhaps reasonable people can question if climate change is definitely the greatest threat facing humanity?
Perhaps questioning the predictive power of economic models is not denying science?
Perhaps it is ok to be unsure about the predictive power of climate models that contain sub-grid parameterizations (giant fudge factors) and that collectively provide a wide range of forecasts?
Perhaps people who question the predictions aren’t denying basic (or advanced) science, and haven’t lost their reason or their moral compass?
—-
[Note to commenters, added minutes after this post was written – this article is not intended to restart debate over the “greenhouse” effect, please post your comments in one of the 10s (100s?) of articles that have covered that subject, for example – The “Greenhouse” Effect Explained in Simple Terms – Comments on the reality of the “greenhouse” effect posted here will be deleted. Thanks for understanding.]
References
Twentieth century climate model response and climate sensitivity, Jeffrey Kiehl (2007)
Tuning the climate of a global model, Mauritsen et al (2012)
Yield Trends Are Insufficient to Double Global Crop Production by 2050, Deepak K. Ray et al (2013)
Quantifying the consensus on anthropogenic global warming in the scientific literature, Cook et al, Environmental Research Letters (2013)
The Great Escape, Angus Deaton, Princeton University Press (2013)
The various IPCC reports cited are all available at their website
Notes
1. An analogy doesn’t prove anything. It is for illumination.
2. How much we have contributed to the last century’s warming is not clear. The 5th IPCC report (AR5) said it was 95% certain that more than 50% of recent warming was caused by human activity. Well, another chapter in the same report suggested that this was a bogus statistic and I agree, but that doesn’t mean I think that the percentage of warming caused by human activity is lower than 50%. I have no idea. It is difficult to assess, likely impossible. See Natural Variability and Chaos – Three – Attribution & Fingerprints for more.
3. Reports on future climate often come with the statement “under a conservative business as usual scenario” but refer to a speculative and hard to believe scenario called RCP8.5 – see Impacts – II – GHG Emissions Projections: SRES and RCP. I think RCP 6 is much closer to the world of 2100 if we do little about carbon emissions and the world continues on the kind of development pathways that we have seen over the last 60 years. RCP8.5 was a scenario created to match a possible amount of CO2 in the atmosphere and how we might get there. Calling it “a conservative business as usual case” is a value-judgement with no evidence.
4. More specifically the change in temperature gets the most attention. This is called the “temperature anomaly”. Many models that do “well” on temperature anomaly actually do quite badly on the actual surface temperature. See Models, On – and Off – the Catwalk – Part Four – Tuning & the Magic Behind the Scenes – you can see that many “fit for purpose” models have current climate halfway to the last ice age even though they reproduce the last 100 years of temperature changes pretty well. That is, they model temperature changes quite well, but not temperature itself.
5. This is a reasonable approach used in modeling (not just climate modeling) – the necessary next step is to try to constrain the unknown parameters and giant fudge factors (sub-grid parameterizations). Climate scientists work very hard on this problem. Many confused people writing blogs think that climate modelers just pick the values they like, produce the model results and go have coffee. This is not the case, and can easily be seen by just reviewing lots of papers. The problem is well-understood among climate modelers. But the world is a massive place, detailed past measurements with sufficient accuracy are mostly lacking, and sub-grid parameterizations of non-linear processes are a very difficult challenge (this is one of the reasons why turbulent flow is a mostly unsolved problem).
6. This is a very imprecise term. I refer readers to the 2015 Nobel Prize winner Angus Deaton and his excellent book, The Great Escape (2013) for more.
Read Full Post »